GRETL. (Gnu Regression, Econometrics and. Time-series Library)
|
|
|
- Dennis Horton
- 10 years ago
- Views:
Transcription
1 1 GRETL (Gnu Regression, Econometrics and Time-series Library)

2 2 In this project you should analyze generated and real data. Analysis of each set of data should contain: a) Descriptive statistics. b) Time series plot. c) Checking of normality. d) If data are non-stationary take, for example log-differences to assure stationarity. e) Descriptive statistics, time series plot, checking of normality, analysis of stationarity of new data. f) Analysis of correlogram, finding AR and MA processes order. g) Estimating ARMA processes (in gretl) h) Compare estimated models using information criterions. i) Choosing the best ARMA model. j) Estimating ARMA-GARCH processes (in Ox) k) Compare estimated models using information criterions. l) Choosing the best ARMA-GARCH model.
 Estimating ARMA processes (in gretl) h) Compare estimated models using information criterions. i) Choosing the best ARMA model.")
3 3 Projekty oddajemy w wersji papierowej. Kazdy projekt bedzie "broniony" indywidualnie. W projekcie prosze zamiescic kolejne kroki dochodzenia do ostatecznego modelu (co obserwujemy, jakie modele beda rozpatrywane w zwiazki z tym, jakie sa kryteria wyboru optymalnego modelu itd, warto porobic troche rysunkow) Which financial time series features do you observe? Which class of models do you chose and why? What are the probably orders of the models? Which model is the best for given data? Is it really the best existing model? wygenerowane dane pochodza z modeli poznanych na wykladzie -ARMA + szeroka klasa modeli GARCH z roznymi efektami + rozne rozklady warunkowe rzedy modeli sa zdroworozsadkowe czyli zawiaraja sie w ARMA(2,2), GARCH(2,1) proponowane narzedzia do analizy to GRETL oraz OX z pakietem G@rch

4 4 1. How to get and install gretl a) Go to page or and download gretl (Section Gretl for Windows, gretl exe)

5 5 b) Install gretl with default parameters After that, gretl will be installed, but usually in Polish language, to run gretl in English language you have to click: Narzędzia -> Ustawienia -> Ogólne or Tools -> Preferences -> General Choose Wybór języka dla GUI -> English


6 Choose Wybór języka dla GUI -> English or Language Preserence -> Polish 6

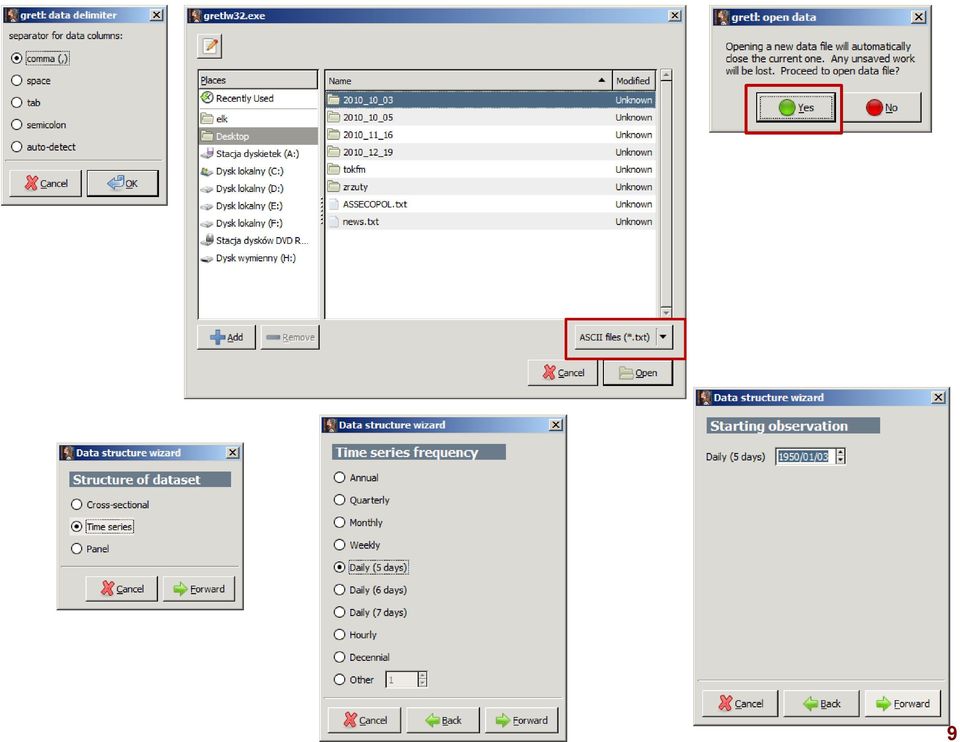
7 7 2. To load data to gretl from ASCI (text) file, you have to choose from menu: File -> Open data -> Import -> Text/CSV When gretl loads chosen file it will open window with question about structure of data. Answer Yes a) Choose Time series, then click Forward b) Choose Daily (5 days), then click Forward c) Type 1970/01/01 as a starting date, then click Forward (any other date will do) d) Click Apply (if everything is OK).
 d) Click Apply (if everything")

8 8


9 9

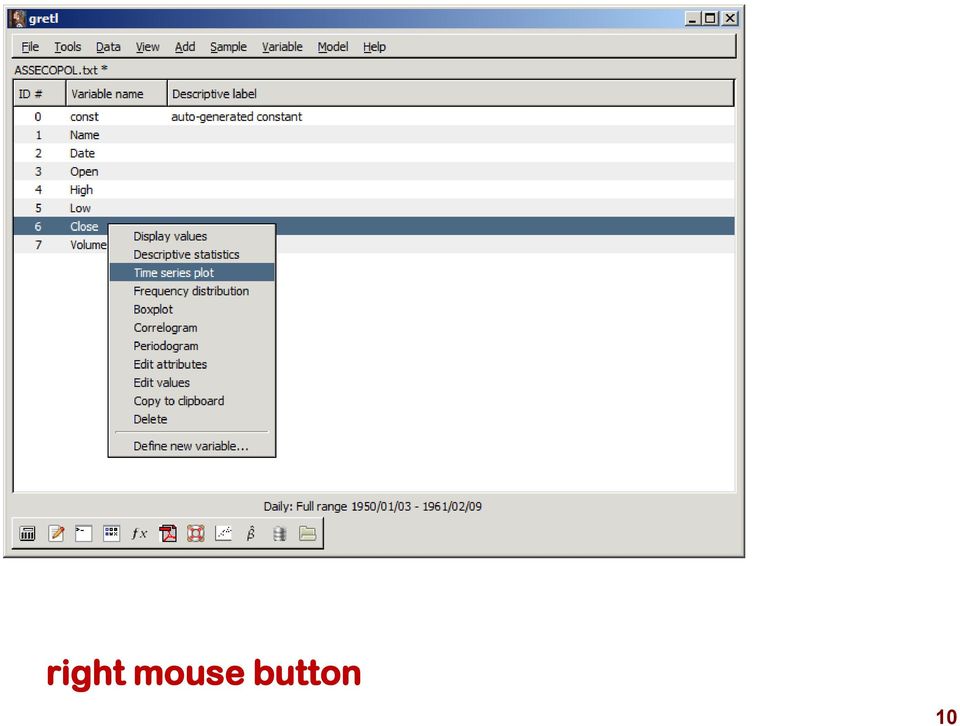
10 right mouse button 10
11 11 3. To load data to gretl from Excel file: File -> Open data -> Import -> Excell Gretl will open first window, click Yes. Then it will open next window with the same question like previous, so you have to choose the same steps.

12 5. With loaded and set data you can: a) Get a time series plot: click with right mouse button second variable name (first is a constant added by gretl) and choose Time series plot b) Get a descriptive statistics: click with right mouse button and choose Descriptive statistics c) Get a correlogram: click with right mouse button and choose Correlogram (you have to choose a proper lag, in most cases the default lag will be good) After choosing lag two windows will open, first with graph of autocorrelation and partial autocorrelation, second with coefficient of autocorrelation and partial autocorrelation functions (with significance of each coefficient). 12
.")
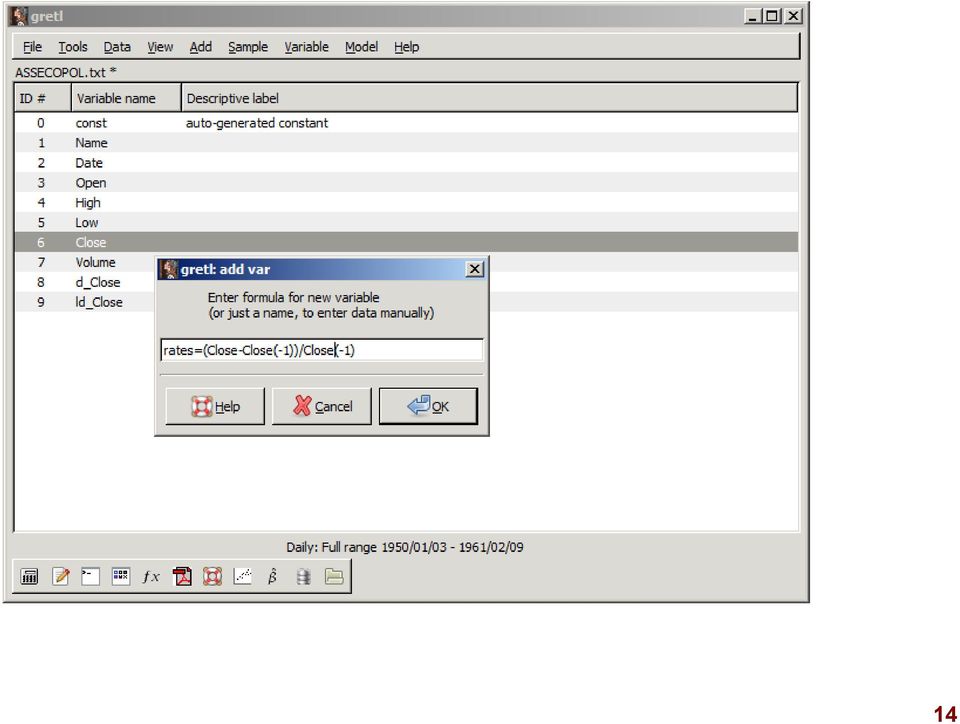
13 13 6. Transformations of variables: a) returns: Add -> Define new variable In opened window type: new_variable = (x x(-1))/x(-1) where x name of variable b) logarithmic returns: Add -> Log differences of selected variables


14 14

15 15 8. Checking of normality: Variable -> Frequency distribution Variable -> Frequency distribution-> Against Normal Q-Q plot for rates 6 y = x Normal quantiles


16 16 The lower the p-value, the less likely the result is if the null hypothesis is true, and consequently the more "significant" the result is, in the sense of statistical significance. One often rejects the null hypothesis when the p-value is less than 0.05 or 0.01, corresponding respectively to a 5% or 1% chance of rejecting the null hypothesis when it is true (Type I error).


17 17 9. Checking AR and MA processes order: Variable -> Correlogram other data than APATOR!! ACF for Data /T^ lag PACF for Data /T^ lag

 Model -> Time")
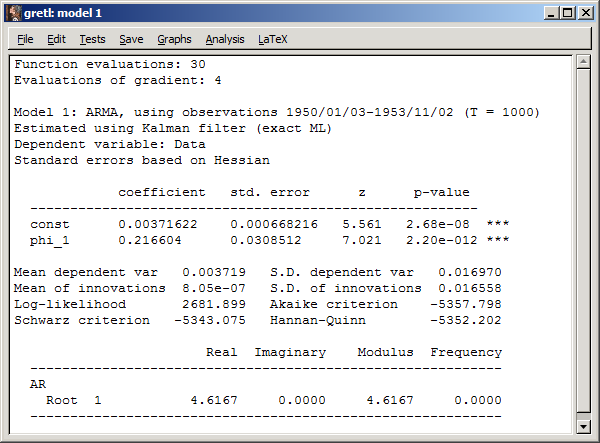
18 Estimating ARMA processes: a) Model -> Time series -> ARIMA b) Choose dependent variable.
")

19 H0: parameter insignificant p-value<0.05 reject H0 19

20 You can save the residuals of model by choosing Save->Residuals in the window with models characteristics


21 21 ACF for uhat /T^ lag PACF for uhat /T^ lag

22 TEST of ARCH effect in residuals 22

23 GARCH models 23

24 GARCH model 24
25 Example data_gretl.xls 25
 25 20 15 10 5 0-0.04-0.02 0 0.02 0.04 0.")
26 Density 26 Example data_gretl.xls 30 Test statistic for normality: Chi-squared(2) = pvalue = Data N( , ) Data
27 27 Example data_gretl.xls ACF for Data /T^ lag PACF for Data /T^ lag
28 28
29 29
30 30 Residual ACF /T^ lag Residual PACF /T^ lag
31 31
32 32 check the normality of ARMA residuals do the ARCH test
 = 21.7633 with p-value = 1.")
33 33 Test for normality of residual - Null hypothesis: error is normally distributed Test statistic: Chi-square(2) = with p-value = 1.88e-005
34 34
35 35 Test for ARCH of order 5 - Null hypothesis: no ARCH effect is present Test statistic: LM = with p-value = P(Chi-square(5) > ) = e-018 Test for ARCH of order 5 coefficient std. error t-ratio p-value alpha(0) e e-012 *** alpha(1) e-08 *** alpha(2) * alpha(3) alpha(4) *** alpha(5) ***

36 36
37 Density standardized residuals Test statistic for normality: Chi-squared(2) = pvalue = uhat6 N( ,1.0021) uhat6 37
38 squared residuals of ARMA model 38
39 39 squared standardized residuals ACF for usq /T^ lag PACF for usq /T^ lag
40 Density 40 if it is not Gaussian distribution we need t-student distribution or skewed t-st leverage effect OX + G@rch Test statistic for normality: Chi-squared(2) = pvalue = uhat6 N( ,1.0021) uhat6
Booth School of Business, University of Chicago Business 41202, Spring Quarter 2015, Mr. Ruey S. Tsay. Solutions to Midterm
 Booth School of Business, University of Chicago Business 41202, Spring Quarter 2015, Mr. Ruey S. Tsay Solutions to Midterm Problem A: (30 pts) Answer briefly the following questions. Each question has
Promotional Forecast Demonstration
 Exhibit 2: Promotional Forecast Demonstration Consider the problem of forecasting for a proposed promotion that will start in December 1997 and continues beyond the forecast horizon. Assume that the promotion
Time Series Analysis
 Time Series Analysis Identifying possible ARIMA models Andrés M. Alonso Carolina García-Martos Universidad Carlos III de Madrid Universidad Politécnica de Madrid June July, 2012 Alonso and García-Martos
Time Series - ARIMA Models. Instructor: G. William Schwert
 APS 425 Fall 25 Time Series : ARIMA Models Instructor: G. William Schwert 585-275-247 [email protected] Topics Typical time series plot Pattern recognition in auto and partial autocorrelations
KSTAT MINI-MANUAL. Decision Sciences 434 Kellogg Graduate School of Management
 KSTAT MINI-MANUAL Decision Sciences 434 Kellogg Graduate School of Management Kstat is a set of macros added to Excel and it will enable you to do the statistics required for this course very easily. To
Analysis of the Volatility of the Electricity Price in Kenya Using Autoregressive Integrated Moving Average Model
 Science Journal of Applied Mathematics and Statistics 2015; 3(2): 47-57 Published online March 28, 2015 (http://www.sciencepublishinggroup.com/j/sjams) doi: 10.11648/j.sjams.20150302.14 ISSN: 2376-9491
Vector Time Series Model Representations and Analysis with XploRe
 0-1 Vector Time Series Model Representations and Analysis with plore Julius Mungo CASE - Center for Applied Statistics and Economics Humboldt-Universität zu Berlin [email protected] plore MulTi Motivation
Software Review: ITSM 2000 Professional Version 6.0.
 Lee, J. & Strazicich, M.C. (2002). Software Review: ITSM 2000 Professional Version 6.0. International Journal of Forecasting, 18(3): 455-459 (June 2002). Published by Elsevier (ISSN: 0169-2070). http://0-
The SAS Time Series Forecasting System
 The SAS Time Series Forecasting System An Overview for Public Health Researchers Charles DiMaggio, PhD College of Physicians and Surgeons Departments of Anesthesiology and Epidemiology Columbia University
Sales forecasting # 2
 Sales forecasting # 2 Arthur Charpentier [email protected] 1 Agenda Qualitative and quantitative methods, a very general introduction Series decomposition Short versus long term forecasting
TIME SERIES ANALYSIS
 TIME SERIES ANALYSIS L.M. BHAR AND V.K.SHARMA Indian Agricultural Statistics Research Institute Library Avenue, New Delhi-0 02 [email protected]. Introduction Time series (TS) data refers to observations
Exam Solutions. X t = µ + βt + A t,
 Exam Solutions Please put your answers on these pages. Write very carefully and legibly. HIT Shenzhen Graduate School James E. Gentle, 2015 1. 3 points. There was a transcription error on the registrar
ITSM-R Reference Manual
 ITSM-R Reference Manual George Weigt June 5, 2015 1 Contents 1 Introduction 3 1.1 Time series analysis in a nutshell............................... 3 1.2 White Noise Variance.....................................
Advanced Forecasting Techniques and Models: ARIMA
 Advanced Forecasting Techniques and Models: ARIMA Short Examples Series using Risk Simulator For more information please visit: www.realoptionsvaluation.com or contact us at: [email protected]
JOHANNES TSHEPISO TSOKU NONOFO PHOKONTSI DANIEL METSILENG FORECASTING SOUTH AFRICAN GOLD SALES: THE BOX-JENKINS METHODOLOGY
 DOI: 0.20472/IAC.205.08.3 JOHANNES TSHEPISO TSOKU North West University, South Africa NONOFO PHOKONTSI North West University, South Africa DANIEL METSILENG Department of Health, South Africa FORECASTING
Time Series Analysis
 Time Series 1 April 9, 2013 Time Series Analysis This chapter presents an introduction to the branch of statistics known as time series analysis. Often the data we collect in environmental studies is collected
Graphical Tools for Exploring and Analyzing Data From ARIMA Time Series Models
 Graphical Tools for Exploring and Analyzing Data From ARIMA Time Series Models William Q. Meeker Department of Statistics Iowa State University Ames, IA 50011 January 13, 2001 Abstract S-plus is a highly
Time Series Analysis: Basic Forecasting.
 Time Series Analysis: Basic Forecasting. As published in Benchmarks RSS Matters, April 2015 http://web3.unt.edu/benchmarks/issues/2015/04/rss-matters Jon Starkweather, PhD 1 Jon Starkweather, PhD [email protected]
Forecasting of Paddy Production in Sri Lanka: A Time Series Analysis using ARIMA Model
 Tropical Agricultural Research Vol. 24 (): 2-3 (22) Forecasting of Paddy Production in Sri Lanka: A Time Series Analysis using ARIMA Model V. Sivapathasundaram * and C. Bogahawatte Postgraduate Institute
Rob J Hyndman. Forecasting using. 11. Dynamic regression OTexts.com/fpp/9/1/ Forecasting using R 1
 Rob J Hyndman Forecasting using 11. Dynamic regression OTexts.com/fpp/9/1/ Forecasting using R 1 Outline 1 Regression with ARIMA errors 2 Example: Japanese cars 3 Using Fourier terms for seasonality 4
Time Series Analysis
 JUNE 2012 Time Series Analysis CONTENT A time series is a chronological sequence of observations on a particular variable. Usually the observations are taken at regular intervals (days, months, years),
TIME SERIES ANALYSIS
 TIME SERIES ANALYSIS Ramasubramanian V. I.A.S.R.I., Library Avenue, New Delhi- 110 012 [email protected] 1. Introduction A Time Series (TS) is a sequence of observations ordered in time. Mostly these
Analysis and Computation for Finance Time Series - An Introduction
 ECMM703 Analysis and Computation for Finance Time Series - An Introduction Alejandra González Harrison 161 Email: [email protected] Time Series - An Introduction A time series is a sequence of observations
Examples. David Ruppert. April 25, 2009. Cornell University. Statistics for Financial Engineering: Some R. Examples. David Ruppert.
 Cornell University April 25, 2009 Outline 1 2 3 4 A little about myself BA and MA in mathematics PhD in statistics in 1977 taught in the statistics department at North Carolina for 10 years have been in
COMP6053 lecture: Time series analysis, autocorrelation. [email protected]
 COMP6053 lecture: Time series analysis, autocorrelation [email protected] Time series analysis The basic idea of time series analysis is simple: given an observed sequence, how can we build a model that
Data analysis and regression in Stata
 Data analysis and regression in Stata This handout shows how the weekly beer sales series might be analyzed with Stata (the software package now used for teaching stats at Kellogg), for purposes of comparing
Threshold Autoregressive Models in Finance: A Comparative Approach
 University of Wollongong Research Online Applied Statistics Education and Research Collaboration (ASEARC) - Conference Papers Faculty of Informatics 2011 Threshold Autoregressive Models in Finance: A Comparative
Time Series Analysis and Forecasting
 Time Series Analysis and Forecasting Math 667 Al Nosedal Department of Mathematics Indiana University of Pennsylvania Time Series Analysis and Forecasting p. 1/11 Introduction Many decision-making applications
THE UNIVERSITY OF CHICAGO, Booth School of Business Business 41202, Spring Quarter 2014, Mr. Ruey S. Tsay. Solutions to Homework Assignment #2
 THE UNIVERSITY OF CHICAGO, Booth School of Business Business 41202, Spring Quarter 2014, Mr. Ruey S. Tsay Solutions to Homework Assignment #2 Assignment: 1. Consumer Sentiment of the University of Michigan.
Time Series Analysis with R - Part I. Walter Zucchini, Oleg Nenadić
 Time Series Analysis with R - Part I Walter Zucchini, Oleg Nenadić Contents 1 Getting started 2 1.1 Downloading and Installing R.................... 2 1.2 Data Preparation and Import in R.................
Time Series Analysis of Aviation Data
 Time Series Analysis of Aviation Data Dr. Richard Xie February, 2012 What is a Time Series A time series is a sequence of observations in chorological order, such as Daily closing price of stock MSFT in
Forecasting the US Dollar / Euro Exchange rate Using ARMA Models
 Forecasting the US Dollar / Euro Exchange rate Using ARMA Models LIUWEI (9906360) - 1 - ABSTRACT...3 1. INTRODUCTION...4 2. DATA ANALYSIS...5 2.1 Stationary estimation...5 2.2 Dickey-Fuller Test...6 3.
Search Marketing Cannibalization. Analytical Techniques to measure PPC and Organic interaction
 Search Marketing Cannibalization Analytical Techniques to measure PPC and Organic interaction 2 Search Overview How People Use Search Engines Navigational Research Health/Medical Directions News Shopping
Chapter 9: Univariate Time Series Analysis
 Chapter 9: Univariate Time Series Analysis In the last chapter we discussed models with only lags of explanatory variables. These can be misleading if: 1. The dependent variable Y t depends on lags of
SPSS Guide: Regression Analysis
 SPSS Guide: Regression Analysis I put this together to give you a step-by-step guide for replicating what we did in the computer lab. It should help you run the tests we covered. The best way to get familiar
Descriptive Statistics
 Descriptive Statistics Descriptive statistics consist of methods for organizing and summarizing data. It includes the construction of graphs, charts and tables, as well various descriptive measures such
Forecasting the PhDs-Output of the Higher Education System of Pakistan
 Forecasting the PhDs-Output of the Higher Education System of Pakistan Ghani ur Rehman, Dr. Muhammad Khalil Shahid, Dr. Bakhtiar Khan Khattak and Syed Fiaz Ahmed Center for Emerging Sciences, Engineering
Time Series Laboratory
 Time Series Laboratory Computing in Weber Classrooms 205-206: To log in, make sure that the DOMAIN NAME is set to MATHSTAT. Use the workshop username: primesw The password will be distributed during the
about is Ox, developed by J.A. Doornik at Nuffield College, Oxford, United Kingdom.
 Economy Informatics, no. 1/2001 35 A software package for time series analysis Adrian HOSPODAR Training Division, RomTelecom, [email protected] Abstract: This paper introduces a software package dedicated
Time Series Analysis
 Time Series Analysis [email protected] Informatics and Mathematical Modelling Technical University of Denmark DK-2800 Kgs. Lyngby 1 Outline of the lecture Identification of univariate time series models, cont.:
Forecasting Using Eviews 2.0: An Overview
 Forecasting Using Eviews 2.0: An Overview Some Preliminaries In what follows it will be useful to distinguish between ex post and ex ante forecasting. In terms of time series modeling, both predict values
How To Model A Series With Sas
 Chapter 7 Chapter Table of Contents OVERVIEW...193 GETTING STARTED...194 TheThreeStagesofARIMAModeling...194 IdentificationStage...194 Estimation and Diagnostic Checking Stage...... 200 Forecasting Stage...205
Does the interest rate for business loans respond asymmetrically to changes in the cash rate?
 University of Wollongong Research Online Faculty of Commerce - Papers (Archive) Faculty of Business 2013 Does the interest rate for business loans respond asymmetrically to changes in the cash rate? Abbas
Some useful concepts in univariate time series analysis
 Some useful concepts in univariate time series analysis Autoregressive moving average models Autocorrelation functions Model Estimation Diagnostic measure Model selection Forecasting Assumptions: 1. Non-seasonal
Using JMP Version 4 for Time Series Analysis Bill Gjertsen, SAS, Cary, NC
 Using JMP Version 4 for Time Series Analysis Bill Gjertsen, SAS, Cary, NC Abstract Three examples of time series will be illustrated. One is the classical airline passenger demand data with definite seasonal
Bill Burton Albert Einstein College of Medicine [email protected] April 28, 2014 EERS: Managing the Tension Between Rigor and Resources 1
 Bill Burton Albert Einstein College of Medicine [email protected] April 28, 2014 EERS: Managing the Tension Between Rigor and Resources 1 Calculate counts, means, and standard deviations Produce
Studying Material Inventory Management for Sock Production Factory
 Studying Inventory Management for Sock Production Factory Pattanapong Ariyasit*, Nattaphon Supawatcharaphorn** Industrial Engineering Department, Faculty of Engineering, Sripatum University E-mail: [email protected]*,
Doing Multiple Regression with SPSS. In this case, we are interested in the Analyze options so we choose that menu. If gives us a number of choices:
 Doing Multiple Regression with SPSS Multiple Regression for Data Already in Data Editor Next we want to specify a multiple regression analysis for these data. The menu bar for SPSS offers several options:
Unit root properties of natural gas spot and futures prices: The relevance of heteroskedasticity in high frequency data
 DEPARTMENT OF ECONOMICS ISSN 1441-5429 DISCUSSION PAPER 20/14 Unit root properties of natural gas spot and futures prices: The relevance of heteroskedasticity in high frequency data Vinod Mishra and Russell
Directions for using SPSS
 Directions for using SPSS Table of Contents Connecting and Working with Files 1. Accessing SPSS... 2 2. Transferring Files to N:\drive or your computer... 3 3. Importing Data from Another File Format...
Time-Series Regression and Generalized Least Squares in R
 Time-Series Regression and Generalized Least Squares in R An Appendix to An R Companion to Applied Regression, Second Edition John Fox & Sanford Weisberg last revision: 11 November 2010 Abstract Generalized
Studying Achievement
 Journal of Business and Economics, ISSN 2155-7950, USA November 2014, Volume 5, No. 11, pp. 2052-2056 DOI: 10.15341/jbe(2155-7950)/11.05.2014/009 Academic Star Publishing Company, 2014 http://www.academicstar.us
Application of ARIMA models in soybean series of prices in the north of Paraná
 78 Application of ARIMA models in soybean series of prices in the north of Paraná Reception of originals: 09/24/2012 Release for publication: 10/26/2012 Israel José dos Santos Felipe Mestrando em Administração
IS THERE SEASONALITY IN THE SENSEX MONTHLY RETURNS? I M Pandey Indian Institute of Management Ahmedabad Vastrapur, Ahmedabad 380015 India
 IS THERE SEASONALITY IN THE SENSEX MONTHLY RETURNS? I M Pandey Indian Institute of Management Ahmedabad Vastrapur, Ahmedabad 380015 India E-mail: [email protected] Web page: http://www.iimahd.ernet.in/~impandey/
Multiple Linear Regression
 Multiple Linear Regression A regression with two or more explanatory variables is called a multiple regression. Rather than modeling the mean response as a straight line, as in simple regression, it is
Data Mining Techniques Chapter 5: The Lure of Statistics: Data Mining Using Familiar Tools
 Data Mining Techniques Chapter 5: The Lure of Statistics: Data Mining Using Familiar Tools Occam s razor.......................................................... 2 A look at data I.........................................................
IBM SPSS Forecasting 22
 IBM SPSS Forecasting 22 Note Before using this information and the product it supports, read the information in Notices on page 33. Product Information This edition applies to version 22, release 0, modification
Introduction to Regression and Data Analysis
 Statlab Workshop Introduction to Regression and Data Analysis with Dan Campbell and Sherlock Campbell October 28, 2008 I. The basics A. Types of variables Your variables may take several forms, and it
MGT 267 PROJECT. Forecasting the United States Retail Sales of the Pharmacies and Drug Stores. Done by: Shunwei Wang & Mohammad Zainal
 MGT 267 PROJECT Forecasting the United States Retail Sales of the Pharmacies and Drug Stores Done by: Shunwei Wang & Mohammad Zainal Dec. 2002 The retail sale (Million) ABSTRACT The present study aims
Turkey s Energy Demand
 Current Research Journal of Social Sciences 1(3): 123-128, 2009 ISSN: 2041-3246 Maxwell Scientific Organization, 2009 Submitted Date: September 28, 2009 Accepted Date: October 12, 2009 Published Date:
9th Russian Summer School in Information Retrieval Big Data Analytics with R
 9th Russian Summer School in Information Retrieval Big Data Analytics with R Introduction to Time Series with R A. Karakitsiou A. Migdalas Industrial Logistics, ETS Institute Luleå University of Technology
NCSS Statistical Software Principal Components Regression. In ordinary least squares, the regression coefficients are estimated using the formula ( )
") Chapter 340 Principal Components Regression Introduction is a technique for analyzing multiple regression data that suffer from multicollinearity. When multicollinearity occurs, least squares estimates
Chapter 340 Principal Components Regression Introduction is a technique for analyzing multiple regression data that suffer from multicollinearity. When multicollinearity occurs, least squares estimates
Data Analysis Tools. Tools for Summarizing Data
 Data Analysis Tools This section of the notes is meant to introduce you to many of the tools that are provided by Excel under the Tools/Data Analysis menu item. If your computer does not have that tool
Module 5: Statistical Analysis
 Module 5: Statistical Analysis To answer more complex questions using your data, or in statistical terms, to test your hypothesis, you need to use more advanced statistical tests. This module reviews the
Chapter 25 Specifying Forecasting Models
 Chapter 25 Specifying Forecasting Models Chapter Table of Contents SERIES DIAGNOSTICS...1281 MODELS TO FIT WINDOW...1283 AUTOMATIC MODEL SELECTION...1285 SMOOTHING MODEL SPECIFICATION WINDOW...1287 ARIMA
FORECAST MODEL USING ARIMA FOR STOCK PRICES OF AUTOMOBILE SECTOR. Aloysius Edward. 1, JyothiManoj. 2
 FORECAST MODEL USING ARIMA FOR STOCK PRICES OF AUTOMOBILE SECTOR Aloysius Edward. 1, JyothiManoj. 2 Faculty, Kristu Jayanti College, Autonomous, Bengaluru. Abstract There has been a growing interest in
USE OF ARIMA TIME SERIES AND REGRESSORS TO FORECAST THE SALE OF ELECTRICITY
 Paper PO10 USE OF ARIMA TIME SERIES AND REGRESSORS TO FORECAST THE SALE OF ELECTRICITY Beatrice Ugiliweneza, University of Louisville, Louisville, KY ABSTRACT Objectives: To forecast the sales made by
Payroll. 4. Print Checks. Table of Contents Print Checks...2 All...3 Department...4 Print Single Posting...5
 4. Print Checks Table of Contents Print Checks...2 All...3 Department...4 Print Single Posting...5 Click on 4. Print Checks from the Main Menu and the following window will appear: The best practice is
Multiple Regression in SPSS This example shows you how to perform multiple regression. The basic command is regression : linear.
 Multiple Regression in SPSS This example shows you how to perform multiple regression. The basic command is regression : linear. In the main dialog box, input the dependent variable and several predictors.
Predicting Indian GDP. And its relation with FMCG Sales
 Predicting Indian GDP And its relation with FMCG Sales GDP A Broad Measure of Economic Activity Definition The monetary value of all the finished goods and services produced within a country's borders
Note 2 to Computer class: Standard mis-specification tests
 Note 2 to Computer class: Standard mis-specification tests Ragnar Nymoen September 2, 2013 1 Why mis-specification testing of econometric models? As econometricians we must relate to the fact that the
IBM SPSS Forecasting 21
 IBM SPSS Forecasting 21 Note: Before using this information and the product it supports, read the general information under Notices on p. 107. This edition applies to IBM SPSS Statistics 21 and to all
Simple Linear Regression Inference
 Simple Linear Regression Inference 1 Inference requirements The Normality assumption of the stochastic term e is needed for inference even if it is not a OLS requirement. Therefore we have: Interpretation
TIME-SERIES ANALYSIS, MODELLING AND FORECASTING USING SAS SOFTWARE
 TIME-SERIES ANALYSIS, MODELLING AND FORECASTING USING SAS SOFTWARE Ramasubramanian V. IA.S.R.I., Library Avenue, Pusa, New Delhi 110 012 [email protected] 1. Introduction Time series (TS) data refers
Network Traffic Modeling and Prediction with ARIMA/GARCH
 Network Traffic Modeling and Prediction with ARIMA/GARCH Bo Zhou, Dan He, Zhili Sun and Wee Hock Ng Centre for Communication System Research University of Surrey Guildford, Surrey United Kingdom +44(0)
Factors affecting online sales
 Factors affecting online sales Table of contents Summary... 1 Research questions... 1 The dataset... 2 Descriptive statistics: The exploratory stage... 3 Confidence intervals... 4 Hypothesis tests... 4
Forecasting areas and production of rice in India using ARIMA model
 International Journal of Farm Sciences 4(1) :99-106, 2014 Forecasting areas and production of rice in India using ARIMA model K PRABAKARAN and C SIVAPRAGASAM* Agricultural College and Research Institute,
Readers will be provided a link to download the software and Excel files that are used in the book after payment. Please visit http://www.xlpert.
 Readers will be provided a link to download the software and Excel files that are used in the book after payment. Please visit http://www.xlpert.com for more information on the book. The Excel files are
Modeling and forecasting regional GDP in Sweden. using autoregressive models
 MASTER THESIS IN MICRODATA ANALYSIS Modeling and forecasting regional GDP in Sweden using autoregressive models Author: Haonan Zhang Supervisor: Niklas Rudholm 2013 Business Intelligence Program School
Time Series in Mathematical Finance
 Instituto Superior Técnico (IST, Portugal) and CEMAT [email protected] European Summer School in Industrial Mathematics Universidad Carlos III de Madrid July 2013 Outline The objective of this short
Preholiday Returns and Volatility in Thai stock market
 Preholiday Returns and Volatility in Thai stock market Nopphon Tangjitprom Martin de Tours School of Management and Economics, Assumption University Bangkok, Thailand Tel: (66) 8-5815-6177 Email: [email protected]
3.1 Stationary Processes and Mean Reversion
 3. Univariate Time Series Models 3.1 Stationary Processes and Mean Reversion Definition 3.1: A time series y t, t = 1,..., T is called (covariance) stationary if (1) E[y t ] = µ, for all t Cov[y t, y t
Forecasting Analytics. Group members: - Arpita - Kapil - Kaushik - Ridhima - Ushhan
 Forecasting Analytics Group members: - Arpita - Kapil - Kaushik - Ridhima - Ushhan Business Problem Forecast daily sales of dairy products (excluding milk) to make a good prediction of future demand, and
4. Simple regression. QBUS6840 Predictive Analytics. https://www.otexts.org/fpp/4
 4. Simple regression QBUS6840 Predictive Analytics https://www.otexts.org/fpp/4 Outline The simple linear model Least squares estimation Forecasting with regression Non-linear functional forms Regression
Univariate Time Series Analysis; ARIMA Models
 Econometrics 2 Spring 25 Univariate Time Series Analysis; ARIMA Models Heino Bohn Nielsen of4 Outline of the Lecture () Introduction to univariate time series analysis. (2) Stationarity. (3) Characterizing
4 Other useful features on the course web page. 5 Accessing SAS
 1 Using SAS outside of ITCs Statistical Methods and Computing, 22S:30/105 Instructor: Cowles Lab 1 Jan 31, 2014 You can access SAS from off campus by using the ITC Virtual Desktop Go to https://virtualdesktopuiowaedu
Do Electricity Prices Reflect Economic Fundamentals?: Evidence from the California ISO
 Do Electricity Prices Reflect Economic Fundamentals?: Evidence from the California ISO Kevin F. Forbes and Ernest M. Zampelli Department of Business and Economics The Center for the Study of Energy and
Chapter 7 Section 7.1: Inference for the Mean of a Population
 Chapter 7 Section 7.1: Inference for the Mean of a Population Now let s look at a similar situation Take an SRS of size n Normal Population : N(, ). Both and are unknown parameters. Unlike what we used