HAZUS th Annual Conference
|
|
|
- Luke Cobb
- 10 years ago
- Views:
Transcription
1 HAZUS th Annual Conference
2 HAZUS Comparison of Storm Surge Levels from Different Hurricanes to the Newest SLOSH Models for Berkeley, Charleston, & Dorchester Counties Along the SC Coastline. Charlie Kaufman, GISP Dorchester County Emergency Management Department, 212 Deming Way #3, Summerville, SC Dr. Norm Levine Geology and Environmental Geosciences, College of Charleston, 66 George Street, Charleston, SC 29424

3 Background In 2011 South Carolina completed a new Hurricane Evacuation Study (HES) of all the coastal counties in the state. The HES looked at multiple factors regarding hurricane evacuations including population, infrastructure networks, vulnerable areas, evacuation timing, and storm surge impacts. Charleston, Berkeley, and Dorchester counties are in what is called the central conglomerate of the SC coastline. These counties are also in the heart of what the locals call The Lowcountry. 2

4 The area is mostly at or near sea level. Tourism and port-related industry dominates much of the economy of the Lowcountry. In addition to the resident and tourist populations, tens of thousands of active duty and reserve military personnel from all branches are stationed within the area. Accurate HAZUS models of this area are essential to the state. 3

5 Background A main part of the HES is the new NOAA Sea, Lake and Overland Surges from Hurricanes (SLOSH) model. GIS mapping of storm surge inundation was completed by the Baltimore District US Army Corps of Engineers (USACE). Storm surge inundation maps produced for the HES are based on the high tide Maximum of Maximum (MOM) output for the SC coastline. 4
.")
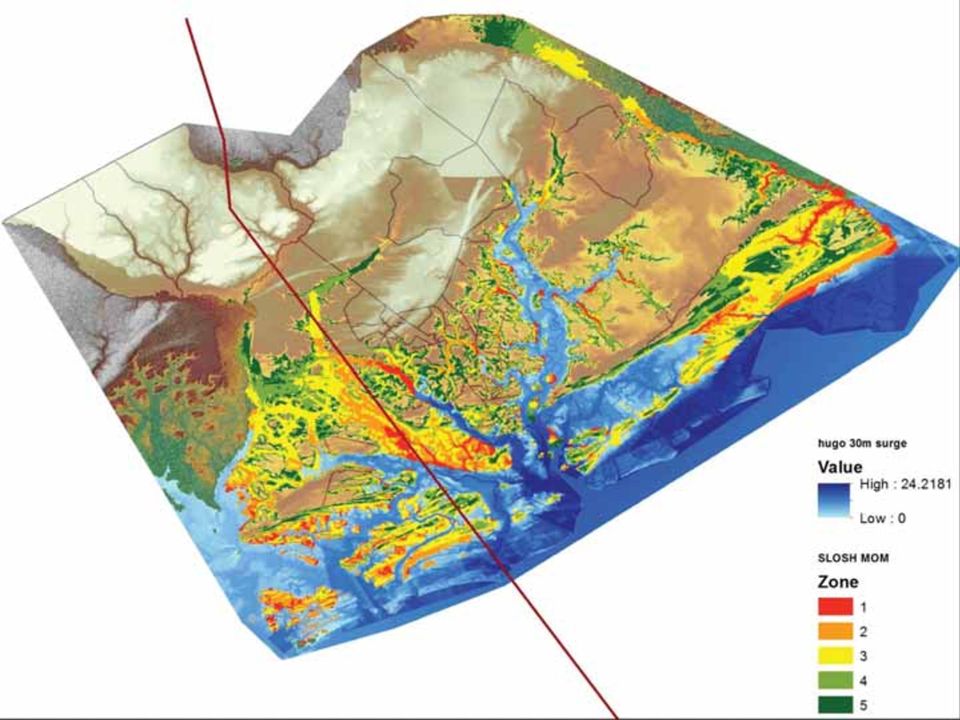
6 SLOSH - MOMs SLOSH MOM datasets do not show the impacts of a single storm, but a combination of 1,000s of different types of hurricanes at different speeds, strengths, tracks, and tide levels. These outputs create a worst case scenario of potential impacts and evacuation planning. The results of these models on the SC coastline have storm surge inundation reaching as far as miles inland. 5

7 Hurricane Hugo Storm Surge 6

8 SLOSH - MOM 7

9 Study Dorchester County Emergency Management together with the College of Charleston s Lowcountry Hazard Center performed a series of HAZUS hurricane storm surge models. The objective was to see if HAZUS storm surge model for a specific storm could mirror the inundation estimated by the SLOSH MOM. The two models were compared to determine the variability from product to product. 8

10 Study This study looks at three storms of varying strengths and landfall locations. Hurricane Hugo making landfall south of his original location. Hurricane Sandy had she made landfall in the Charleston region. The Governor s Table Top Storm (GTTS) nicknamed Dean that was used in the 2013 statewide hurricane exercise. 9
 nicknamed Dean that was used in the 2013")
11 Scenario The College of Charleston has been working on collecting high resolution DEMs of the SC coastline from several LiDAR sources and combining them into one master file. The DEM for the basins needed for the flood module was clipped from this file. The study region was set for the tract level, with the storm surge model set for no-waves with a 6 tidal range. The entire Charleston County coastline / Barrier Island system was selected for the shoreline reach. 10

12 Scenario Unfortunately, the size of the DEM at 2m spacing was just over 60G in size. HAZUS either crashed repeatedly while calculating the surge or produced faulty straight line outputs. Using the 2m DEM to try to inundate 3 counties, actually filled up the C:// drive of the College s GIS computers; causing Windows to shut down and the model to crash. Once the HAZUS study regions and data were pathed to alternate drives for the model to have enough space to run, we started to get the faulty outputs. 11

13 Scenario If the computer did not crash, the storm surge runs on the 2m dataset took about hours to complete. A decision was made to use the prepackaged 30m DEM available from the USGS through the HAZUS portal download Runs on this dataset only took 20mins to complete. 12

14 Test attempt at using the 2m DEM. Not the track used in the study. This example took over 40hrs to complete. Note the straight line errors in the flood 13 outputs.

15 Example of the 30m DEM. None of the straight line errors. This took 20min to complete. 14

16 Hurricane Hugo Hugo made landfall September 1989 just north of Charleston, SC. The impacts could have been worse as the strongest part of the storm impacted a rural area along with the Francis Marion National Forest. 15

17 Potential Hugo Impacts Had Hurricane Hugo come ashore near Folly Beach, SC; the combined wind and surge impacts to Charleston, Berkeley, and Dorchester counties would be: Maximum Peak Wind Speed Gust: 113 mph 21,289 buildings would be at least moderately damaged. 3,069 buildings completely destroyed. 2,039,805 tons of debris would be generated. Total economic loss of 4 billion dollars. 40,973 people would seek temporary shelter. 16

18 Original landfall location 17

19 18

20 19
21 Hurricane Sandy At one time Sandy had the potential to impact SC. The issues the northern states are continuing to deal with could have occurred in SC. The HURREVAC tool was used to provide storm data to HAZUS so the track could be manipulated into the Charleston area. 20
22 Potential Sandy Impacts Had Hurricane Sandy come ashore near Folly Beach, SC; the combined wind and surge impacts to Charleston, Berkeley, and Dorchester counties would be: Maximum Peak Wind Speed Gust: 87 mph 15,964 buildings would be at least moderately damaged. 1,063 buildings completely destroyed. 580,010 tons of debris would be generated. Total economic loss of 3 billion dollars. 52,936 people would seek temporary shelter. 21
23 Potential Sandy Impacts Had Hurricane Sandy come ashore near Folly Beach, SC; the combined wind and surge impacts to Charleston, Berkeley, and Charleston counties would be: Maximum Peak Wind Speed Gust: 87 mph 15, 964 buildings would be at least moderately damaged. 1,063 buildings would be competely destroyed. 580,010 tons of debris would be generated. Total economic loss of 3 billion dollars. 52,963 people would seek temporary shelter. 22
24 23
25 24
26 GTTS Hurricane Dean Hurricane Dean was created by the SC Emergency Management Department for the 2013 Governors' Tabletop Statewide Hurricane Exercise. The storm was created in HAZUS and the outputs were sent to each participating county to use during the exercise. SC Emergency Management graciously gave Dorchester County the.hpr file to use in this study. 25
27 Potential Dean Impacts Had Hurricane Dean come ashore near Kiawah Island, SC; the combined wind and surge impacts to Charleston, Berkeley, and Dorchester counties would be: Maximum Peak Wind Speed Gust: 165 mph 135,088 buildings would be at least moderately damaged. 26,586 buildings completely destroyed. 8,122,837 tons of debris would be generated. Total economic loss of 14 billion dollars. 165,887 people would seek temporary shelter. 26
28 27
29 28
30 29
31 Outputs Important to Note The damage / population figures are from the 2000 Census data and may actually be a lower estimate that one would expect today. Complete CDMS data is not yet available for all 3 counties in the study area. 30
32 About HAZUS Storm Surge We did discover one issue with HAZUS storm surge model for our area regarding the use of the SLOSH Basin grids. HAZUS uses the SLOSH Basin grid hchs for the Charleston Harbor area. The HES used the newer SLOSH Basin grid hch2 for the Charleston Harbor area. This grid covers more area than the older hchs grid. Looking at storm surge flooding with the hchs grid would give the artificial impression that some areas would escape inundation from a storm surge. 31
33 hchs basin 32
34 hch2 basin 33
35 34
36 35
37 SLOSH Basin Grids Issues Grid size: Grids are developed at finite sizes each grid is then used to provide a surge height for that cell. The surge map is developed by then intersecting the surge height with the elevations on the DEM The effective resolution of the Grids are: hch2 (km2) hchs (km2) Ratio ~1:70 Mil Ratio ~1:1.7 Bil This suggests that enhancing the DEM will only result in prettier maps not more accurate ones unless the grids can be enhanced as well. 36
38 37
39 Study Limitations HAZUS does have some limitations in using the coastal surge model. As previously mentioned, either HAZUS or the computer system s inability to handle larger size DEMs limits the accuracy of the storm surge model. With HAZUS using the older hchs grid for the SLOSH model, it complicates the comparisons between the new SLOSH MOMs. This issue was sent to the HAZUS help desk Resolution from the help desk: Agree with suggestion, SLOSH basins should be updated periodically. 38
40 HUGS The HAZUS User Groups have been a great resource on how to deal with the issues we are having with the 2m DEM. Several of the users suggested that our LiDAR might have been too good and was causing the road networks to act as artificial blockages to the water flow. Road networks were found not to be an error, the SLOSH basin grid differences seem to be the issue. HUG members have also suggested using a computer with a solid state drive to increase performance. 39
41 Next Steps Dorchester County and the College of Charleston will continue to look at enhancing this model so it can use the 2m DEM as the elevation base. We may still need an even more powerful computer to handle a DEM that is 60G in size. We look forward to the next HAZUS versions in hopes that the SLOSH basins will be updated. 40
42 Next Steps We will also be looking at incorporating our high resolution flood models into the surge to increase the accuracy water damage estimates to get a more complete picture of what would happen should a hurricane make landfall along the SC coastline. In the Lowcountry, flooding can end up accounting for more total damage than the wind. 41
43 Next Steps The data, outputs, and reports of the completed study will be shared with the local county Emergency Management Departments, the South Carolina Emergency Management Department, interested HAZUS User Groups, and interested Federal agencies (USCG, USACE). The information gathered in this study will hopefully provide statewide and local emergency managers / coastal planners better tools for making evacuation decisions and mitigation recommendations for future hurricane events in SC. 42
44 Thanks
45 Questions Charlie Kaufman, Dr. Norman Levine,
GIS Data Discovery Workshop
 Florida Division of Emergency Management 1 GIS Data Discovery Workshop Richard Butgereit GIS Administrator 850-413-9907 [email protected] floridadisaster.org/gis Critical Facilities Inventory
Storm tide is the water level rise during a storm due to the combination of storm surge and the astronomical tide.
 INTRODUCTION TO STORM SURGE Introduction to Storm Surge BOLIVAR PENINSULA IN TEXAS AFTER HURRICANE IKE (2008) What is Storm Surge? Inland Extent Storm surge can penetrate well inland from the coastline.
Storm tide is the water level rise during a storm due to the combination of storm surge and the astronomical tide.
 INTRODUCTION TO STORM SURGE Introduction to Storm Surge National Hurricane Center Storm Surge Unit BOLIVAR PENINSULA IN TEXAS AFTER HURRICANE IKE (2008) What is Storm Surge? Inland Extent Storm surge can
Most Vulnerable US Cities to Storm Surge Flooding. August 2015 2 COPLEY PLACE BOSTON, MA 02116 T: 617.423.2800 F: 617.423.2808
 Most Vulnerable US Cities to Storm Surge Flooding August 2015 2 COPLEY PLACE BOSTON, MA 02116 T: 617.423.2800 F: 617.423.2808 Introduction Hurricane Katrina was a stark reminder that strong winds are only
7) Coastal Storms: Multi-Hazard Analysis for New York City
 Coastal Storms: Multi-Hazard Analysis for New York City") 7) Coastal Storms: Multi-Hazard Analysis for New York City a) Hazard Profile i) Hazard Description Coastal storms, including nor'easters, tropical storms, and hurricanes, can and do affect New York City.
7) Coastal Storms: Multi-Hazard Analysis for New York City a) Hazard Profile i) Hazard Description Coastal storms, including nor'easters, tropical storms, and hurricanes, can and do affect New York City.
Wind vs. Water and Unique Monroe County Mitigating Factors for Wind Damage
 Wind vs. Water and Unique Monroe County Mitigating Factors for Wind Damage A Presentation to the Florida Commission on Hurricane Loss Projection Methodologies Prepared by the Grassroots Organization FIRM
Minnesota State Plan Review Level 2 Hazus-MH 2.1 County Model for Flooding Dakota County Evaluation
 Overview Minnesota State Plan Review Level 2 Hazus-MH 2.1 County Model for Flooding Dakota County Evaluation Minnesota Homeland Security and Emergency Management (HSEM) is responsible for supporting activities
Predicting Coastal Hazards: A Southern California Demonstration
 Predicting Coastal Hazards: A Southern California Demonstration Patrick Barnard United States Geological Survey Coastal and Marine Geology Team Santa Cruz, CA Southern California Multi-hazards Demonstration
Malcolm L. Spaulding Professor Emeritus, Ocean Engineering University of Rhode Island Narragansett, RI 02881
 Malcolm L. Spaulding Professor Emeritus, Ocean Engineering University of Rhode Island Narragansett, RI 02881 USACE Coastal and Hydraulics Laboratory(CHL) Data Infrastructure Workshop January 23, 2014 Overview
With a combination of soaking rain, flying debris, high winds, and tidal surges, Hurricanes and tropical storms can pack a powerful punch.
 With a combination of soaking rain, flying debris, high winds, and tidal surges, Hurricanes and tropical storms can pack a powerful punch. Besides causing extensive damage in coastal areas, hurricanes
An Initial Assessment of the Impacts of Sea Level Rise to the California Coast
 An Initial Assessment of the Impacts of Sea Level Rise to the California Coast Photo by D. Revell 2/23/08 California Coastal Records Project Dr. David Revell and Matt Heberger, P.E. Dr. Peter Gleick, Bob
New Coastal Study for Puerto Rico FIRMs. Paul Weberg, FEMA RII Mat Mampara, Dewberry Jeff Gangai, Dewberry Krista Collier, Baker
 New Coastal Study for Puerto Rico FIRMs Paul Weberg, FEMA RII Mat Mampara, Dewberry Jeff Gangai, Dewberry Krista Collier, Baker September 2007 Project Team FEMA Region II Program Manager Collaboration
Hurricanes and Storm Surge www.hcfcd.org/tropicalweather
 Hurricanes and Storm Surge www.hcfcd.org High-level winds fl ow outward Strong surface winds spiral inward EYE Calm, sometimes cloudfree, sinking air Air sinks in calm area at the storm s eye THUNDERSTORMS
MARCH 31, 2010 - WEDNESDAY
 MARCH 31, 2010 - WEDNESDAY GENERAL SESSIONS Buffalo Plane Crash This session will focus on the emergency manager s overview of the Buffalo New York plane crash of Continental 3407. Overview of November
Mariana Leckner, Ph.D., Professor, American Military University Thomas O. Herrington, Ph.D. Associate Professor, Stevens Institute of Technology
 Mariana Leckner, Ph.D., Professor, American Military University Thomas O. Herrington, Ph.D. Associate Professor, Stevens Institute of Technology National Hydrologic Warning Council Training Conference
Impacts of Global Warming on North Carolina s Coastal Economy
 Impacts of Global Warming on North Carolina s Coastal Economy IMPACTS OF GLOBAL WARMING ON NORTH CAROLINA S COASTAL ECONOMY Key Findings Global warming is projected to have significant impacts on North
Where is Risk MAP Now? Update on the Flood Risk Assessment Dataset. Shane Parson RAMPP
 Where is Risk MAP Now? Update on the Flood Risk Assessment Dataset Shane Parson RAMPP Agenda Overview Average Annualized Loss (AAL Study) Risk MAP Flood Risk Assessment Dataset Process AAL Data Refined
Flood Emergency Response Planning: How to Protect Your Business from a Natural Disaster RIC005
 Flood Emergency Response Planning: How to Protect Your Business from a Natural Disaster RIC005 Speakers: Tom Chan, CEO, Global Risk Miyamoto Greg Bates, Principal, Global Risk Consultants Learning Objectives
Impacts of Global Warming on Hurricane-related Flooding in Corpus Christi,Texas
 Impacts of Global Warming on Hurricane-related Flooding in Corpus Christi,Texas Sea-level Rise and Flood Elevation A one-foot rise in flood elevation due to both sea-level rise and hurricane intensification
EPA s Climate Resilience Evaluation and Awareness Tool (CREAT): A Case Study
: A Case Study") EPA s Climate Resilience Evaluation and Awareness Tool (CREAT): A Case Study South Monmouth Regional Sewerage Authority (SMRSA) Serves 9 Townships 9.1 MGD Wastewater Treatment Plant 11 pump stations 11.
EPA s Climate Resilience Evaluation and Awareness Tool (CREAT): A Case Study South Monmouth Regional Sewerage Authority (SMRSA) Serves 9 Townships 9.1 MGD Wastewater Treatment Plant 11 pump stations 11.
Flood Risk Management
 Flood Risk Management Value of Flood Risk Management Every year floods sweep through communities across the United States taking lives, destroying property, shutting down businesses, harming the environment
Flood Risk Management
 Flood Risk Management Value of Flood Risk Management Value to Individuals and Communities Every year floods sweep through communities across the United States taking lives, destroying property, shutting
Using LIDAR to monitor beach changes: Goochs Beach, Kennebunk, Maine
 Geologic Site of the Month February, 2010 Using LIDAR to monitor beach changes: Goochs Beach, Kennebunk, Maine 43 o 20 51.31 N, 70 o 28 54.18 W Text by Peter Slovinsky, Department of Agriculture, Conservation
THE UNIVERSITY OF TEXAS MEDICAL BRANCH (UTMB) AT GALVESTON
 AT GALVESTON") THE UNIVERSITY OF TEXAS MEDICAL BRANCH (UTMB) AT GALVESTON Energy Security on a Barrier Island Presented to CHP 2012 October 16, 2012 Agenda About UTMB Galveston Hurricane Ike Where We Were September 12,
THE UNIVERSITY OF TEXAS MEDICAL BRANCH (UTMB) AT GALVESTON Energy Security on a Barrier Island Presented to CHP 2012 October 16, 2012 Agenda About UTMB Galveston Hurricane Ike Where We Were September 12,
Norfolk Flooding Strategy Update. Presentation to Norfolk City Council March 27, 2012
 Norfolk Flooding Strategy Update Presentation to Norfolk City Council March 27, 2012 Presentation Overview The purpose of this presentation is to provide City Council an update on activities carried out
How To Calculate Hurricane Ike Damage In Galveston County
 NEEDS ASSESSMENT Galveston County Housing Assistance Program HURRICANE IKE ROUND 2 Prepared for Galveston County Prepared by Shaw Environmental & Infrastructure, Inc. November 27, 2012 SHAW ENVIRONMENTAL
Tsunami Inundation Maps
 1946 1964 Today Tomorrow Tsunami Inundation Maps For Emergency Response Planning Available at www.tsunami.ca.gov Multi-year project covers all low-lying populated coastal areas 20 counties and over 75
Tropical Program Update
 Tropical Program Update Mark Tew Chief, Marine and Coastal Weather Services Branch Office of Climate, Water, and Weather Services [email protected] 301-713-1677 x 125 Changes to the Tropical Warning Program
HURRICANE SANDY One Year Later A LOOK BACK AT ATLANTIC CITY ELECTRIC S STORM RESTORATION EFFORTS
 HURRICANE SANDY One Year Later A LOOK BACK AT ATLANTIC CITY ELECTRIC S STORM RESTORATION EFFORTS OCTOBER 2013 SANDY STRIKES Hurricane Sandy made landfall bringing maximum sustained winds of 80 mph and
Post-Sandy Municipal Needs Assessment for Long-Term Recovery and Resiliency Planning EXECUTIVE SUMMARY
 Post-Sandy Municipal Needs Assessment for Long-Term Recovery and Resiliency Planning EXECUTIVE SUMMARY Prepared by Nathaly Agosto Filión, Resiliency Manager for the New Jersey Resiliency Network, a program
U.S. Army Corps of Engineers
 Walla Walla District U.S. Army Corps of Engineers Hurricane Katrina Response Briefer: Joseph Saxon Today s Briefing U.S. Army Corps of Engineers Mission Events leading up to New Orleans flooding Corp s
Coastal Engineering Indices to Inform Regional Management
 Coastal Engineering Indices to Inform Regional Management Lauren Dunkin FSBPA 14 February 2013 Outline Program overview Standard products Coastal Engineering Index Conclusion and future work US Army Corps
POST-DISASTER REDEVELOPMENT PLANNING
 TABLE OF CONTENTS POST-DISASTER REDEVELOPMENT PLANNING Addressing Adaptation During Long-term Recovery Florida Department of Economic Opportunity Florida Division of Emergency Management page ii This report
FLOOD PROTECTION AND ECOSYSTEM SERVICES IN THE CHEHALIS RIVER BASIN. May 2010. Prepared by. for the. 2010 by Earth Economics
 FLOOD PROTECTION AND ECOSYSTEM SERVICES IN THE CHEHALIS RIVER BASIN May 2010 Prepared by for the Execubve Summary The Chehalis Basin experienced catastrophic flooding in 2007 and 2009. In response, the
StormSurgeViz: A Visualization and Analysis Application for Distributed ADCIRC-based Coastal Storm Surge, Inundation, and Wave Modeling
 : A Visualization and Analysis Application for Distributed ADCIRC-based Coastal Storm Surge, Inundation, and Wave Modeling Brian Blanton Renaissance Computing Institute University of North Carolina at
South Carolina Department of Insurance
 South Carolina Department of Insurance Historically South Carolina has experienced destructive hurricanes to include the Sea Island Hurricane of 1893, Hurricane Hazel in 1954 and more recently, Hurricane
FLOOD INFORMATION SERVICE EXPLANATORY NOTES
 FLOOD INFORMATION SERVICE EXPLANATORY NOTES Part 1 About the flood maps Limitations of the mapping What the maps don t show Where to find more information Definitions of words used to describe flooding.
Develop hazard mitigation policies and programs designed to reduce the impact of natural and human-caused hazards on people and property.
 6.0 Mitigation Strategy Introduction A mitigation strategy provides participating counties and municipalities in the H-GAC planning area with the basis for action. Based on the findings of the Risk Assessment
Standard Operating Procedures for Flood Preparation and Response
 Standard Operating Procedures for Flood Preparation and Response General Discussion Hurricanes, tropical storms and intense thunderstorms support a conclusion that more severe flooding conditions than
Increasing Hurricane Awareness and Improving Hurricane Preparedness in Sea Bright, New Jersey
 Increasing Hurricane Awareness and Improving Hurricane Preparedness in Sea Bright, New Jersey Submitted by: Greg Machos Webmaster/Owner www.hurricaneville.com Submitted to: Joe Picciano Acting Director
CRS 610 Ventura County Flood Warning System Website
 CRS 610 Ventura County Flood Warning System Website Purpose This document gives instructions and a description of the information available via the Ventura County Watershed Protection District s (VCWPD)
ART Vulnerability and Risk Assessment Report September 2012 Appendix C. ART GIS Exposure Analysis
 Adapting to Rising Tides GIS Exposure Analysis The aim of this appendix is to familiarize the reader with the data and methodology that was used to conduct an analysis of shoreline and community asset
Honolulu Essential Facilities Risk Assessment (HEFRA) Project Report January 29, 2010
 Project Report January 29, 2010") Honolulu Essential Facilities Risk Assessment (HEFRA) Project Report January 29, 2010 Prepared For Department of Homeland Security Federal Emergency Management Agency EMR-2003-CO-0046 / Task Orders 016
Honolulu Essential Facilities Risk Assessment (HEFRA) Project Report January 29, 2010 Prepared For Department of Homeland Security Federal Emergency Management Agency EMR-2003-CO-0046 / Task Orders 016
A Coastal Barrier Protecting the Houston/Galveston Region from Hurricane Storm Surge
 A Coastal Barrier Protecting the Houston/Galveston Region from Hurricane Storm Surge 1/20/2011 The Houston/Galveston Region Is home to about 2 Million people and may double by 2050 Galveston Bay provides
GTM North Carolina Floodplain Mapping Program. RFQ 286-000023 Pre-Submittal Conference
 GTM North Carolina Floodplain Mapping Program RFQ 286-000023 Pre-Submittal Conference State Response / Strategies Strategy 1 - Establishment of a statewide program to acquire, process and disseminate current,
This paper provides a concise description of
 13 UNIVERSITIES COUNCIL ON WATER RESOURCES ISSUE 130, PAGES 13-19, MARCH 2005 Overview of Flood Damages Prevented by U.S. Army Corps of Engineers Flood Control Reduction Programs and Activities James J.
Federal Emergency Management Agency (FEMA) Preliminary Flood Insurance Rate Maps (FIRMs) and Preliminary Flood Insurance Study (FIS) for New York City
 Preliminary Flood Insurance Rate Maps (FIRMs) and Preliminary Flood Insurance Study (FIS) for New York City") March 10, 2014 Submitted electronically via http://www.nyc.gov Mayor s Office of Long Term Planning and Sustainability c/o Flood Map Comments 253 Broadway, 10th Floor New York, NY 10007 Federal Emergency
March 10, 2014 Submitted electronically via http://www.nyc.gov Mayor s Office of Long Term Planning and Sustainability c/o Flood Map Comments 253 Broadway, 10th Floor New York, NY 10007 Federal Emergency
FLOOD HAZARD IN THE URBAN ENVIRONMENT: IMPLICATIONS FOR DEVELOPERS, DESIGNERS, AND ATTORNEYS
 FLOOD HAZARD IN THE URBAN ENVIRONMENT: IMPLICATIONS FOR DEVELOPERS, DESIGNERS, AND ATTORNEYS PRESENTED BY: CHAD W. COX, P.E. DANIEL C. STAPLETON, P.E. BOSTON, MA JAN. 24, 2014 PRESENTATION Flood Vulnerability
HURRICANE WORKFORCE ANALYSIS HURRICANES ANDREW AND OPAL
 HURRICANE WORKFORCE ANALYSIS HURRICANES ANDREW AND OPAL Florida Agency for Workforce Innovation Labor Market Statistics September 2004 Hurricane Workforce Analysis Hurricanes Andrew & Opal Introduction
Damage Potential of Tropical Cyclone
 Damage Potential of Tropical Cyclone Regional Specialised Meteorological Centre (RSMC)- Tropical Cyclone, New Delhi Cyclone Warning Division India Meteorological Department Mausam Bhavan, Lodi Road, New
Customer and Data Services (CDS) Hazus Release 3.0. User Release Notes
 Hazus Release 3.0. User Release Notes") Customer and Data Services (CDS) Hazus Release 3.0 User Release Notes Version 0.4 November 13, 2015 Document Management History Revision History Version Number Date Summary of Changes Team/Author 0.1 10/05/15
Customer and Data Services (CDS) Hazus Release 3.0 User Release Notes Version 0.4 November 13, 2015 Document Management History Revision History Version Number Date Summary of Changes Team/Author 0.1 10/05/15
Tropical Storm Allison 2001
 Texas State Senate Subcommittee on Flooding and Evacuations Testimony of Robert Eckels 18 October 2010 The challenges of Hurricanes and Flooding can best be illustrated in the Tale of Two Storms. Tropical
DRAFT HAZARD MITIGATION PLAN TOOLKIT: MASTER TABLE
 DRAFT HAZARD MITIGATION PAN TOOKIT: MASTER TABE Steps Requirements Addressed Click to Overview slide presentation on "Getting Started Developing a Hazard Mitigation Plan" Plan Development Overview Introductory
Environmental Data Services for Delaware:
 Environmental Data Services for Delaware: Serving Emergency Responders, Planners, and Researchers Network Delaware Day November 6, 2013 Overview Operational Data Services More than just research DEOS and
we fail to take action against climate change, North Carolina has much to lose. Pay Later: The Cost of Inaction
 FACTS NORTH CAROLINA A M E R I C A N S E C U R I T Y P R O J E C T Pay Now, Pay Later: North Carolina The iconic Outer Banks are visited by thousands of tourists each year, but beginning in 2030, spending
ROLE OF THE MODELING, MAPPING, AND CONSEQUENCES PRODUCTION CENTER
 ROLE OF THE MODELING, MAPPING, AND CONSEQUENCES PRODUCTION CENTER Russ Wyckoff, P.E., CFM, MMC Modeling Lead, Tulsa District, USACE, Tulsa, Oklahoma, [email protected] ABSTRACT: The goal of
In the Caribbean, August and September are peak months during the hurricane season that lasts from June 1 through November 30.
 Hurricane Fact sheet What is a hurricane? A hurricane is a tropical storm with winds that have reached a constant speed of 74 miles per hour more. Hurricane winds blow in a large spiral around a relative
Loss-Consistent Categorization of Hurricane Wind and Storm Surge Damage for Residential Structures
 Loss-Consistent Categorization of Hurricane Wind and Storm Surge for Residential Structures Carol J. Friedland, P.E., Ph.D. 1, Marc L. Levitan, Ph.D. 2 1 Assistant Professor, Department of Construction
asbpa Preserving our coastal economy and ecology since 1926
 Preserving our coastal economy asbpa and ecology since 1926 HEALTHY BEACHES ARE VITAL TO OUR WAY OF LIFE People in the United States highly prize the thousands of miles of sandy beaches along our nation
Climate Change in Coastal Florida: Economic Impacts of Sea Level Rise
 Climate Change in Coastal Florida: Economic Impacts of Sea Level Rise CLIMTE CHNGE IN COSTL FLORID: ECONOMIC IMPCTS OF SE LEVEL RISE Context Global warming is expected to cause: Sea level rise Increased
Analysis of the Interstate 10 Twin Bridge s Collapse During Hurricane Katrina
 Analysis of the Interstate 0 Twin Bridge s Collapse During Hurricane Katrina By Genda Chen, Emitt C. Witt III, David Hoffman, Ronaldo Luna, and Adam Sevi The Interstate 0 Twin Span Bridge over Lake Pontchartrain
Guidance for Flood Risk Analysis and Mapping. Changes Since Last FIRM
 Guidance for Flood Risk Analysis and Mapping Changes Since Last FIRM May 2014 This guidance document supports effective and efficient implementation of flood risk analysis and mapping standards codified
The Caribbean Disaster Mitigation Project: Supporting Sustainable Responses to Natural Hazards
 The Caribbean Disaster Mitigation Project: Supporting Sustainable Responses to Natural Hazards Steven Stichter Caribbean Disaster Mitigation Project (CDMP) Unit of Sustainable Development and Environment
Flood Damage Mitigation And Insurance Costs
 Flood Damage Mitigation And Insurance Costs Friday, September 25, 2015 at 7:00 PM Saturday, September 26, 2015 at 10:00 AM This presentation was prepared by the Town of South Bethany using Federal Funds
REGIONAL SEDIMENT MANAGEMENT: A GIS APPROACH TO SPATIAL DATA ANALYSIS. Lynn Copeland Hardegree, Jennifer M. Wozencraft 1, Rose Dopsovic 2 INTRODUCTION
 REGIONAL SEDIMENT MANAGEMENT: A GIS APPROACH TO SPATIAL DATA ANALYSIS Lynn Copeland Hardegree, Jennifer M. Wozencraft 1, Rose Dopsovic 2 ABSTRACT: Regional sediment management (RSM) requires the capability
Future of our coasts: Potential for natural and hybrid infrastructure to enhance ecosystem and community resilience Ariana Sutton-Grier
 Future of our coasts: Potential for natural and hybrid infrastructure to enhance ecosystem and community resilience Ariana Sutton-Grier University of Maryland & National Oceanic and Atmospheric Administration
AsonMaps: A Platform for Aggregation Visualization and Analysis of Disaster Related Human Sensor Network Observations
 AsonMaps: A Platform for Aggregation Visualization and Analysis of Disaster Related Human Sensor Network Observations Oleg Aulov [email protected] Adam Price [email protected] Milton Halem [email protected]
Critical Assets and Extreme Weather Process & Lessons
 Critical Assets and Extreme Weather Process & Lessons Steven Olmsted Intermodal Transportation Division Arizona Department of Transportation 2014 Transportation Asset Management Conference April 28-30,
The following was presented at DMT 14 (June 1-4, 2014, Newark, DE).
.") DMT 2014 The following was presented at DMT 14 (June 1-4, 2014, Newark, DE). The contents are provisional and will be superseded by a paper in the DMT 14 Proceedings. See also presentations and Proceedings
DMT 2014 The following was presented at DMT 14 (June 1-4, 2014, Newark, DE). The contents are provisional and will be superseded by a paper in the DMT 14 Proceedings. See also presentations and Proceedings