EARTH PEOPLE TECHNOLOGY SERIAL GRAPH TOOL FOR THE ARDUINO UNO USER MANUAL
|
|
|
- Valentine Eaton
- 9 years ago
- Views:
Transcription

1 EARTH PEOPLE TECHNOLOGY SERIAL GRAPH TOOL FOR THE ARDUINO UNO USER MANUAL The Serial Graph Tool for the Arduino Uno provides a simple interface for graphing data to the PC from the Uno. It can graph up to 8 separate channels. Each channel is limited to eight bits only. It has several tools that allow the data to be scaled for examination. Scaling can be performed in the Vertical and Horizontal. Each channel can be turned on or off for display. The Serial Graph Tool has easy to use Arduino functions to transmit data to be graphed from the Uno. It uses the SPI bus so data is transferred at up to 4 Megabits per second. 1

2 Serial Graph Tool Getting Started Below is a list of the steps to take to get started using the Serial Graph Tool. 1. Install the Serial Graph Tool Driver 2. Install the Serial Graph Tool Application 3. Connect the EPT 220X-DB-U2 board to the Arduino Uno 4. Connect each board separately to two USB Ports on the PC 5. Locate the Arduino Examples folder under the Serial Graph Tool Install 6. Locate the Arduino_SGTool_Analog_Monitor_U2 folder, double click on the *.ino file 7. When the Arduino IDE comes up, Go to Tools->Board and select Arduino Uno 8. Go to Tools->Serial Port and select the correct port for the Uno. 9. Click on the Upload button of the Arduino IDE. 10. Click on the Serial Graph Tool Icon under All Programs 11. When the application opens up, click on the drop down box in the upper right corner. 12. Select the Serial Graph Tool Click on the Open button then click on the Start button. 14. All six analog channels should appear on the display. Serial Graph Tool Driver Connect the EPT 220X-DB-U2 board to a USB port on the PC. Load the driver located on the CD at /SPI_SERIAL_GRAPH_TOOL_PROJECT_CD/Drivers/EPT_ The EPT 220X-DB-U2 uses the ftdibus.sys driver. This driver is loaded upon connection of the USB to Serial Cable to the PC by the ftdibus.inf file. To install these two files onto your PC, follow the instructions from the Update Driver Software utility. This utility will automatically 2

3 load when the board is connected to the PC. Click on the Browse my computer for driver Software icon. Next, click the Browse button and browse over to the cd and locate the above folder. 3

4 The next window is the Windows Security notice. The EPT driver is not signed by Windows. Click on the Install this driver software anyway. 4

5 Windows will add the EPT_ driver to the System Registry. When this is complete, the drivers are installed and the EPT 220X-DB-U2 is ready for use. Serial Graph Tool Application Install The Serial Graph Tool application software must be installed onto the users PC before using. 5


6 This is an easy process as the application and all the supporting files such as Data Sheets, Arduino Examples and the application itself has been packed into Windows Installer files. This comes in the form of two files: Just double click on the setup icon to launch the installer. Click through all of the install screens by clicking Next. 6

7 When the installation is complete, the application is ready for use. The installer adds a folder under the users Programs (x86) folder. Go to Start->Serial Graph Tool to view the files and folders. Just click on the Serial Graph Tool icon to launch the application. The Arduino Examples folder contains example code for you to use to setup a working graph application on the Arduino. The Documentation folder contains the Data Sheet and User Manual for the Serial Graph Tool. Serial Graph Tool Connections The Serial Graph Tool uses the EPT 220X-DB-U2 board to connect the Arduino Uno to the software application running on the PC. The board is designed with stackable headers that connect into the Uno headers. When the two boards are connected, the SPI bus from the Arduino is connected to the USB port of the PC via the FT220X daughter board. Connect the EPT 220X-DB-U2 to the Arduino Uno. Connect the board to an open USB port on the PC. The Serial Graph Tool is designed to mate with the Arduino Uno. The four board connectors connect directly into the Arduino Uno. Once the two boards are connected, the SPI signals from the Uno are directed into the UMFT220XA module. Both the Uno and the Serial Graph Tool can be powered up at the same time. The EPT 220X-DB-U2 board receives its power from the USB cable. To use the board, connect a USB 7

8 Mini B cable into the board connector and an open USB port on the PC. When the board is connected the USB driver (described in the previous section) automatically loads. Connect the Uno to the PC using a USB Cable. Connect the Uno to the PC using a USB Cable. Next, add some code to the Arduino and use the Serial Graph Tool functions to plot out user data. Serial Graph Tool Data Flow The Serial Graph Tool is designed to graph any data. This data can be 8, 10, 12, or 16 bits. It can have up to eight individual channels displayed at any one time. This data can be the result of the AnalogRead() function, or Temperature from and I2C sensor, or it can be created from a mathematic equation. Once the data has been graphed to the display, it can be scaled in the horizontal or vertical directions. You can zoom in or out in the horizontal or move forwards or backwards in the data buffer. In the vertical direction, you can scale the data with an integer or fractional multiplier. You can also set the vertical position of each channel. The figure below shows the Data Flow for graphing data from the Arduino. The user will collect data, then format the data, transmit over SPI to the EPT 220X-DB-U2, then transmit over USB to the PC, and finally the Serial Graph Tool displays the data. 8
 function, or Temperature from and I2C sensor, or it can be created from a mathematic equation.")
9 The EPT Serial Graph Tool makes it easy to graph fast or slow data coming from the Arduino Uno. The user only has to write code for the Uno. Just collect the data into an array then send the array and channel number to the EPT 220X-DB-U2, then send the end of frame command. There are only two functions needed to display data on the Serial Graph Tool. 1. EPT_SGToolWriteBlockData(DataArray, NumberOfBytes, ChannelNumber, NumberOfDataBits) 2. EPT_SGToolFrameEnd() These functions are explained in the next section. When the EPT_SGToolWriteBlockData() function is called, it takes the block that was previously stored into DataArray and transmits the bytes over the SPI bus to the EPT 220X-DB-U2. This data will be automatically sent from the EPT 220X-DB-U2 to the PC. Upon arrival at the PC, the Serial Graph Tool will store the data into a circular buffer. The circular buffer will continue to store new data as it arrives from the EPT 220X-DB-U2. When the EPT_SGToolFrameEnd() function is called on the Arduino, it sends a command to the Serial Graph Tool to graph the data in the circular buffer. You can keep sending data to the Serial Graph Tool, indefinitely. Because it uses a circular buffer, it will continue to fill this buffer. When it reaches the maximum size of the buffer, it circles back around to the beginning of the buffer and fills the buffer at that point. So, it will overwrite the previously written data. Anytime you want to update the display with new data, 9
 These functions are explained in the next section.")
10 just call the EPT_SGToolFrameEnd(). Serial Graph Tool Arduino Library 1. Write Block Function EPT_SGToolWriteBlockData((int *)DataArray, (int) NumberOfWords, (int)channelnumber, (int)numberofdatabits) This function is used to send a block of data to the Serial Graph Tool software which resides on the PC. The function does not return anything and takes four items as input parameters. a. DataArray this is an integer array that can take up to 16 bit data. The array should be declared as an integer array with no more than 500 entries. The Uno has only 2KB of SRAM so the buffer should stay under that size. The array can be as small as one byte or it can be the entire 500 integers. You must pass the DataArray to the function EPT_SGToolWriteBlockData() as an integer pointer. This is simple to do, just add the (int *) in front of the name of your array. b. NumberOfWords this is the number of items in the DataArray that you want to transfer to the Serial Graph Tool. Make sure that the total number of items in this value is available in the DataArray. If a null character is read from the buffer, it will not be transferred. c. ChannelNumber this is the channel that you want to write the DataArray into in the Serial Graph Tool. The tool has separate data buffers for each channel. Channels are assigned 0 to 7 for a total of eight channels. When the Arduino writes data to a new channel, it is declared and becomes available for display. If no command is sent to write data to a particular channel, then that channel will not be available for display. d. NumberOfDataBits this value is used to determine the bit size of each data element, 8, 10, 12, or 16. This value needs to be filled in correctly, otherwise the data will be incorrectly organized in the buffers in Serial Graph Tool. The correct values to use are: 10

11 i. EIGHT_BIT_DATA ii. TEN_BIT_DATA iii. TWELVE_BIT_DATA iv. SIXTEEN_BIT_DATA 2. Frame End Function EPT_SGToolFrameEnd() This function should be called anytime you want to graph the data that was written into the channel buffers in Serial Graph Tool. This function has no return and requires no parameters. It can be called at anytime. Serial Graph Tool Functionality 3. DataArray description The DataArray is the place in the Arduino memory where the data to be sent to the Serial Graph Tool is stored. This is declared as an integer array with a maximum size of 500 integers. 11


12 Each integer stored into this array will become a pixel in the display. The value of each integer will become its amplitude. The position of each integer in the DataArray is the point in time in which the data sample was collected. Each integer added to the DataArray can be either eight bit, ten bit, twelve bit or sixteen bit. However each integer added must be the same as all the other integers in the array. Mixing different bit sizes in the array is not allowed. So, the fact that we are changing the bit size of the data going into the array means we are not actually adding integers in the ANSI C sense of the meaning. Integers in the Arduino are 16 bits. However, we can store an eight bit (or ten, twelve) to the elements of the array with no problems. The EPT_SGTool Library just needs to know what the bit size of data we store into this array. And that is why we pass the NumberOfDataBits parameter to the EPT_SGToolWriteBlockData() function. 4. Channel selection The Serial Graph Tool can display up to eight individual channels of data. When the user sends a block of data to the EPT 220X-DB0-U2, they send it to a channel. And the data that is collected at the PC will be displayed in that channel only. So, the user must select a channel and enter in the ChannelNumber in the parameters for the EPT_SGToolWriteBlockData() function. The 12

 function you will have to enter the correct ChannelNumber for that data.")
13 data that is continuously collected for the channel in the Arduino code must keep the same channel number for the duration of the application. If you collect data for more than one channel, each time you call EPT_SGToolWriteBlockData() function you will have to enter the correct ChannelNumber for that data. It is up to the user to ensure the correct channel is passed to the EPT_SGToolWriteBlockData() function. Failure to do so will cause the display to show incorrect information. 5. Pixel bit selection When the data in a channel is graphed in the Serial Graph Tool, each integer in the buffer becomes a pixel on the display. The integers start at zero in the buffer and increment up to 450 while each pixel is placed on the graph from left to right. The value of all elements in the DataArray can be either 8, 10, 12, or 16 bits. The user will determine which bit selection to use based on the data. 6. Length of display pixels There are 450 pixels from left to right on the display. Each division has 50 pixels in it. Each 13

14 pixel is a data point that is derived from the data elements in the circular buffers. 14

15 When the Serial Graph Tool receives a FrameEnd command it reads the previous 450 data elements starting from the most recent data element from the selected channel in the circular buffer. It graphs each data element in one pixel. The value of the data element determines the amplitude of the signal. 7. Circular buffer description The Serial Graph Tool stores the incoming channel data into separate buffers. There is one buffer for each channel. All of these channel buffers are organized as Circular Buffers. The concept of using a Circular Buffer is pretty straight forward: Continuously store incoming data into the same buffer. When reaching the end of the circular buffer, start overwriting data at index 0. It starts filling at index zero and increments the index whenever new data arrives. When the index reaches the maximum point, it starts filling the buffer at zero. 15

16 This approach allows you to save data forever without having to use the hard drive of the PC. If we imagine the array arranged in a circular way it is easy to see from the diagram. Just keep saving data and start over when the buffer rolls over. So we end up with a buffer filled with the channel data. When a FrameEnd command comes in from the EPT-220X-DB-U2, the Serial Graph Tool reads the 450 buffer elements from the selected channel and graphs them in the appropriate channel color. It will then store the index value that it read up to into a local register. The next time the FrameEnd command is received by Serial Graph Tool, it reads 450 buffer elements starting at the end point of the previous read graph. This way, data will be graphed in an orderly manner in which it was received by Serial Graph Tool. This process can repeat forever, the incoming data will never overflow the local memory or slow down the computer by using the hard drive. 8. When to update the display The display can be updated at any time. Just call the EPT_SGToolFrameEnd() function and the Frame End command is sent to the Serial Graph Tool. When the Serial Graph Tool receives this command, it reads the previous 450 data elements from the first channel and graphs them in the display in the appropriate channel color. It continues to do this with all of the active channels and they have all been displayed. Knowing the right time to send the Frame End command depends on what type of data the user 16

17 is collecting and how often it is added to the DataArray. Because the data is stored into an array at the Arduino, the concept of time or any other measurement must be maintained by the user. The Serial Graph Tool does not know the exact timing of the elements in the data. For example, let s graph four channels of data. In the loop() function of the Arduino, one data element from each channel is stored into a separate buffer. Each channel data must be collected, possibly from the analoagread() function. Next, the data is processed by determining if it is greater than a threshold. Next, if it is greater than the threshold, store it. Repeat this process for each channel. When the end of the loop() function is reached, start the process over until the buffers reach the maximum index value. When the buffers are full, send each buffer to the EPT- 220X-DB-U2 using the function, EPT_SGToolWriteBlockData(). Then repeat this process until there are 450 data elements transmitted to each channel. At this point, there is enough data to fill up the entire display with graphs for all four channels. So, call the EPT_SGToolFrameEnd() function. Next, the display is updated with the collected data from the Arduino. Examining each of these processes, we can see that each process adds its own finite amount of time to execute these commands. So, the timing information cannot exist in the Serial Graph Tool. The user will have to note the amount of processing time for each of these tasks to know exactly when they occurred. 17

18 There are several types of data that benefit from graphing. Real time data Streaming the outputs of the analogread() functions 18
")
19 Long Duration data Measuring temperature once every second Mathematical data Result of an equation Each of these types of data will be graphed using a different strategy of when the frame end should occur. For real time data, the circular buffers in Serial Graph Tool are constantly written to as fast as possible. Every time the buffer index reaches 450, the frame end should be called. For long duration data, the frame end should be called after each data element is added to the buffer. For mathematical data, the frame end only needs to be called after the equation is complete and you want to graph the results. There are menu items on the Serial Graph Tool that allow you to view the contents of the buffer using different methods. i. Zoom in the buffer ii. Zoom out of the buffer iii. Shift left in the buffer iv. Shift right in the buffer These four menu items will change the method of reading 450 buffer elements starting at the previous end point, and graphing these elements in the selected channel. The Zoom in feature will read each element from the channel buffer and add a selected amount of dead time between each element. It then graphs this data in the selected channel. The effect of this dead time between each graph point is zooming into to the data. The amount of dead time between each data point is selectable by the Horizontal Scale slider. The Zoom out feature will decimate the data and graph the selected channel. This means that the data is read from the channel buffer at intervals of n+1. So, data is skipped. When the data is graphed, the effect is that we are zooming out of the data. The amount of skipped data between each data point is selectable by the Horizontal Scale slider. The Shift Left and Shift Right feature will add some user selectable amount to the previous end point of the graphed data. Serial Graph Tool then reads 450 elements from the buffer and plots them. The effect is that the data is shifting right or left on the screen. The amount of shifted data t is selectable by the Horizontal Scale slider. 9. SPI Timing diagram 19

20 The Arduino code transmits the channel data to the EPT-220X-DB-U2 over the SPI bus. This serial data has a protocol that it adheres to, to correctly send the formatted data to be graphed by Serial Graph Tool. The protocol is a command-data model. The Master sends a command to the Slave. Then it sends some data. The only command that is not followed by data is the Frame End command. Command Data Description Data Length Data Format Channel Data to be graphed No Restriction 8 Bit (Each data packet is 8 Bits, However each data element to be graphed can be up to 16 Bits) Frame End No Data 0 NA The Arduino will send the Channel Command with the selected channel before sending any data. See the figure below. It shows two channels being written to followed by a Frame End Command. The number of eight bit data packets that follows the Channel Command is dependent on user code. There are no restrictions on how many data packets follow the Channel 20
 Frame End")
21 Command. Each 8 bit data packet in both the commands and data follow the SPI signaling convention. This means the Arduino SPI library is used to send commands and data over the SPI bus. Serial Graph Tool Arduino Coding This section will explain the example code and how to create your own Arduino Serial Graph. Open the Arduino IDE and locate the Arduino Example code. Load up the Arduino_SGTool_Analog_Monitor_U2 sketch. The first thing to add to the sketch is #include EPT_SGTool.h" And #include <SPI.h> The first include is the EPT Serial Graph Tool library and the second is the Arduino SPI library. 21

22 Next, declare an integer Channel and integer AnalogReadValue. The Channel variable will hold the channel number that the data will be written to. The AnalogReadValue will hold the result of the analogread() function. 22
23 Next, declare the buffer to hold the data that will transmitted to the Serial Graph Tool. The buffer is limited to a size of 500 integers. This limit is important because the Arduino Uno has an SRAM of 2048 bytes. 500 integers will take up half of the memory. The user code will need some amount for the program and some amount for the stack. 23

24 The setup() function is next. The code will set the analog I/O s as inputs, define the variables, and initialize the Serial Graph Tool. 24
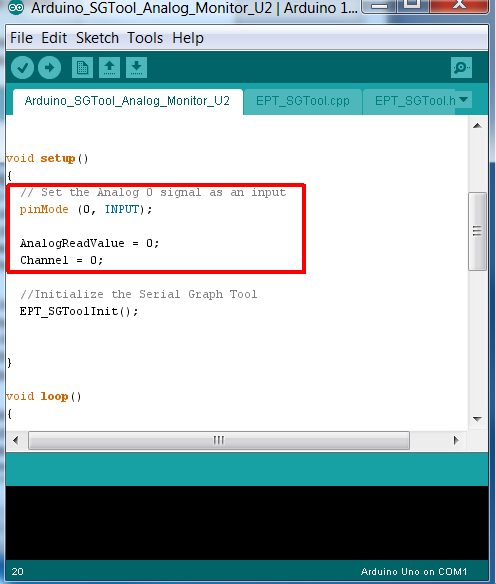
25 25
26 Next, the code enters the main loop() function. First thing to do at the top of the loop is to check the channel number and make sure it has not incremented above the highest channel number. If so, roll the channel back to zero. This will allow each channel to fill up a data buffer and transmit it to the Serial Graph Tool. 26
27 Next, the code enters the buffer loop. A for loop is set up so that one data point is entered into each element of the 500 integer buffer. The channel number was set by the definition of the Channel variable. 27
28 Each time through the for loop, the analogread() function is called with the Channel number providing the pin number for the analog input. The result of the analogread () function is stored in the variable AnalogReadValue. This value in turn is stored into the buffer element selected by the for loop. 28
29 When the for loop has iterated 450 times, the channel buffer has enough data to fill up the Serial Graph Tool display for the selected channel. So, the for loop exits. EPT_SGToolWriteBlockData() is called. This function takes the channel number, number of bits per data element and total number of elements in the buffer and a pointer to the buffer and transmits this data to the Serial Graph Tool. 29

30 Nex, the EPT_SGToolFrameEnd() function is called to graph the data in the buffer. 30
31 Finally, the Channel variable is incremented by one and the process starts over again. This process will go through and record the output for the next analog input (A1) into the ChannelBuffer1. Then the data is transmitted to the Serial Graph Tool and graphed to the display. This process repeats for all 6 channels. Then, it starts over again at channel zero. This will continue forever, or at least until the power is removed. 31

32 Make sure the appropriate board and serial port are selected. Click on the Upload button, and the code will load onto the Arduino Uno. Next, open up the Serial Graph Tool to actually graph your data. VisiPort 2 Using the GUI Connect the EPT-220X-DB-U2 to the Arduino Uno. Connect each board to an open serial port on the PC using both USB cables. Make sure that an example sketch is loaded into your Arduino. Go to Start->Serial Graph Tool to view the files and folders. 32

33 Just click on the Serial Graph Tool icon to launch the application. When the application loads, click on the drop down box at the upper right of the window. Select the Serial Graph Tool 0 in the list. Next, Click Open and Start. The Ardiuno data will display on the graph. When the Serial Graph Tool connects with the EPT-220X-DB-U2 and the Arduino Uno is 33

34 running the Analog Monitor code, the display will show all six analog inputs on the screen. All of the channels will be grouped at the same spot on the graph by default. To separate these channels, click on the drop down box underneath the Channel Select lable. 34
35 Select a channel and us the Vertical Position slider to adjust the position of the channel graph in the display. Notice that the channel indicator highlights in bold when the channel is selected. 35
36 Grab the Vertical Scale slider and push up on it until the scale is 1/3. This divides each data element in channel 1 by 1/3. 36
37 Repeat this process for all six signals. Leaving one division between each channel. 37
38 Each channel can also be scaled in the Horizontal Scale. Provide Channel 1 with a signal. A simple way to do this is to touch your finger to the analog input. Then click the Stop button. The Stop button will cause the Serial Graph Tool to stop filling the circular buffers with new data. All of the previously stored data is preserved in the circular buffers. This allows to you to scroll through the data to view events that occurred in the past. 38
39 Turn off each channel (except for Channel 1) by first selecting the channel, then clicking on the On/Off button directly below the Channel Select drop down box. 39
40 Select Channel 1 and grab the Time (Scale) slider and slide it to the left. Notice the signal is zooming out. 40

41 Next, slide the Time (Scale) slider all the way to the right. Notice that the display is zooming into the signal. 41
42 Grab the Horizontal Position Slider and pull it to the left. The display slides to the left. The data is actually being pushed to the right, but the effect is to view older data. Click the Rst button to remove the horizontal scaling and display the data without the scale. 42
43 Grab the Horizontal Position Slider and pull it to the right. The display slides to the right. The data is actually being pushed to the left, but the effect is to view the newest data. When the slide right gets to the beginning of the newest data, it cycles around and starts to display the data at the beginning of the circular buffer. This data is the oldest in the buffer, as the newest data overwrites the oldest data in the buffer. 43
44 Data can also be viewed as 8, 10, 12, or 16 bits. The Arduino code must store the collected data as 8, 10, 12, or 16 bits before selecting these settings in Serial Graph Tool. To do this, closes the EPT Serial Graph Tool 0 device and exit out of the application. Open the Arduino SGTool Analog Monitor example code in the Serial Graph Tool folder. Use the Rst button to reset the location of the horizontal position of the data to the start of the most recent 450 data elements of the circular buffer. 44
45 Scroll down to the EPT_SGToolWriteBlockData() function. Change the EIGHT_BIT_DATA parameter to TEN_BIT_DATA. 45
46 This will store each sample of the analogread() function as a ten bit word instead of an eight bit byte. Then, go to Serial Graph Tool and re-open it. Notice that the data oscillates from zero to the top byte data. This is because the data is now being transmitted as to byte packets. In eight bit mode, the data is transmitted in single byte packets. To display this data correctly select the 10 Bit radio button. 46
47 The Serial Graph Tool converts the upper byte and the lower byte of the data into the correct ten bit format. Each of the analog inputs are correctly displayed. The same directions hold true for twelve and sixteen bit data. Serial Graph Tool So, that is all there is to the Serial Graph Tool. It is up to the user to add it to their Arduino project. 47
The Answer to the 14 Most Frequently Asked Modbus Questions
 Modbus Frequently Asked Questions WP-34-REV0-0609-1/7 The Answer to the 14 Most Frequently Asked Modbus Questions Exactly what is Modbus? Modbus is an open serial communications protocol widely used in
Kurz MODBUS Client User s Guide
 Kurz MODBUS Client User s Guide Introduction The Kurz MODBUS Client program can be used to demonstrate how the Kurz MFTB and MFTA Series products can be used in a MODBUS protocol network. The program is
WA Manager Alarming System Management Software Windows 98, NT, XP, 2000 User Guide
 WA Manager Alarming System Management Software Windows 98, NT, XP, 2000 User Guide Version 2.1, 4/2010 Disclaimer While every effort has been made to ensure that the information in this guide is accurate
Installing the IF-NMEASC & SC30 Windows XP Drivers & Software
 Installing the IF-NMEASC & SC30 Windows XP Drivers & Software The following document will outline the installation and use of the IF-NMEASC and SC-30 USB drivers and SC-30Tool software in three parts:
Hydras 3 LT Quick Start
 Catalog Number 6234218 Hydras 3 LT Quick Start SOFTWARE MANUAL December 2005, Edition 2 Hach Company, 2005. All rights reserved. Printed in the U.S.A. Catalog Number 6234218 Hydras 3 LT SOFTWARE MANUAL
RFID Logger Software User Manual Rev 1.0
 RFID Logger Software User Manual Rev 1.0 Table of Contents 1. System Overview... 2 2. Installation... 2 3. USB RFID Interface Box... 3 4. Operation... 4 4.1. Start Up... 4 4.2. Menu overview... 4 4.2.1.
Bidirectional wireless communication using EmbedRF
 Bidirectional wireless communication using EmbedRF 1. Tools you will need for this application note... 2 2. Introduction... 3 3. Connect EmbedRF Board to USB Interface Board... 3 4. Install and Run EmbedRF
Work with Arduino Hardware
 1 Work with Arduino Hardware Install Support for Arduino Hardware on page 1-2 Open Block Libraries for Arduino Hardware on page 1-9 Run Model on Arduino Hardware on page 1-12 Tune and Monitor Models Running
Capacitive Touch Lab. Renesas Capacitive Touch Lab R8C/36T-A Family
 Renesas Capacitive Touch Lab R8C/36T-A Family Description: This lab will cover the Renesas Touch Solution for embedded capacitive touch systems. This lab will demonstrate how to setup and run a simple
Multi-Touch Control Wheel Software Development Kit User s Guide
 Multi-Touch Control Wheel Software Development Kit User s Guide V3.0 Bulletin #1204 561 Hillgrove Avenue LaGrange, IL 60525 Phone: (708) 354-1040 Fax: (708) 354-2820 E-mail: [email protected] www.grayhill.com/instinct
Surveillance System Using Wireless Sensor Networks
 Surveillance System Using Wireless Sensor Networks Dan Nguyen, Leo Chang Computer Engineering, Santa Clara University Santa Clara, California, USA [email protected] [email protected] Abstract The
STIM202 Evaluation Kit
 Table of contents: 1 FEATURES... 2 2 GENERAL DESCRIPTIONS AND SYSTEM CONTENTS... 2 3 SYSTEM REQUIREMENTS... 2 4 GETTING STARTED... 3 4.1 INSTALLATION OF NI-SERIAL CABLE ASSEMBLY DRIVER... 3 4.2 INSTALLATION
Arduino Lesson 1. Blink
 Arduino Lesson 1. Blink Created by Simon Monk Last updated on 2015-01-15 09:45:38 PM EST Guide Contents Guide Contents Overview Parts Part Qty The 'L' LED Loading the 'Blink' Example Saving a Copy of 'Blink'
First Bytes Programming Lab 2
 First Bytes Programming Lab 2 This lab is available online at www.cs.utexas.edu/users/scottm/firstbytes. Introduction: In this lab you will investigate the properties of colors and how they are displayed
The I2C Bus. NXP Semiconductors: UM10204 I2C-bus specification and user manual. 14.10.2010 HAW - Arduino 1
 The I2C Bus Introduction The I2C-bus is a de facto world standard that is now implemented in over 1000 different ICs manufactured by more than 50 companies. Additionally, the versatile I2C-bus is used
FAQ Sprint 3G/4G USB Modem U300
 Page 1 of 5 FAQ Sprint 3G/4G USB Modem U300 Q: What is the Sprint 3G/4G USB Modem U300? A: The U300 USB modem provides broadband access via Sprint s 3G and 4G networks when plugged into USB port on a PC
CCNA Discovery 4.0.3.0 Networking for Homes and Small Businesses Student Packet Tracer Lab Manual
 4.0.3.0 Networking for Homes and Small Businesses Student Packet Tracer Lab Manual This document is exclusive property of Cisco Systems, Inc. Permission is granted to print and copy this document for non-commercial
PM1122 INT DIGITAL INTERFACE REMOTE
 PM1122 INT DIGITAL INTERFACE REMOTE PM1122 INT front panel description: 1. Clear wireless remotes knob: push this button for more than 2 seconds to clear the list of all assigned wireless remote settings
Global Water Instrumentation, Inc.
 Global Water Instrumentation, Inc. 151 Graham Road P.O. Box 9010 College Station, TX 77842-9010 Telephone : 800-876-1172 International : (979) 690-5560, Fax : (979) 690-0440 e-mail : [email protected]
Waspmote. Quickstart Guide
 Waspmote Quickstart Guide Index Document version: v4.3-11/2014 Libelium Comunicaciones Distribuidas S.L. INDEX 1. Introduction... 3 2. General and safety information... 4 3. Waspmote s Hardware Setup...
Modbus and ION Technology
 70072-0104-14 TECHNICAL 06/2009 Modbus and ION Technology Modicon Modbus is a communications protocol widely used in process control industries such as manufacturing. PowerLogic ION meters are compatible
Speedlink software will run on Windows NT, Windows 7, and Windows 8; it will run on both 32 byte and 64 byte versions of Windows.
 Guide to the Speedlink software and drivers. Status Instruments has a range of process control equipment that can be configured using the Speedlink software. Some equipment will connect directly to a Windows
DAS202Tools v1.0.0 for DAS202 Operating Manual
 DAS202Tools v1.0.0 for DAS202 Operating Manual DAT102Tools 1.0.0 Manual Table of context 2 Table of Contents 1 General Information... 3 2 PC... Configuration Requirements 3 3 Software Installation... 3
Online Monitoring User Guide
 High Resolution Temperature Sensing Strip Online Monitoring User Guide 888.637.3282 www.nerdata.com Page 1 of 26 Contents The Aurora Online Monitoring System... 3 1. Creating an Account on the Aurora Online
Cart Interface Installation & Control Board Manual for M38 XP and RX Carts and Legacy M39 Carts
 Rubbermaid Medical Solutions Cart Interface Installation & Control Board Manual for M38 XP and RX Carts and Legacy M39 Carts REVISED FEBRUARY 25, 2010 Filename: Cart Interface Installation & Control Board
FrontDesk Installation And Configuration
 Chapter 2 FrontDesk Installation And Configuration FrontDesk v4.1.25 FrontDesk Software Install Online Software Activation Installing State Related Databases Setting up a Workstation Internet Transfer
Model 288B Charge Plate Graphing Software Operators Guide
 Monroe Electronics, Inc. Model 288B Charge Plate Graphing Software Operators Guide P/N 0340175 288BGraph (80207) Software V2.01 100 Housel Ave PO Box 535 Lyndonville NY 14098 1-800-821-6001 585-765-2254
Analog Devices Welcomes Hittite Microwave Corporation NO CONTENT ON THE ATTACHED DOCUMENT HAS CHANGED
 Analog Devices Welcomes Hittite Microwave Corporation NO CONTENT ON THE ATTACHED DOCUMENT HAS CHANGED www.analog.com www.hittite.com THIS PAGE INTENTIONALLY LEFT BLANK PLL & PLL with Integrated VCO Evaluation
User's Guide DylosLogger Software Version 1.6
 User's Guide DylosLogger Software Version 1.6 The DylosLogger software allows users of Dylos Air Quality Monitors equipped with PC interface to easily record, download, and graph data. The COM port is
Lab Experiment 1: The LPC 2148 Education Board
 Lab Experiment 1: The LPC 2148 Education Board 1 Introduction The aim of this course ECE 425L is to help you understand and utilize the functionalities of ARM7TDMI LPC2148 microcontroller. To do that,
MAX6683 Evaluation System/Evaluation Kit
 19-2343; Rev 1; 3/07 MAX6683 Evaluation System/Evaluation Kit General Description The MAX6683 evaluation system (EV system) consists of a MAX6683 evaluation kit (EV kit) and a companion Maxim CMODUSB board.
Monitoring Software using Sun Spots. Corey Andalora February 19, 2008
 Monitoring Software using Sun Spots Corey Andalora February 19, 2008 Abstract Sun has developed small devices named Spots designed to provide developers familiar with the Java programming language a platform
SA-9600 Surface Area Software Manual
 SA-9600 Surface Area Software Manual Version 4.0 Introduction The operation and data Presentation of the SA-9600 Surface Area analyzer is performed using a Microsoft Windows based software package. The
Below is a diagram explaining the data packet and the timing related to the mouse clock while receiving a byte from the PS-2 mouse:
 PS-2 Mouse: The Protocol: For out mini project we designed a serial port transmitter receiver, which uses the Baud rate protocol. The PS-2 port is similar to the serial port (performs the function of transmitting
User Manual. AS-Interface Programmer
 AS-Interface Programmer Notice: RESTRICTIONS THE ZMD AS-INTERFACE PROGRAMMER HARDWARE AND ZMD AS-INTERFACE PROGRAMMER SOFTWARE IS DESIGNED FOR IC EVALUATION, LABORATORY SETUP AND MODULE DEVELOPMENT ONLY.
DAKTON µ BOX MANUAL µbox User Manual 1
 µbo User Manual 1 DAKTON µ BO: compact data logger and sensor µ BO is a sensor and a data logger together. It records data processed by DAKTON DASHBOARD with the addition of lateral and longitudinal accelerations.
Getting started with the O Watch
 Getting started with the O Watch Congratulations on your very own O Watch kit! O Watch kit has all the pieces you will need to make your watch. In this project you will learn how electronic parts fit together
Quick Start Guide. MRB-KW01 Development Platform Radio Utility Application Demo MODULAR REFERENCE BOARD
 Quick Start Guide MRB-KW01 Development Platform Radio Utility Application Demo MODULAR REFERENCE BOARD Quick Start Guide Get to Know the MRB-KW01x Module UART Selector ANT 1 RFIO (TX/RX) USB 2.0 Serial
Microcontroller Code Example Explanation and Words of Wisdom For Senior Design
 Microcontroller Code Example Explanation and Words of Wisdom For Senior Design For use with the following equipment: PIC16F877 QikStart Development Board ICD2 Debugger MPLAB Environment examplemain.c and
MANUAL FOR RX700 LR and NR
 MANUAL FOR RX700 LR and NR 2013, November 11 Revision/ updates Date, updates, and person Revision 1.2 03-12-2013, By Patrick M Affected pages, ETC ALL Content Revision/ updates... 1 Preface... 2 Technical
Experiment 5: Magnetic Fields of a Bar Magnet and of the Earth
 MASSACHUSETTS INSTITUTE OF TECHNOLOGY Department of Physics 8.02 Spring 2005 Experiment 5: Magnetic Fields of a Bar Magnet and of the Earth OBJECTIVES 1. To examine the magnetic field associated with a
General Precautions The user must operate each product according to the performance specifications described in the operation manuals.
 General Precautions The user must operate each product according to the performance specifications described in the operation manuals. Before using the product under conditions which are not described
An Introduction to MPLAB Integrated Development Environment
 An Introduction to MPLAB Integrated Development Environment 2004 Microchip Technology Incorporated An introduction to MPLAB Integrated Development Environment Slide 1 This seminar is an introduction to
Setting up a Local Interconnect Network (LIN) using dspace MicroAutoBox 1401/1501 Simulink Blocks
 using dspace MicroAutoBox 1401/1501 Simulink Blocks") Setting up a Local Interconnect Network (LIN) using dspace MicroAutoBox 1401/1501 Simulink Blocks Guiseppe Ferro Design Team 4 3/22/13 Executive Summary Learn how to setup and properly use the Real- Time
Setting up a Local Interconnect Network (LIN) using dspace MicroAutoBox 1401/1501 Simulink Blocks Guiseppe Ferro Design Team 4 3/22/13 Executive Summary Learn how to setup and properly use the Real- Time
Chapter 5 - Ethernet Setup
 Chapter 5 - Ethernet Setup Chapter Overview Introduction... 5-3 EtherTalk Network Configuration... 5-3 Select the EtherTalk Phase 2 Driver...5-3 Change the EtherTalk Zone Name...5-4 Novell NetWare Configuration...
Mitsubishi Electric Q Series PLC Ladder Monitor. Operation Manual
 Mitsubishi Electric Q Series PLC Ladder Monitor Operation Manual Preface Thank you for purchasing Pro-face's PLC Ladder Monitor Add-on Kit for the Mitsubishi Electric Q Series PLC. This manual ("Mitsubishi
PART 1. Using USB Mixer with a Computer
 PART 1. Using USB Mixer with a Computer Universal Serial Bus Mixers The USB mixer is equipped with either one or two USB ports that allow you to play and record audio directly from your computer! Just
PDA Software Manual For the Windows CE and Mobile Operating Systems
 PDA Software Manual For the Windows CE and Mobile Operating Systems Global Water Instrumentation, Inc. 151 Graham Road P.O. Box 9010 College Station, TX 77842-9010 T: 800-876-1172 Int l: (979) 690-5560,
Quick Start Using DASYLab with your Measurement Computing USB device
 Quick Start Using DASYLab with your Measurement Computing USB device Thank you for purchasing a USB data acquisition device from Measurement Computing Corporation (MCC). This Quick Start document contains
testo easyheat Configuration and Analysis software Instruction manual
 testo easyheat Configuration and Analysis software Instruction manual en 2 General Information General Information This documentation includes important information about the features and application of
Wireless LAN 802.11g USB Adapter
 Wireless LAN 802.11g USB Adapter User s Guide Version 1.0 User s Guide 0 Copyright statement No part of this publication may be reproduced, stored in a retrieval system, or transmitted in any form or by
Event counters in NOVA
 Case study: how to use the event counters in NOVA? 1 Event counter support NOVA Technical Note 22 Event counters in NOVA Most of the measurement commands, like CV staircase or Record signals (> 1 ms) provide
User Manual. DG LINK Application Program 071-0056-50. www.tektronix.com. This document applies to firmware version 2.00 and above.
 User Manual DG LINK Application Program 071-0056-50 This document applies to firmware version 2.00 and above. www.tektronix.com Copyright Tektronix Japan, Ltd. All rights reserved. Copyright Tektronix,
JVC Monitor Calibration 2 User's Guide
 JVC Monitor Calibration 2 User's Guide Table of Contents 1. What is JVC Monitor Calibration 2? 2. System Requirement 3. Installation (JVC Monitor Calibration 2) 4. Uninstall 5. Installation (EyeOne Display
MS830 / MS833 Barcode Reader v1.0 9-December-2014
 MS830 / MS833 Barcode Reader v1.0 9-December-2014 Publication Information 2014 Imagine Communications Corp. Proprietary and Confidential. Imagine Communications considers this document and its contents
How to use the OMEGALOG software with the OM-SQ2010/SQ2020/SQ2040 Data Loggers.
 How to use the OMEGALOG software with the OM-SQ2010/SQ2020/SQ2040 Data Loggers. OMEGALOG Help Page 2 Connecting Your Data Logger Page 2 Logger Set-up Page 3 Download Data Page 8 Export Data Page 11 Downloading
Keep it Simple Timing
 Keep it Simple Timing Support... 1 Introduction... 2 Turn On and Go... 3 Start Clock for Orienteering... 3 Pre Start Clock for Orienteering... 3 Real Time / Finish Clock... 3 Timer Clock... 4 Configuring
Building a Simulink model for real-time analysis V1.15.00. Copyright g.tec medical engineering GmbH
 g.tec medical engineering GmbH Sierningstrasse 14, A-4521 Schiedlberg Austria - Europe Tel.: (43)-7251-22240-0 Fax: (43)-7251-22240-39 [email protected], http://www.gtec.at Building a Simulink model for real-time
#include <Gamer.h> Gamer gamer; void setup() { gamer.begin(); } void loop() {
 { gamer.begin(); } void loop() {") #include Gamer gamer; void setup() { gamer.begin(); void loop() { Gamer Keywords Inputs Board Pin Out Library Instead of trying to find out which input is plugged into which pin, you can use
#include Gamer gamer; void setup() { gamer.begin(); void loop() { Gamer Keywords Inputs Board Pin Out Library Instead of trying to find out which input is plugged into which pin, you can use
ebus Player Quick Start Guide
 ebus Player Quick Start Guide This guide provides you with the information you need to efficiently set up and start using the ebus Player software application to control your GigE Vision or USB3 Vision
1. Installing The Monitoring Software
 SD7000 Digital Microphone Monitor Software manual Table of Contents 1. Installing The Monitor Software 1.1 Setting Up Receivers For Monitoring 1.2 Running The Application 1.3 Shutdown 2. The Detail Monitoring
QUICK START GUIDE. SG2 Client - Programming Software SG2 Series Programmable Logic Relay
 QUICK START GUIDE SG2 Client - Programming Software SG2 Series Programmable Logic Relay SG2 Client Programming Software T he SG2 Client software is the program editor for the SG2 Series Programmable Logic
PHYS 2P32 Project: MIDI for Arduino/ 8 Note Keyboard
 PHYS 2P32 Project: MIDI for Arduino/ 8 Note Keyboard University April 13, 2016 About Arduino: The Board Variety of models of Arduino Board (I am using Arduino Uno) Microcontroller constructd similarly
Transmitter Interface Program
 Transmitter Interface Program Operational Manual Version 3.0.4 1 Overview The transmitter interface software allows you to adjust configuration settings of your Max solid state transmitters. The following
LP 2844 Thermal Printer
 Quick Installation Guide FedEx Ship Manager Software FedEx Ship Manager at fedex.com LP 2844 Thermal Printer Step 1: Confirm Printer Kit Contents Your printer kit contains: 1. Thermal Printer 4. Serial
FREQUENTLY ASKED QUESTIONS (FAQs) 123Scan 2 Scanner Configuration Utility 19 April 2011
 123Scan 2 Scanner Configuration Utility 19 April 2011") FREQUENTLY ASKED QUESTIONS (FAQs) 123Scan 2 Scanner Configuration Utility 19 April 2011 Table of Content Question No. Product Overview What model scanners are supported by 123Scan 2 1 What are the key
FREQUENTLY ASKED QUESTIONS (FAQs) 123Scan 2 Scanner Configuration Utility 19 April 2011 Table of Content Question No. Product Overview What model scanners are supported by 123Scan 2 1 What are the key
The modular concept of the MPA-3 system is designed to enable easy accommodation to a huge variety of experimental requirements.
 HARDWARE DESCRIPTION The modular concept of the MPA-3 system is designed to enable easy accommodation to a huge variety of experimental requirements. BASE MODULE GO LINE Digital I/O 8 Analog Out AUX 1
Communication Protocol
 Analysis of the NXT Bluetooth Communication Protocol By Sivan Toledo September 2006 The NXT supports Bluetooth communication between a program running on the NXT and a program running on some other Bluetooth
HOBO Single Channel Thermocouple Data Logger (UX100-014M) Manual
 Manual") HOBO Single Channel Thermocouple Data Logger (UX100-014M) Manual HOBO Single Channel Thermocouple Data Logger UX100-014M Included Items: Command strip Double-sided tape Hook & loop strap Required Items:
HOBO Single Channel Thermocouple Data Logger (UX100-014M) Manual HOBO Single Channel Thermocouple Data Logger UX100-014M Included Items: Command strip Double-sided tape Hook & loop strap Required Items:
Windows XP.. ELITE Firmware Update procedures.. v1.41
 Windows XP.. ELITE Firmware Update procedures.. v1.41 Download and Extract the ELITE update. Note.. Please ensure you are logged in to Windows as an Administrator before carrying out the instructions in
In-System Programmer USER MANUAL RN-ISP-UM RN-WIFLYCR-UM-.01. www.rovingnetworks.com 1
 RN-WIFLYCR-UM-.01 RN-ISP-UM In-System Programmer 2012 Roving Networks. All rights reserved. Version 1.1 1/19/2012 USER MANUAL www.rovingnetworks.com 1 OVERVIEW You use Roving Networks In-System-Programmer
PN-L702B LCD MONITOR TOUCH PANEL DRIVER OPERATION MANUAL. Version 2.1
 PN-L702B LCD MONITOR TOUCH PANEL DRIVER OPERATION MANUAL Version 2.1 Contents Setting up the PC...3 Installing the touch panel driver...3 Touch Panel Settings...4 How to configure settings...4 Calibration...5
How To Use An Ams 5812 Pressure Sensor With A Usb Starter Kit
 User Guide USB Starter Kit AMS 5812 Phone:+49 (0)6131/91 0730-0 Fax: +49 (0)6131/91 073-30 Internet: E Mail: [email protected] Analog Microelectronics GmbH An der Fahrt 13, D 55124 Mainz May 2012 - Rev.
Ovation Operator Workstation for Microsoft Windows Operating System Data Sheet
 Ovation Operator Workstation for Microsoft Windows Operating System Features Delivers full multi-tasking operation Accesses up to 200,000 dynamic points Secure standard operating desktop environment Intuitive
Productivity Software Features
 O P E R A T I O N S A N D P R O C E D U R E S F O R T H E P R O D U C T I V I T Y S O F T W A R E Productivity Software Features Remote CS-230 calibration and set-up on a personal computer. CS-230 calibration
Page 1 S5.5 Monitoring Software Manual Rev 1.2 for Software Ver 1.0
 Trantec S5.5 Monitoring Software Manual Initial Setup Minimum PC Requirements 1.6 GHz CPU, 256 MB Memory, 1 available USB port, Windows XP Recommended PC >2.0 GHz CPU, 512 MB (XP) 1 GB (Vista) memory,
5. Tutorial. Starting FlashCut CNC
 FlashCut CNC Section 5 Tutorial 259 5. Tutorial Starting FlashCut CNC To start FlashCut CNC, click on the Start button, select Programs, select FlashCut CNC 4, then select the FlashCut CNC 4 icon. A dialog
Arduino DUE + DAC MCP4922 (SPI)
") Arduino DUE + DAC MCP4922 (SPI) v101 In this document it will described how to connect and let a Digital/Analog convert work with an Arduino DUE. The big difference between and Arduino DUE and other Arduinos
Arduino DUE + DAC MCP4922 (SPI) v101 In this document it will described how to connect and let a Digital/Analog convert work with an Arduino DUE. The big difference between and Arduino DUE and other Arduinos
Skyworth LCD Video Wall Controller User Manual Please read the user guide book carefully before using this product
 Skyworth LCD Video Wall Controller User Manual Please read the user guide book carefully before using this product 1 Contents 1. Features 2. Specifications 3. Control System Illustration 4. Operation 2
Installation Instructions for 9555 USB Driver
 Prior to using the data modem features of your 9555 handset; you must first install the VCOMPORT 9555 USB Driver. This driver is compatible with: Windows XP Service Pack 2, Windows 2000 Service Pack 4,
Configurator Software Manual
 Configurator Software Manual The information contained in this document is believed to be correct, but OMEGA accepts no liability for any errors it contains, and reserves the right to alter specifications
I2C PRESSURE MONITORING THROUGH USB PROTOCOL.
 I2C PRESSURE MONITORING THROUGH USB PROTOCOL. Product Details: To eradicate human error while taking readings such as upper precision or lower precision Embedded with JAVA Application: Technology Used:
Manual Version CV20060926-1
 Manual Version CV20060926-1 CaseViewer 3.1 2 CaseViewer 3.1 Table of Contents Introduction to CaseViewer... 4 Interface at a Glance... 5 Understanding the Interface... 6 Case Log Display... 6 Event Notes:...
Section 5: Installing the Print Driver
 Section 5: Installing the Print Driver In This Section Print Driver Installation for USB Connection Using the Ethernet Connection and a Crossover Cable Print Driver: The Epilog print driver is the software
Universal Simple Control, USC-1
 Universal Simple Control, USC-1 Data and Event Logging with the USB Flash Drive DATA-PAK The USC-1 universal simple voltage regulator control uses a flash drive to store data. Then a propriety Data and
English. TI.GRAPH LINKé. FOR WINDOWSë FOR THE TI.92 Plus CONDENSED GUIDEBOOK. Texas Instruments Instructional Communications. Guidebook developed by:
 English TI.GRAPH LINKé FOR WINDOWSë FOR THE TI.92 Plus CONDENSED GUIDEBOOK Guidebook developed by: Texas Instruments Instructional Communications TI-GRAPH LINK is a trademark of Texas Instruments Incorporated.
Lab 3: Introduction to Data Acquisition Cards
 Lab 3: Introduction to Data Acquisition Cards INTRODUCTION: In this lab, you will be building a VI to display the input measured on a channel. However, within your own VI you will use LabVIEW supplied
EVAL-UFDC-1/UFDC-1M-16
 Evaluation Board for Universal Frequency-to- Digital Converters UFDC-1 and UFDC-1M-16 EVAL-UFDC-1/UFDC-1M-16 FEATURES Full-Featured Evaluation Board for the Universal Frequency-to-Digital Converters UFDC-1
Dash 18X / Dash 18 Data Acquisition Recorder
 75 Dash 18X / Dash 18 Data Acquisition Recorder QUICK START GUIDE Supports Recorder System Software Version 3.1 1. INTRODUCTION 2. GETTING STARTED 3. HARDWARE OVERVIEW 4. MENUS & BUTTONS 5. USING THE DASH
Lab 6 Introduction to Serial and Wireless Communication
 University of Pennsylvania Department of Electrical and Systems Engineering ESE 111 Intro to Elec/Comp/Sys Engineering Lab 6 Introduction to Serial and Wireless Communication Introduction: Up to this point,
Dash 8Xe / Dash 8X Data Acquisition Recorder
 75 Dash 8Xe / Dash 8X Data Acquisition Recorder QUICK START GUIDE Supports Recorder System Software Version 2.0 1. INTRODUCTION 2. GETTING STARTED 3. HARDWARE OVERVIEW 4. MENUS & BUTTONS 5. USING THE DASH
ValveLink Mobile Software
 Quick Start Guide ValveLink Mobile Software Version 4.0 ValveLink Mobile Software ValveLink Mobile software lets you configure, calibrate, and troubleshoot FIELDVUE DVC2000, DVC6000, DVC6000f, DVC6200,
Lenovo Miix 2 8. User Guide. Read the safety notices and important tips in the included manuals before using your computer.
 Lenovo Miix 2 8 User Guide Read the safety notices and important tips in the included manuals before using your computer. Notes Before using the product, be sure to read Lenovo Safety and General Information
LabVIEW Day 6: Saving Files and Making Sub vis
 LabVIEW Day 6: Saving Files and Making Sub vis Vern Lindberg You have written various vis that do computations, make 1D and 2D arrays, and plot graphs. In practice we also want to save that data. We will
Guide to Installing BBL Crystal MIND on Windows 7
 Guide to Installing BBL Crystal MIND on Windows 7 Introduction The BBL Crystal MIND software can not be directly installed on the Microsoft Windows 7 platform, however it can be installed and run via XP
RcWare SoftPLC Modbus server mapping editor User manual
 RcWare SoftPLC Modbus server mapping editor User manual 1 Contents 1 Contents... 2 2 Why SoftPLC as a Modbus server... 3 3 Installation and setup of the Modbus mapping editor... 4 4 Creating and editing
Music Data Management Software. Data Manager for Windows. User s Guide
 E Music Data Management Software Data Manager for Windows User s Guide Use this manual in combination with the User fs Guide that comes with the Instrument. DATAMANAGERE1C Contents Introduction...3 What
Nighthawk AC1900 WiF Range Extender
 Nighthawk AC1900 WiF Range Extender Model EX7000 User Manual December 2014 202-11469-01 350 East Plumeria Drive San Jose, CA 95134 USA Nighthawk AC1900 WiF Range Extender Support Thank you for selecting
ScanWin Installation and Windows 7-64 bit operating system
 ScanWin Installation and Windows 7-64 bit operating system In order to run the ScanWin Pro install and program on Windows 7 64 bit operating system you need to install a Virtual PC and then install a valid,
LCD MONITOR TOUCH PANEL DRIVER 2 OPERATION MANUAL. for Mac. Version 1.0 PN-L703A/PN-70TA3/PN-L703B/PN-70TB3/PN-L603A/PN-60TA3/PN-L603B/PN-60TB3
 LCD MONITOR TOUCH PANEL DRIVER 2 OPERATION MANUAL for Mac Version 1.0 Applicable models PN-L703A/PN-70TA3/PN-L703B/PN-70TB3/PN-L603A/PN-60TA3/PN-L603B/PN-60TB3 Contents Introduction...3 System Requirements...3