Hypothesis Testing. Hypothesis Testing
|
|
|
- Benedict Stephens
- 9 years ago
- Views:
Transcription
1 Hypothesis Testing Daniel A. Menascé Department of Computer Science George Mason University 1 Hypothesis Testing Purpose: make inferences about a population parameter by analyzing differences between observed sample statistics and the results one expects to obtain if some underlying assumption is true. Null hypothesis: H 0 : µ = x Alternative hypothesis: H1 : µ x If the null hypothesis is rejected then the alternative hypothesis is accepted. 2 1

2 0.0 µ rejection non-rejection rejection critical values Test statistic: Z X µ = σ n 3 Risks in Decision Making Type I Error occurs if H o is rejected when it is true. Pr [H o is rejected true] = α Type II Error occurs if H o is not rejected when it is false. Pr[H o is not rejected false] = β Confidence coefficient: Pr [H o not rejected true]= 1- α Power of the test: Pr[H o is rejected false]= 1-β 4 2
![Pr [H o is rejected true] = α Type II Error occurs if H o is not rejected when it is false.](/docs-images/46/21274218/images/page_2.jpg "Pr[H o is not rejected false] = β Confidence coefficient: Pr [H o not rejected true]= 1- α Power of")
3 Actual Situation Accept H o H o true Correct decision Confidence=1-α H o false Type II Error: Pr[Type II]=β Reject H o Type I Error P[Type I]=α Correct Decision Power=1-β 5 Example of Hypothesis Testing A sample of 50 files from a file system is selected. The sample mean is 12.3Kbytes. The standard deviation is known to be 0.5 Kbytes. Ho: µ = 12.5 Κbytes H 1 : µ 12.5 Κbytes Confidence:

4 rejection=0.025 rejection= non-rejection = 0.95 NORMINV(1-0.05/2,0,1) Z = = Reject H o 7 Z Test of Hypothesis for the Mean Null Hypothesis m= 12.5 Level of Significance 0.05 Population Standard Deviation 0.5 Sample Size 50 Sample Mean 12.3 Standard Error of the Mean Z Test Statistic Two-Tailed Test Lower Critical Value Upper Critical Value p-value Reject the null hypothesis 8 4

5 Steps in Hypothesis Testing 1. State the null and alternative hypothesis. 2. Choose the level of significance α. 3. Choose the sample size n. Larger samples allow us to detect even small differences between sample statistics and true population parameters. For a given α, increasing n decreases β. 4. Choose the appropriate statistical technique and test statistic to use (Z or t). 9 Steps in Hypothesis Testing 5. Determine the critical values that divide the regions of acceptance and nonacceptance. 6. Collect the data and compute the sample mean and the appropriate test statistic (e.g., Z). 7. If the test statistic falls in the non-reject region, H o cannot be rejected. Else H o is rejected. 10 5
.")
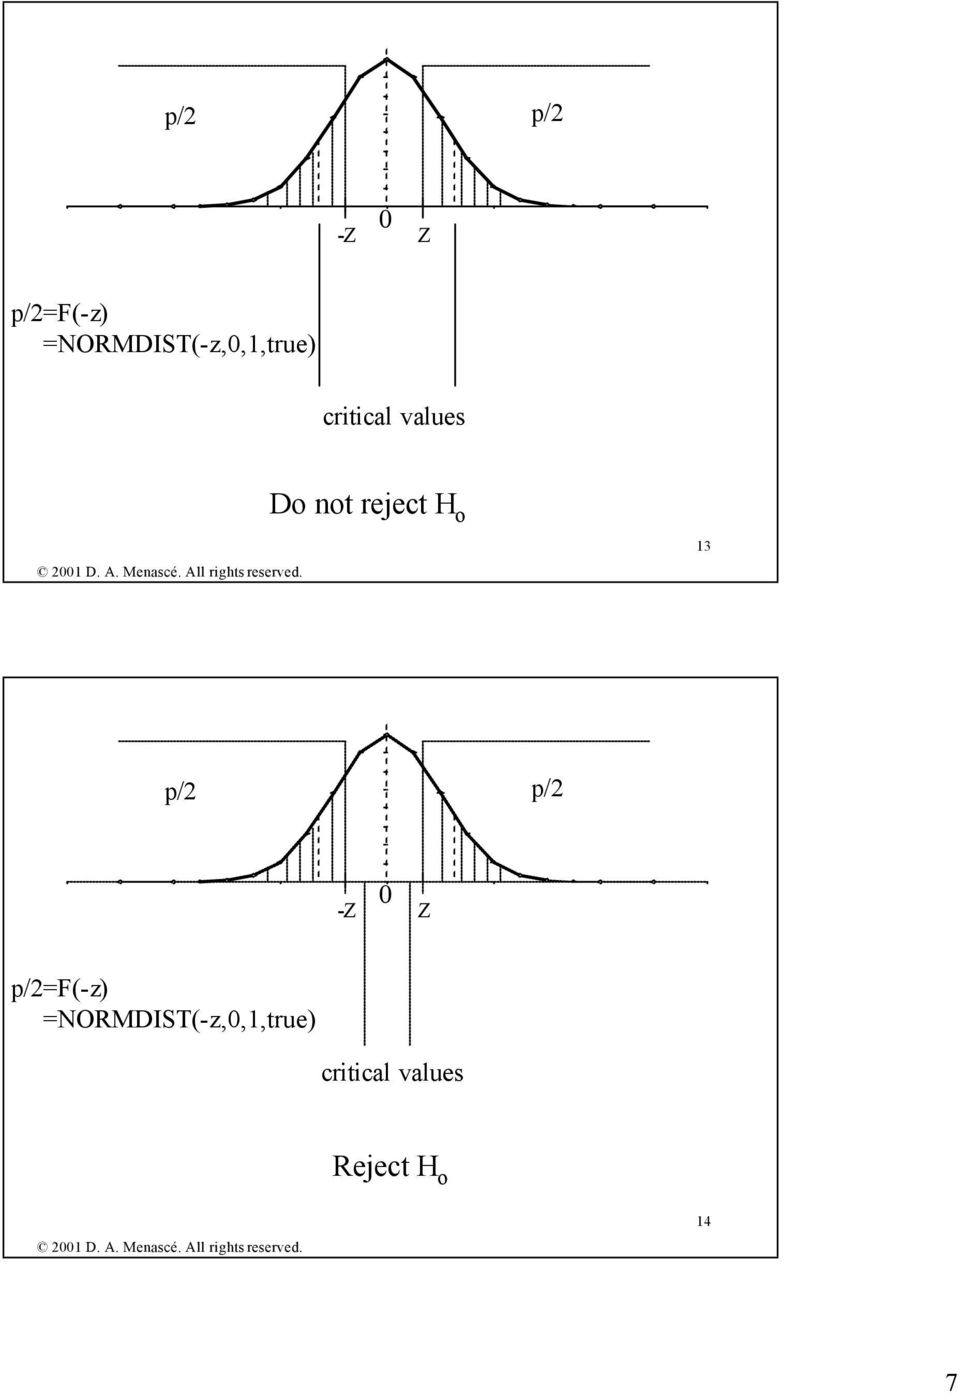
6 The p-value Approach p-value: observed level of significance. Defined as the probability that the test statistic is equal to or more extreme than the result obtained from the sample data, given that H o is true. 11 p/2 p/2 0 -Z Z p/2=f(-z) =NORMDIST(-z,0,1,true) critical values If p α then do not reject H o, else reject H o. 12 6
 =NORMDIST(-z,0,1,true) critical values If p α then do")
7 p/2 p/2 0 -Z Z p/2=f(-z) =NORMDIST(-z,0,1,true) critical values Do not reject H o 13 p/2 p/2 0 -Z Z p/2=f(-z) =NORMDIST(-z,0,1,true) critical values Reject H o 14 7
8 NORMDIST( ,0,1,TRUE) Computing p-values Z Test of Hypothesis for the Mean Null Hypothesis m= 12.5 Level of Significance 0.05 Population Standard Deviation 0.5 Sample Size 50 Sample Mean 12.3 Standard Error of the Mean Z Test Statistic Two-Tailed Test Lower Critical Value Upper Critical Value p-value Reject the null hypothesis The null hypothesis is rejected because p (0.0047) is less than the level of significance (0.05). 15 Steps in Determining the p-value. 1. State the null and alternative hypothesis. 2. Choose the level of significance α. 3. Choose the sample size n. Larger samples allow us to detect even small differences between sample statistics and true population parameters. For a given α, increasing n decreases β. 4. Choose the appropriate statistical technique and test statistic to use (Z or t). 16 8

9 Steps in Determining the p-value. 5. Collect the data and compute the sample mean and the appropriate test statistic (e.g., Z). 6. Calculate the p-value based on the test statistic 7. Compare the p-value to α. 8. If p α then do not reject H o, else reject H o. 17 One-tailed Tests Null hypothesis is an inequality. H o 3.5 H 1 <

10 α 1-α 0.0 µ rejection non-rejection critical value Test statistic: Z X µ = σ n 19 Example of One-Tailed Test A sample of 50 files from a file system is selected. The sample mean is 12.35Kbytes. The standard deviation is known to be 0.5 Kbytes. Ho: µ 12.3 Κbytes H 1 : µ < 12.3 Κbytes Confidence:

11 Example of One-Tailed Test Z X µ = σ / n = = / 50 (test statistic) Critical value =NORMINV(0.05,0,1)= Region of non-rejection: Z So, do not reject H o. (Z exceeds critical value) (α) 0.95 (1 α) 0.0 µ rejection non-rejection (test statistic) (critical value) Test statistic: Z X µ = σ n 22 11
 21 0.05 (α) 0.95 (1 α) 0.0 µ rejection non-rejection 0.")
12 One-tailed Test Z Test of Hypothesis for the Mean Null Hypothesis m= 12.3 Level of Significance 0.05 Population Standard Deviation 0.5 Sample Size 50 Sample Mean Standard Error of the Mean Z Test Statistic Lower-Tail Test Lower Critical Value p-value Do not reject the null hypothesis 23 Hypothesis Tests with Unknown σ If the population is assumed to be normally distributed the sampling distribution for the mean follows a t distribution with n-1 degrees of freedom. t statistic for unknown σ: t = X µ s n Use sample standard deviation 24 12

13 Example of Hypothesis Testing A sample of 50 files from a file system is selected. The sample mean is 12.3Kbytes. The sample standard deviation is 0.5 Kbytes. Ho: µ = Κbytes H 1 : µ Κbytes Confidence: t Test of Hypothesis for the Mean Null Hypothesis m= Level of Significance 0.05 Sample Size 50 Sample Mean 12.3 Sample Standard Deviation 0.5 Standard Error of the Mean Degrees of Freedom 49 t Test Statistic TINV(0.05,49) Two-Tailed Test Lower Critical Value Upper Critical Value p -Value Do not reject the null hypothesis The t test statistic is between the lower and critical values. So, do not reject the null hypothesis

Hypothesis Testing --- One Mean
 Hypothesis Testing --- One Mean A hypothesis is simply a statement that something is true. Typically, there are two hypotheses in a hypothesis test: the null, and the alternative. Null Hypothesis The hypothesis
HYPOTHESIS TESTING: POWER OF THE TEST
 HYPOTHESIS TESTING: POWER OF THE TEST The first 6 steps of the 9-step test of hypothesis are called "the test". These steps are not dependent on the observed data values. When planning a research project,
An Introduction to Statistics Course (ECOE 1302) Spring Semester 2011 Chapter 10- TWO-SAMPLE TESTS
 Spring Semester 2011 Chapter 10- TWO-SAMPLE TESTS") The Islamic University of Gaza Faculty of Commerce Department of Economics and Political Sciences An Introduction to Statistics Course (ECOE 130) Spring Semester 011 Chapter 10- TWO-SAMPLE TESTS Practice
The Islamic University of Gaza Faculty of Commerce Department of Economics and Political Sciences An Introduction to Statistics Course (ECOE 130) Spring Semester 011 Chapter 10- TWO-SAMPLE TESTS Practice
Section 7.1. Introduction to Hypothesis Testing. Schrodinger s cat quantum mechanics thought experiment (1935)
") Section 7.1 Introduction to Hypothesis Testing Schrodinger s cat quantum mechanics thought experiment (1935) Statistical Hypotheses A statistical hypothesis is a claim about a population. Null hypothesis
Section 7.1 Introduction to Hypothesis Testing Schrodinger s cat quantum mechanics thought experiment (1935) Statistical Hypotheses A statistical hypothesis is a claim about a population. Null hypothesis
Introduction to Hypothesis Testing. Hypothesis Testing. Step 1: State the Hypotheses
 Introduction to Hypothesis Testing 1 Hypothesis Testing A hypothesis test is a statistical procedure that uses sample data to evaluate a hypothesis about a population Hypothesis is stated in terms of the
Estimation of σ 2, the variance of ɛ
 Estimation of σ 2, the variance of ɛ The variance of the errors σ 2 indicates how much observations deviate from the fitted surface. If σ 2 is small, parameters β 0, β 1,..., β k will be reliably estimated
Correlational Research
 Correlational Research Chapter Fifteen Correlational Research Chapter Fifteen Bring folder of readings The Nature of Correlational Research Correlational Research is also known as Associational Research.
Chapter 2. Hypothesis testing in one population
 Chapter 2. Hypothesis testing in one population Contents Introduction, the null and alternative hypotheses Hypothesis testing process Type I and Type II errors, power Test statistic, level of significance
Chapter 7 Notes - Inference for Single Samples. You know already for a large sample, you can invoke the CLT so:
 Chapter 7 Notes - Inference for Single Samples You know already for a large sample, you can invoke the CLT so: X N(µ, ). Also for a large sample, you can replace an unknown σ by s. You know how to do a
LAB 4 INSTRUCTIONS CONFIDENCE INTERVALS AND HYPOTHESIS TESTING
 LAB 4 INSTRUCTIONS CONFIDENCE INTERVALS AND HYPOTHESIS TESTING In this lab you will explore the concept of a confidence interval and hypothesis testing through a simulation problem in engineering setting.
HYPOTHESIS TESTING (ONE SAMPLE) - CHAPTER 7 1. used confidence intervals to answer questions such as...
 - CHAPTER 7 1. used confidence intervals to answer questions such as...") HYPOTHESIS TESTING (ONE SAMPLE) - CHAPTER 7 1 PREVIOUSLY used confidence intervals to answer questions such as... You know that 0.25% of women have red/green color blindness. You conduct a study of men
HYPOTHESIS TESTING (ONE SAMPLE) - CHAPTER 7 1 PREVIOUSLY used confidence intervals to answer questions such as... You know that 0.25% of women have red/green color blindness. You conduct a study of men
Introduction to Hypothesis Testing OPRE 6301
 Introduction to Hypothesis Testing OPRE 6301 Motivation... The purpose of hypothesis testing is to determine whether there is enough statistical evidence in favor of a certain belief, or hypothesis, about
Two-Sample T-Tests Allowing Unequal Variance (Enter Difference)
") Chapter 45 Two-Sample T-Tests Allowing Unequal Variance (Enter Difference) Introduction This procedure provides sample size and power calculations for one- or two-sided two-sample t-tests when no assumption
Chapter 45 Two-Sample T-Tests Allowing Unequal Variance (Enter Difference) Introduction This procedure provides sample size and power calculations for one- or two-sided two-sample t-tests when no assumption
3.4 Statistical inference for 2 populations based on two samples
 3.4 Statistical inference for 2 populations based on two samples Tests for a difference between two population means The first sample will be denoted as X 1, X 2,..., X m. The second sample will be denoted
Two-Sample T-Tests Assuming Equal Variance (Enter Means)
") Chapter 4 Two-Sample T-Tests Assuming Equal Variance (Enter Means) Introduction This procedure provides sample size and power calculations for one- or two-sided two-sample t-tests when the variances of
Chapter 4 Two-Sample T-Tests Assuming Equal Variance (Enter Means) Introduction This procedure provides sample size and power calculations for one- or two-sided two-sample t-tests when the variances of
Hypothesis Testing. Reminder of Inferential Statistics. Hypothesis Testing: Introduction
 Hypothesis Testing PSY 360 Introduction to Statistics for the Behavioral Sciences Reminder of Inferential Statistics All inferential statistics have the following in common: Use of some descriptive statistic
Pearson's Correlation Tests
 Chapter 800 Pearson's Correlation Tests Introduction The correlation coefficient, ρ (rho), is a popular statistic for describing the strength of the relationship between two variables. The correlation
BA 275 Review Problems - Week 6 (10/30/06-11/3/06) CD Lessons: 53, 54, 55, 56 Textbook: pp. 394-398, 404-408, 410-420
 CD Lessons: 53, 54, 55, 56 Textbook: pp. 394-398, 404-408, 410-420") BA 275 Review Problems - Week 6 (10/30/06-11/3/06) CD Lessons: 53, 54, 55, 56 Textbook: pp. 394-398, 404-408, 410-420 1. Which of the following will increase the value of the power in a statistical test
BA 275 Review Problems - Week 6 (10/30/06-11/3/06) CD Lessons: 53, 54, 55, 56 Textbook: pp. 394-398, 404-408, 410-420 1. Which of the following will increase the value of the power in a statistical test
Hypothesis testing - Steps
 Hypothesis testing - Steps Steps to do a two-tailed test of the hypothesis that β 1 0: 1. Set up the hypotheses: H 0 : β 1 = 0 H a : β 1 0. 2. Compute the test statistic: t = b 1 0 Std. error of b 1 =
5/31/2013. Chapter 8 Hypothesis Testing. Hypothesis Testing. Hypothesis Testing. Outline. Objectives. Objectives
 C H 8A P T E R Outline 8 1 Steps in Traditional Method 8 2 z Test for a Mean 8 3 t Test for a Mean 8 4 z Test for a Proportion 8 6 Confidence Intervals and Copyright 2013 The McGraw Hill Companies, Inc.
Independent t- Test (Comparing Two Means)
") Independent t- Test (Comparing Two Means) The objectives of this lesson are to learn: the definition/purpose of independent t-test when to use the independent t-test the use of SPSS to complete an independent
Independent t- Test (Comparing Two Means) The objectives of this lesson are to learn: the definition/purpose of independent t-test when to use the independent t-test the use of SPSS to complete an independent
Difference of Means and ANOVA Problems
 Difference of Means and Problems Dr. Tom Ilvento FREC 408 Accounting Firm Study An accounting firm specializes in auditing the financial records of large firm It is interested in evaluating its fee structure,particularly
Experimental Design. Power and Sample Size Determination. Proportions. Proportions. Confidence Interval for p. The Binomial Test
 Experimental Design Power and Sample Size Determination Bret Hanlon and Bret Larget Department of Statistics University of Wisconsin Madison November 3 8, 2011 To this point in the semester, we have largely
HYPOTHESIS TESTING (ONE SAMPLE) - CHAPTER 7 1. used confidence intervals to answer questions such as...
 - CHAPTER 7 1. used confidence intervals to answer questions such as...") HYPOTHESIS TESTING (ONE SAMPLE) - CHAPTER 7 1 PREVIOUSLY used confidence intervals to answer questions such as... You know that 0.25% of women have red/green color blindness. You conduct a study of men
HYPOTHESIS TESTING (ONE SAMPLE) - CHAPTER 7 1 PREVIOUSLY used confidence intervals to answer questions such as... You know that 0.25% of women have red/green color blindness. You conduct a study of men
Chapter 8 Hypothesis Testing Chapter 8 Hypothesis Testing 8-1 Overview 8-2 Basics of Hypothesis Testing
 Chapter 8 Hypothesis Testing 1 Chapter 8 Hypothesis Testing 8-1 Overview 8-2 Basics of Hypothesis Testing 8-3 Testing a Claim About a Proportion 8-5 Testing a Claim About a Mean: s Not Known 8-6 Testing
Regression Analysis: A Complete Example
 Regression Analysis: A Complete Example This section works out an example that includes all the topics we have discussed so far in this chapter. A complete example of regression analysis. PhotoDisc, Inc./Getty
Simple Linear Regression Inference
 Simple Linear Regression Inference 1 Inference requirements The Normality assumption of the stochastic term e is needed for inference even if it is not a OLS requirement. Therefore we have: Interpretation
Two Related Samples t Test
 Two Related Samples t Test In this example 1 students saw five pictures of attractive people and five pictures of unattractive people. For each picture, the students rated the friendliness of the person
1. What is the critical value for this 95% confidence interval? CV = z.025 = invnorm(0.025) = 1.96
 = 1.96") 1 Final Review 2 Review 2.1 CI 1-propZint Scenario 1 A TV manufacturer claims in its warranty brochure that in the past not more than 10 percent of its TV sets needed any repair during the first two years
1 Final Review 2 Review 2.1 CI 1-propZint Scenario 1 A TV manufacturer claims in its warranty brochure that in the past not more than 10 percent of its TV sets needed any repair during the first two years
Point Biserial Correlation Tests
 Chapter 807 Point Biserial Correlation Tests Introduction The point biserial correlation coefficient (ρ in this chapter) is the product-moment correlation calculated between a continuous random variable
Chapter Study Guide. Chapter 11 Confidence Intervals and Hypothesis Testing for Means
 OPRE504 Chapter Study Guide Chapter 11 Confidence Intervals and Hypothesis Testing for Means I. Calculate Probability for A Sample Mean When Population σ Is Known 1. First of all, we need to find out the
Stats Review Chapters 9-10
 Stats Review Chapters 9-10 Created by Teri Johnson Math Coordinator, Mary Stangler Center for Academic Success Examples are taken from Statistics 4 E by Michael Sullivan, III And the corresponding Test
Permutation Tests for Comparing Two Populations
 Permutation Tests for Comparing Two Populations Ferry Butar Butar, Ph.D. Jae-Wan Park Abstract Permutation tests for comparing two populations could be widely used in practice because of flexibility of
BA 275 Review Problems - Week 5 (10/23/06-10/27/06) CD Lessons: 48, 49, 50, 51, 52 Textbook: pp. 380-394
 CD Lessons: 48, 49, 50, 51, 52 Textbook: pp. 380-394") BA 275 Review Problems - Week 5 (10/23/06-10/27/06) CD Lessons: 48, 49, 50, 51, 52 Textbook: pp. 380-394 1. Does vigorous exercise affect concentration? In general, the time needed for people to complete
BA 275 Review Problems - Week 5 (10/23/06-10/27/06) CD Lessons: 48, 49, 50, 51, 52 Textbook: pp. 380-394 1. Does vigorous exercise affect concentration? In general, the time needed for people to complete
How To Test For Significance On A Data Set
 Non-Parametric Univariate Tests: 1 Sample Sign Test 1 1 SAMPLE SIGN TEST A non-parametric equivalent of the 1 SAMPLE T-TEST. ASSUMPTIONS: Data is non-normally distributed, even after log transforming.
Final Exam Practice Problem Answers
 Final Exam Practice Problem Answers The following data set consists of data gathered from 77 popular breakfast cereals. The variables in the data set are as follows: Brand: The brand name of the cereal
Module 2 Probability and Statistics
 Module 2 Probability and Statistics BASIC CONCEPTS Multiple Choice Identify the choice that best completes the statement or answers the question. 1. The standard deviation of a standard normal distribution
22. HYPOTHESIS TESTING
 22. HYPOTHESIS TESTING Often, we need to make decisions based on incomplete information. Do the data support some belief ( hypothesis ) about the value of a population parameter? Is OJ Simpson guilty?
12.5: CHI-SQUARE GOODNESS OF FIT TESTS
 125: Chi-Square Goodness of Fit Tests CD12-1 125: CHI-SQUARE GOODNESS OF FIT TESTS In this section, the χ 2 distribution is used for testing the goodness of fit of a set of data to a specific probability
Descriptive Statistics
 Descriptive Statistics Primer Descriptive statistics Central tendency Variation Relative position Relationships Calculating descriptive statistics Descriptive Statistics Purpose to describe or summarize
DDBA 8438: Introduction to Hypothesis Testing Video Podcast Transcript
 DDBA 8438: Introduction to Hypothesis Testing Video Podcast Transcript JENNIFER ANN MORROW: Welcome to "Introduction to Hypothesis Testing." My name is Dr. Jennifer Ann Morrow. In today's demonstration,
Name: (b) Find the minimum sample size you should use in order for your estimate to be within 0.03 of p when the confidence level is 95%.
 Find the minimum sample size you should use in order for your estimate to be within 0.03 of p when the confidence level is 95%.") Chapter 7-8 Exam Name: Answer the questions in the spaces provided. If you run out of room, show your work on a separate paper clearly numbered and attached to this exam. Please indicate which program
Chapter 7-8 Exam Name: Answer the questions in the spaces provided. If you run out of room, show your work on a separate paper clearly numbered and attached to this exam. Please indicate which program
MULTIPLE CHOICE. Choose the one alternative that best completes the statement or answers the question.
 STT315 Practice Ch 5-7 MULTIPLE CHOICE. Choose the one alternative that best completes the statement or answers the question. Solve the problem. 1) The length of time a traffic signal stays green (nicknamed
Applied Data Analysis. Fall 2015
 Applied Data Analysis Fall 2015 Course information: Labs Anna Walsdorff [email protected] Tues. 9-11 AM Mary Clare Roche [email protected] Mon. 2-4 PM Lecture outline 1. Practice
Outline. Topic 4 - Analysis of Variance Approach to Regression. Partitioning Sums of Squares. Total Sum of Squares. Partitioning sums of squares
 Topic 4 - Analysis of Variance Approach to Regression Outline Partitioning sums of squares Degrees of freedom Expected mean squares General linear test - Fall 2013 R 2 and the coefficient of correlation
Lesson 1: Comparison of Population Means Part c: Comparison of Two- Means
 Lesson : Comparison of Population Means Part c: Comparison of Two- Means Welcome to lesson c. This third lesson of lesson will discuss hypothesis testing for two independent means. Steps in Hypothesis
Testing a claim about a population mean
 Introductory Statistics Lectures Testing a claim about a population mean One sample hypothesis test of the mean Department of Mathematics Pima Community College Redistribution of this material is prohibited
Chapter 4 Statistical Inference in Quality Control and Improvement. Statistical Quality Control (D. C. Montgomery)
") Chapter 4 Statistical Inference in Quality Control and Improvement 許 湘 伶 Statistical Quality Control (D. C. Montgomery) Sampling distribution I a random sample of size n: if it is selected so that the
Chapter 4 Statistical Inference in Quality Control and Improvement 許 湘 伶 Statistical Quality Control (D. C. Montgomery) Sampling distribution I a random sample of size n: if it is selected so that the
Lesson 9 Hypothesis Testing
 Lesson 9 Hypothesis Testing Outline Logic for Hypothesis Testing Critical Value Alpha (α) -level.05 -level.01 One-Tail versus Two-Tail Tests -critical values for both alpha levels Logic for Hypothesis
Chapter 8: Hypothesis Testing for One Population Mean, Variance, and Proportion
 Chapter 8: Hypothesis Testing for One Population Mean, Variance, and Proportion Learning Objectives Upon successful completion of Chapter 8, you will be able to: Understand terms. State the null and alternative
Week TSX Index 1 8480 2 8470 3 8475 4 8510 5 8500 6 8480
 1) The S & P/TSX Composite Index is based on common stock prices of a group of Canadian stocks. The weekly close level of the TSX for 6 weeks are shown: Week TSX Index 1 8480 2 8470 3 8475 4 8510 5 8500
Introduction to. Hypothesis Testing CHAPTER LEARNING OBJECTIVES. 1 Identify the four steps of hypothesis testing.
 Introduction to Hypothesis Testing CHAPTER 8 LEARNING OBJECTIVES After reading this chapter, you should be able to: 1 Identify the four steps of hypothesis testing. 2 Define null hypothesis, alternative
General Method: Difference of Means. 3. Calculate df: either Welch-Satterthwaite formula or simpler df = min(n 1, n 2 ) 1.
 1.") General Method: Difference of Means 1. Calculate x 1, x 2, SE 1, SE 2. 2. Combined SE = SE1 2 + SE2 2. ASSUMES INDEPENDENT SAMPLES. 3. Calculate df: either Welch-Satterthwaite formula or simpler df = min(n
General Method: Difference of Means 1. Calculate x 1, x 2, SE 1, SE 2. 2. Combined SE = SE1 2 + SE2 2. ASSUMES INDEPENDENT SAMPLES. 3. Calculate df: either Welch-Satterthwaite formula or simpler df = min(n
t Tests in Excel The Excel Statistical Master By Mark Harmon Copyright 2011 Mark Harmon
 t-tests in Excel By Mark Harmon Copyright 2011 Mark Harmon No part of this publication may be reproduced or distributed without the express permission of the author. [email protected] www.excelmasterseries.com
Interaction between quantitative predictors
 Interaction between quantitative predictors In a first-order model like the ones we have discussed, the association between E(y) and a predictor x j does not depend on the value of the other predictors
Practice Problems and Exams
 Practice Problems and Exams 1 The Islamic University of Gaza Faculty of Commerce Department of Economics and Political Sciences An Introduction to Statistics Course (ECOE 1302) Spring Semester 2009-2010
Calculating P-Values. Parkland College. Isela Guerra Parkland College. Recommended Citation
 Parkland College A with Honors Projects Honors Program 2014 Calculating P-Values Isela Guerra Parkland College Recommended Citation Guerra, Isela, "Calculating P-Values" (2014). A with Honors Projects.
KSTAT MINI-MANUAL. Decision Sciences 434 Kellogg Graduate School of Management
 KSTAT MINI-MANUAL Decision Sciences 434 Kellogg Graduate School of Management Kstat is a set of macros added to Excel and it will enable you to do the statistics required for this course very easily. To
THE FIRST SET OF EXAMPLES USE SUMMARY DATA... EXAMPLE 7.2, PAGE 227 DESCRIBES A PROBLEM AND A HYPOTHESIS TEST IS PERFORMED IN EXAMPLE 7.
 THERE ARE TWO WAYS TO DO HYPOTHESIS TESTING WITH STATCRUNCH: WITH SUMMARY DATA (AS IN EXAMPLE 7.17, PAGE 236, IN ROSNER); WITH THE ORIGINAL DATA (AS IN EXAMPLE 8.5, PAGE 301 IN ROSNER THAT USES DATA FROM
Simple Regression Theory II 2010 Samuel L. Baker
 SIMPLE REGRESSION THEORY II 1 Simple Regression Theory II 2010 Samuel L. Baker Assessing how good the regression equation is likely to be Assignment 1A gets into drawing inferences about how close the
Non-Inferiority Tests for One Mean
 Chapter 45 Non-Inferiority ests for One Mean Introduction his module computes power and sample size for non-inferiority tests in one-sample designs in which the outcome is distributed as a normal random
Hypothesis Testing for Beginners
 Hypothesis Testing for Beginners Michele Piffer LSE August, 2011 Michele Piffer (LSE) Hypothesis Testing for Beginners August, 2011 1 / 53 One year ago a friend asked me to put down some easy-to-read notes
Business Statistics, 9e (Groebner/Shannon/Fry) Chapter 9 Introduction to Hypothesis Testing
 Chapter 9 Introduction to Hypothesis Testing") Business Statistics, 9e (Groebner/Shannon/Fry) Chapter 9 Introduction to Hypothesis Testing 1) Hypothesis testing and confidence interval estimation are essentially two totally different statistical procedures
Business Statistics, 9e (Groebner/Shannon/Fry) Chapter 9 Introduction to Hypothesis Testing 1) Hypothesis testing and confidence interval estimation are essentially two totally different statistical procedures
Comparing Two Groups. Standard Error of ȳ 1 ȳ 2. Setting. Two Independent Samples
 Comparing Two Groups Chapter 7 describes two ways to compare two populations on the basis of independent samples: a confidence interval for the difference in population means and a hypothesis test. The
Understand the role that hypothesis testing plays in an improvement project. Know how to perform a two sample hypothesis test.
 HYPOTHESIS TESTING Learning Objectives Understand the role that hypothesis testing plays in an improvement project. Know how to perform a two sample hypothesis test. Know how to perform a hypothesis test
NONPARAMETRIC STATISTICS 1. depend on assumptions about the underlying distribution of the data (or on the Central Limit Theorem)
") NONPARAMETRIC STATISTICS 1 PREVIOUSLY parametric statistics in estimation and hypothesis testing... construction of confidence intervals computing of p-values classical significance testing depend on assumptions
NONPARAMETRIC STATISTICS 1 PREVIOUSLY parametric statistics in estimation and hypothesis testing... construction of confidence intervals computing of p-values classical significance testing depend on assumptions
Introduction. Hypothesis Testing. Hypothesis Testing. Significance Testing
 Introduction Hypothesis Testing Mark Lunt Arthritis Research UK Centre for Ecellence in Epidemiology University of Manchester 13/10/2015 We saw last week that we can never know the population parameters
Psychology 60 Fall 2013 Practice Exam Actual Exam: Next Monday. Good luck!
 Psychology 60 Fall 2013 Practice Exam Actual Exam: Next Monday. Good luck! Name: 1. The basic idea behind hypothesis testing: A. is important only if you want to compare two populations. B. depends on
WISE Power Tutorial All Exercises
 ame Date Class WISE Power Tutorial All Exercises Power: The B.E.A.. Mnemonic Four interrelated features of power can be summarized using BEA B Beta Error (Power = 1 Beta Error): Beta error (or Type II
A POPULATION MEAN, CONFIDENCE INTERVALS AND HYPOTHESIS TESTING
 CHAPTER 5. A POPULATION MEAN, CONFIDENCE INTERVALS AND HYPOTHESIS TESTING 5.1 Concepts When a number of animals or plots are exposed to a certain treatment, we usually estimate the effect of the treatment
Study Guide for the Final Exam
 Study Guide for the Final Exam When studying, remember that the computational portion of the exam will only involve new material (covered after the second midterm), that material from Exam 1 will make
Confidence Intervals for the Difference Between Two Means
 Chapter 47 Confidence Intervals for the Difference Between Two Means Introduction This procedure calculates the sample size necessary to achieve a specified distance from the difference in sample means
6: Introduction to Hypothesis Testing
 6: Introduction to Hypothesis Testing Significance testing is used to help make a judgment about a claim by addressing the question, Can the observed difference be attributed to chance? We break up significance
NCSS Statistical Software. One-Sample T-Test
 Chapter 205 Introduction This procedure provides several reports for making inference about a population mean based on a single sample. These reports include confidence intervals of the mean or median,
Statistics I for QBIC. Contents and Objectives. Chapters 1 7. Revised: August 2013
 Statistics I for QBIC Text Book: Biostatistics, 10 th edition, by Daniel & Cross Contents and Objectives Chapters 1 7 Revised: August 2013 Chapter 1: Nature of Statistics (sections 1.1-1.6) Objectives
Unit 31 A Hypothesis Test about Correlation and Slope in a Simple Linear Regression
 Unit 31 A Hypothesis Test about Correlation and Slope in a Simple Linear Regression Objectives: To perform a hypothesis test concerning the slope of a least squares line To recognize that testing for a
Part 2: Analysis of Relationship Between Two Variables
 Part 2: Analysis of Relationship Between Two Variables Linear Regression Linear correlation Significance Tests Multiple regression Linear Regression Y = a X + b Dependent Variable Independent Variable
SAMPLE SIZE CONSIDERATIONS
 SAMPLE SIZE CONSIDERATIONS Learning Objectives Understand the critical role having the right sample size has on an analysis or study. Know how to determine the correct sample size for a specific study.
Using R for Linear Regression
 Using R for Linear Regression In the following handout words and symbols in bold are R functions and words and symbols in italics are entries supplied by the user; underlined words and symbols are optional
II. DISTRIBUTIONS distribution normal distribution. standard scores
 Appendix D Basic Measurement And Statistics The following information was developed by Steven Rothke, PhD, Department of Psychology, Rehabilitation Institute of Chicago (RIC) and expanded by Mary F. Schmidt,
1.5 Oneway Analysis of Variance
 Statistics: Rosie Cornish. 200. 1.5 Oneway Analysis of Variance 1 Introduction Oneway analysis of variance (ANOVA) is used to compare several means. This method is often used in scientific or medical experiments
Descriptive Analysis
 Research Methods William G. Zikmund Basic Data Analysis: Descriptive Statistics Descriptive Analysis The transformation of raw data into a form that will make them easy to understand and interpret; rearranging,
Non-Inferiority Tests for Two Means using Differences
 Chapter 450 on-inferiority Tests for Two Means using Differences Introduction This procedure computes power and sample size for non-inferiority tests in two-sample designs in which the outcome is a continuous
This can dilute the significance of a departure from the null hypothesis. We can focus the test on departures of a particular form.
 One-Degree-of-Freedom Tests Test for group occasion interactions has (number of groups 1) number of occasions 1) degrees of freedom. This can dilute the significance of a departure from the null hypothesis.
1-3 id id no. of respondents 101-300 4 respon 1 responsible for maintenance? 1 = no, 2 = yes, 9 = blank
 Basic Data Analysis Graziadio School of Business and Management Data Preparation & Entry Editing: Inspection & Correction Field Edit: Immediate follow-up (complete? legible? comprehensible? consistent?
Hypothesis Testing: Two Means, Paired Data, Two Proportions
 Chapter 10 Hypothesis Testing: Two Means, Paired Data, Two Proportions 10.1 Hypothesis Testing: Two Population Means and Two Population Proportions 1 10.1.1 Student Learning Objectives By the end of this
Summary of Formulas and Concepts. Descriptive Statistics (Ch. 1-4)
") Summary of Formulas and Concepts Descriptive Statistics (Ch. 1-4) Definitions Population: The complete set of numerical information on a particular quantity in which an investigator is interested. We assume
Summary of Formulas and Concepts Descriptive Statistics (Ch. 1-4) Definitions Population: The complete set of numerical information on a particular quantity in which an investigator is interested. We assume
Math 251, Review Questions for Test 3 Rough Answers
 Math 251, Review Questions for Test 3 Rough Answers 1. (Review of some terminology from Section 7.1) In a state with 459,341 voters, a poll of 2300 voters finds that 45 percent support the Republican candidate,
Chapter 7 Section 1 Homework Set A
 Chapter 7 Section 1 Homework Set A 7.15 Finding the critical value t *. What critical value t * from Table D (use software, go to the web and type t distribution applet) should be used to calculate the
SPSS/Excel Workshop 2 Semester One, 2010
 SPSS/Excel Workshop 2 Semester One, 2010 In Assignment 2 of STATS 10x you may want to use Excel or SPSS to perform some calculations, that is, finding Normal probabilities and Inverse Normal values in
UNDERSTANDING THE DEPENDENT-SAMPLES t TEST
 UNDERSTANDING THE DEPENDENT-SAMPLES t TEST A dependent-samples t test (a.k.a. matched or paired-samples, matched-pairs, samples, or subjects, simple repeated-measures or within-groups, or correlated groups)
2 Precision-based sample size calculations
 Statistics: An introduction to sample size calculations Rosie Cornish. 2006. 1 Introduction One crucial aspect of study design is deciding how big your sample should be. If you increase your sample size
Introduction to Analysis of Variance (ANOVA) Limitations of the t-test
 Limitations of the t-test") Introduction to Analysis of Variance (ANOVA) The Structural Model, The Summary Table, and the One- Way ANOVA Limitations of the t-test Although the t-test is commonly used, it has limitations Can only
Introduction to Analysis of Variance (ANOVA) The Structural Model, The Summary Table, and the One- Way ANOVA Limitations of the t-test Although the t-test is commonly used, it has limitations Can only
Chapter 4: Statistical Hypothesis Testing
 Chapter 4: Statistical Hypothesis Testing Christophe Hurlin November 20, 2015 Christophe Hurlin () Advanced Econometrics - Master ESA November 20, 2015 1 / 225 Section 1 Introduction Christophe Hurlin
Practice problems for Homework 12 - confidence intervals and hypothesis testing. Open the Homework Assignment 12 and solve the problems.
 Practice problems for Homework 1 - confidence intervals and hypothesis testing. Read sections 10..3 and 10.3 of the text. Solve the practice problems below. Open the Homework Assignment 1 and solve the
COMPARISONS OF CUSTOMER LOYALTY: PUBLIC & PRIVATE INSURANCE COMPANIES.
 277 CHAPTER VI COMPARISONS OF CUSTOMER LOYALTY: PUBLIC & PRIVATE INSURANCE COMPANIES. This chapter contains a full discussion of customer loyalty comparisons between private and public insurance companies
Bowerman, O'Connell, Aitken Schermer, & Adcock, Business Statistics in Practice, Canadian edition
 Bowerman, O'Connell, Aitken Schermer, & Adcock, Business Statistics in Practice, Canadian edition Online Learning Centre Technology Step-by-Step - Excel Microsoft Excel is a spreadsheet software application
Statistiek II. John Nerbonne. October 1, 2010. Dept of Information Science [email protected]
 Dept of Information Science [email protected] October 1, 2010 Course outline 1 One-way ANOVA. 2 Factorial ANOVA. 3 Repeated measures ANOVA. 4 Correlation and regression. 5 Multiple regression. 6 Logistic