Canonical Correlation Analysis
|
|
|
- Ralph Hill
- 9 years ago
- Views:
Transcription
1 Canonical Correlation Analysis Lecture 11 August 4, 2011 Advanced Multivariate Statistical Methods ICPSR Summer Session #2 Lecture #11-8/4/2011 Slide 1 of 39

2 Today s Lecture Canonical Correlation Analysis Today s Lecture What it is How it works How to do such an analysis Examples of uses of canonical correlations Lecture #11-8/4/2011 Slide 2 of 39

3 Purpose Purpose Concept Bivariate Correlation Multiple Correlation Canonical Correlation In general, when we have univariate data there are times when we would like to measure the linear relationship between things The simplest case is when we have 2 variables and all we are interested in is measuring their linear relationship. Here we would just use bivariate correlation Another case is in multiple regression when we have several independent variables and one dependent variable. In this case we would use the multiple correlation coefficient (R 2 ) So, it would be nice if we could expand the idea used in these to a situation where we have several y variables and several x variables Lecture #11-8/4/2011 Slide 3 of 39
 So, it would be nice if we could expand the idea used in these to a situation where we have several y variables")
4 Concept From Webster s Dictionary: canonical: reduced to the simplest or clearest schema possible. Purpose Concept Bivariate Correlation Multiple Correlation Canonical Correlation What do we mean by basic ideas? In describing canonical correlation, we will start with the basic cases where we only have two variables and build on it until we get to canonical correlations 1. First we will look at the bivariate correlation 2. Then we will see what was done to generalize bivariate correlation to the multiple correlation coefficient 3. Finally, these discussions will lead us right to what happens in canonical correlation analysis Lecture #11-8/4/2011 Slide 4 of 39

5 Bivariate Correlation Begin by thinking of just two variables y and x Purpose Concept Bivariate Correlation Multiple Correlation Canonical Correlation In this case the correlation describes the extent that one variable relates (can predict) the other That is...the stronger the correlation the more we will know about y by just knowing x No relationship Strong positive relationship Lecture #11-8/4/2011 Slide 5 of 39

6 Multiple Correlation On the other hand, if we have one y and multiple x variables we can no longer look at a simple relationship between the two variables Purpose Concept Bivariate Correlation Multiple Correlation Canonical Correlation But, we can look at how well the set of x variables can predict the y by just computing the regression line Using the regression line we can compute our predicted ŷ and we can compare it to the y variable. Specifically, we now have only two variables y and ŷ = x b = so we can compute a simple correlation Note: we started with something that was more complicated (many x variables) and changed it in to something that we could compute a simple correlation (between y and ŷ) Lecture #11-8/4/2011 Slide 6 of 39
 and")
7 Multiple Correlation Example From Weisberg (1985, p. 240). Purpose Concept Bivariate Correlation Multiple Correlation Canonical Correlation Property taxes on a house are supposedly dependent on the current market value of the house. Since houses actually sell only rarely, the sale price of each house must be estimated every year when property taxes are set. Regression methods are sometimes used to make up a prediction function. We have data for 27 houses sold in the mid 1970 s in Erie, Pennsylvania: x 1 : Current taxes (local, school, and county) 100 (dollars) x 2 : Number of bathrooms x 3 : Living space 1000 (square feet) x 4 : Age of house (years) y: Actual sale price 1000 (dollars) Lecture #11-8/4/2011 Slide 7 of 39

8 Multiple Correlation Example To compute the multiple correlation of x 1, x 2, x 3, and x 4 with y, first compute the multiple regression for all x variables and y: Purpose Concept Bivariate Correlation Multiple Correlation Canonical Correlation proc reg data=house; model y=x1-x4; output out=newdata p=yhat; run; Then, take the predicted values given by the model, ŷ and correlate them with y: proc corr data=newdata; var yhat y; run; Lecture #11-8/4/2011 Slide 8 of 39

9 Multiple Correlation Example Purpose Concept Bivariate Correlation Multiple Correlation Canonical Correlation Lecture #11-8/4/2011 Slide 9 of 39

10 Multiple Correlation Example Purpose Concept Bivariate Correlation Multiple Correlation Canonical Correlation Above is the multiple correlation between x 1, x 2, x 3, x 4 and y Lecture #11-8/4/2011 Slide 10 of 39

11 Canonical Correlation Canonical correlation seeks to find the correlation between multiple x variables and multiple y variables Purpose Concept Bivariate Correlation Multiple Correlation Canonical Correlation Now we have several y variables and several x variables so neither of our previous two examples can directly apply, BUT we can take the points from the previous cases and use them for this new case So we could look at how well the set of x variables can predict the set of y variables, but in doing this we still will not be able to compute a simple correlation On the other hand, in the multiple regression we found a linear combination of the variables b x to get a single variable In our case we have two sets of variables so it makes sense that we can define two linear combinations...one for the x variables (b 1 ) and one for the y variables (a 1 ) Lecture #11-8/4/2011 Slide 11 of 39

12 Canonical Correlation Purpose Concept Bivariate Correlation Multiple Correlation Canonical Correlation In the simple case where we only have a single linear combination for each set of variables we can compute the simple correlation between these two linear combinations The first canonical correlation describes the correlation between these two new variables (b 1x and a 1y) So how do we pick the linear transformations? These linear transformations (b 1 and a 1 ) are picked such that the correlation between these two new variables is maximized Notice that this idea is really no different from what we did in multiple regression This also sounds similar to something we have done in PCA Lecture #11-8/4/2011 Slide 12 of 39
 are picked such that the correlation between these two new variables is maximized Notice that this idea is really no different from what")
13 Canonical Correlation ONE LAST THING Purpose Concept Bivariate Correlation Multiple Correlation Canonical Correlation Think back to PCA when we said that a single linear combination did not account for all of the information present in a data set... Then we could determine how many linear combinations were needed to capture more information (where the linear combinations were all uncorrelated) We can do the same thing here... We can define more sets of linear combinations (b i and a i, i = 1,...,s where s = min (p, q), p is the number of variables in the group of x and q is the number of variables in y) Each linear combinations maximizes the correlation between the new variables under the constraint that they are uncorrelated with all other previous linear combinations Lecture #11-8/4/2011 Slide 13 of 39

14 To show how to compute canonical correlations, first consider our original covariance matrix from our example: Example #2 Standardized Weights Canonical Corr. Properties Hypothesis Test for Corr. x 1 x 2 x 3 x 4 y x x x x y Lecture #11-8/4/2011 Slide 14 of 39

15 From this matrix, we will define four new sub-matrices, from which we will calculate our correlations: Example #2 Standardized Weights Canonical Corr. Properties Hypothesis Test for Corr. x 1 x 2 x 3 x 4 y x 1 x 2 S xx S xy x 3 x 4 y S xy S yy Lecture #11-8/4/2011 Slide 15 of 39

16 So how do we compute the canonical correlations? Example #2 Standardized Weights Canonical Corr. Properties Hypothesis Test for Corr. To begin, note that we could define the Squared Multiple Correlation R 2 M as which can be rewritten as: R 2 M = S xy S 1 xx S xy S yy R 2 M = S 1 yy S yx S 1 xx S yx For canonical correlations, however, we will focus on the matrix formed by the part of the equation within the (note this was just a scalar when y only has one variable) Lecture #11-8/4/2011 Slide 16 of 39

17 We first compute the square root of the eigenvalues (r 1, r 2,...,r s ) and the eigenvectors (a 1, a 2,...,a s ) of: S 1 yy S yx S 1 xx S xy Example #2 Standardized Weights Canonical Corr. Properties Hypothesis Test for Corr. Then we compute the square root of the eigenvalues (r 1, r 2,...,r s ) and the eigenvectors (b 1, b 2,...,b s ) of: S 1 xx S xy S 1 yy S yx Conveniently, the eigenvalues for both equations are equal (and are between zero and one)! The square root of the eigenvalues represents each successive canonical correlation between the successive pairs of linear combinations From the eigenvectors we have determined the linear transformations for the new linear combinations Lecture #11-8/4/2011 Slide 17 of 39
 of: S 1 xx S xy S 1 yy S yx Conveniently, the eigenvalues for both equations are equal (and are between zero and one)!")
18 Example #2 To illustrate canonical correlations, consider the following analysis: Example #2 Standardized Weights Canonical Corr. Properties Hypothesis Test for Corr. Three physiological and three exercise variables are measured on 27 middle-aged men in a fitness club The variables collected are: Weight (in pounds - x 1 ) Waist size (in inches - x 2 ) Pulse rate (in beats-per-minute - x 3 ) Number of chin-ups performed (y 1 ) Number of sit-ups performed (y 2 ) Number of jumping-jacks performed (y 3 ) The goal of the analysis is to determine the relationship between the physiological measurements and the exercises Lecture #11-8/4/2011 Slide 18 of 39
 Pulse rate (in beats-per-minute - x 3 ) Number of chin-ups performed (y 1 ) Number of sit-ups performed (y 2 ) Number of jumping-jacks")
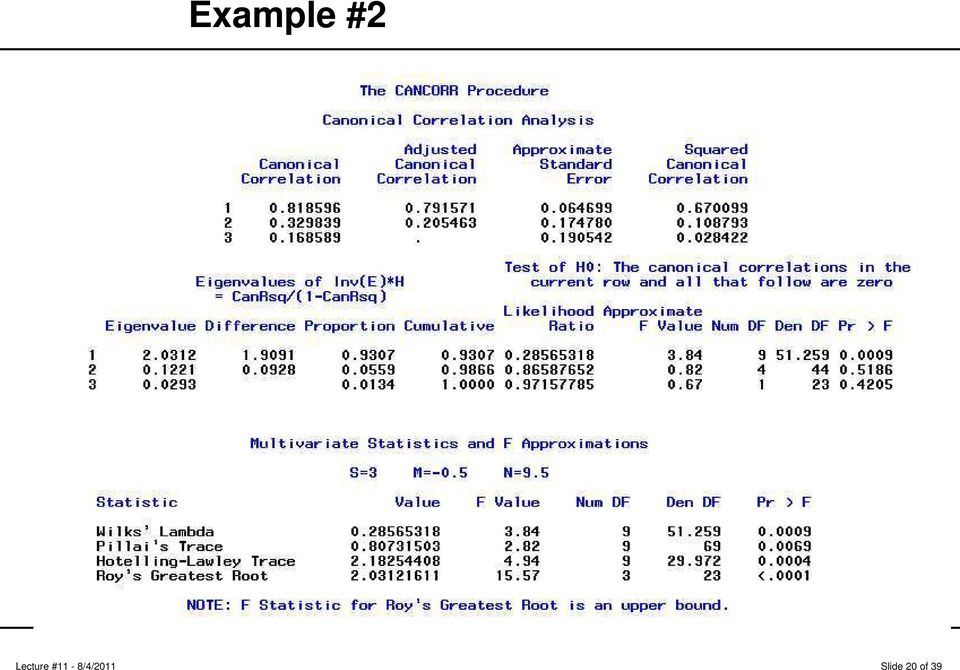
19 Example #2 To run a canonical correlation analysis, use the following code: proc cancorr data=fit all vprefix=physiological vname= Physiological Measurements wprefix=exercises wname= Exercises ; var Weight Waist Pulse; with Chins Situps Jumps; run; Lecture #11-8/4/2011 Slide 19 of 39

20 Example #2 Lecture #11-8/4/2011 Slide 20 of 39
21 Example #2 Lecture #11-8/4/2011 Slide 21 of 39
22 Standardized Weights Just like in PCA and Factor Analysis, we are interested in interpreting the weights of the linear combination Example #2 Standardized Weights Canonical Corr. Properties Hypothesis Test for Corr. However, if our variables are in different scales they are difficult to interpret So, we can standardize them, which is the same as computing the canonical correlations and linear combination of the correlation matrix instead of using the the variance/covariance matrix We can also compute the standardize coefficients (c and d) directly: c = diag(s yy ) 1 2 a and d = diag(s xx ) 1 2 b Lecture #11-8/4/2011 Slide 22 of 39
23 Example #2 Lecture #11-8/4/2011 Slide 23 of 39
24 Canonical Corr. Properties 1. Canonical correlations are invariant. Example #2 Standardized Weights Canonical Corr. Properties Hypothesis Test for Corr. This means that, like any correlation, scale changes (such as standardizing) will not change the correlation. However, it will change the eigenvectors The first canonical correlation is the best we can do with associations. Which means it is better than any of the simple correlations or any multiple correlation with the variables under study Lecture #11-8/4/2011 Slide 24 of 39
25 Hypothesis Test for Corr. We begin by testing that at least the first (the largest) correlation is significantly different from zero Example #2 Standardized Weights Canonical Corr. Properties Hypothesis Test for Corr. If we cannot get a significant relationship out of the optimal linear combination of variables this is the same as testing H 0 : Σ xy = 0 or B 1 = 0 This is tested using Wilk s Lambda: Λ 1 = S S yy S xx Or, equivalently (where 2 is the eigenvalue from the matrix term produced from the submatrices of the covariance matrix): s Λ 1 = (1 ri 2 ) i=1 Lecture #11-8/4/2011 Slide 25 of 39
26 The Rest Example #2 Standardized Weights Canonical Corr. Properties Hypothesis Test for Corr. In this case Λ 1 as Λ 1 = s (1 ri 2 ) i=1 which can be compared to Λ α,p,q,n 1 q (or to a Λ α,q,p,n 1 p ) In general we can compute Λ j = s (1 ri 2 ) i=k which can be compared to Λ α,p k+1,q k+1,n k q (or to a Λ α,q,p,n 1 p ) Lecture #11-8/4/2011 Slide 26 of 39
27 Example #2 Lecture #11-8/4/2011 Slide 27 of 39
28 Standardized Correlation of Linear Combination with Variables Rotation Redundancy Because in many ways a canonical correlation analysis is similar to what we discussed in PCA, the interpretation methods are also similar Specifically, we will discuss four methods that are used to interpret the results: 1. Standardized Coefficients 2. Correlation between Canonical Variates (the linear combination) and each variable 3. Rotation 4. Redundancy Analysis Lecture #11-8/4/2011 Slide 28 of 39
29 Standardized Standardized Correlation of Linear Combination with Variables Rotation Redundancy Because the standardized variables are on the same scale they can be directly compared Those variables that are most important to the association are the ones with the largest absolute values (i.e., determine importance) To interpret what the linear combination is capturing we will also consider the sign of each weight Lecture #11-8/4/2011 Slide 29 of 39
30 Correlation of Linear Combination with Variab This was mentioned in PCA and EFA... Standardized Correlation of Linear Combination with Variables Rotation Redundancy That is, we compute our linear combinations and then compute the correlation between the linear combination (canonical variates) with each of the actual variables The correlations are typically called the loadings or structure coefficients As was the case in PCA this ignores the overall multidimensional structure and so it is not a recommend analysis to make interpretations from Lecture #11-8/4/2011 Slide 30 of 39
31 Rotation Standardized Correlation of Linear Combination with Variables Rotation Redundancy We could try rotating the weights of the analysis to provide an interpretable result... For this we begin to rely on the spacial representation of what is going on with the data Every linear combination is projecting our observations on to a different dimension Sometimes these dimensions are difficult to interpret (i.e., based on the sign and magnitude Sometimes we can rotate these dimensions so that the weights are easier to interpret Some are large and some are small Rotations in CCA are not recommended, because we lose the optimal interpretation of the analysis Lecture #11-8/4/2011 Slide 31 of 39
32 Redundancy Another method for interpretation is a redundancy analysis (this, again, is often not liked by statisticians because it only summarizes univariate relationships) Lecture #11-8/4/2011 Slide 32 of 39
33 Redundancy Lecture #11-8/4/2011 Slide 33 of 39
34 Redundancy Lecture #11-8/4/2011 Slide 34 of 39
35 In a study of social support and mental health, measures of the following seven variables were taken on 405 subjects: Total Social Support Family Social Support Friend Social Support Significant Other Social Support Depression Loneliness Stress The researchers were interested in determining the relationship between social support and mental health...how about using a canonical correlation analysis? Lecture #11-8/4/2011 Slide 35 of 39
36 *SAS Example #3; data depress (type=corr); _type_= corr ; input _name_ $ v1-v7; label v1= total social support v2= family social support v3= friend social support v4= significant other social support v5= depression v6= loneliness v7= stress ; datalines; v v v v v v v ; proc cancorr data=depress all corr edf=404 vprefix=mental_health vname= Mental Health wprefix=social_support wname= Social Support ; var v1-v4; with v5-v7; run; 35-1
37 Lecture #11-8/4/2011 Slide 36 of 39
38 Lecture #11-8/4/2011 Slide 37 of 39
39 In general, the results from a canonical correlations routine are related to: 1. Regression 2. Discriminant Analysis (we will learn this next week) 3. MANOVA However, the goals of canonical correlation overlap with the information provided by a confirmatory factor analysis or structural equation model... Lecture #11-8/4/2011 Slide 38 of 39
40 Final Thought The midterm was accomplished using MANOVA and MANCOVA. Canonical correlation analysis is a complicated analysis that provides many results of interest to researchers. Perhaps because of it s complicated nature, canonical correlation analysis is not often used. Last week: Nebraska...This week: Texas...After that: The world. Tomorrow: Lab Day! Meet in Helen Newberry s Michigan Lab Lecture #11-8/4/2011 Slide 39 of 39
Multivariate Normal Distribution
 Multivariate Normal Distribution Lecture 4 July 21, 2011 Advanced Multivariate Statistical Methods ICPSR Summer Session #2 Lecture #4-7/21/2011 Slide 1 of 41 Last Time Matrices and vectors Eigenvalues
Dimensionality Reduction: Principal Components Analysis
 Dimensionality Reduction: Principal Components Analysis In data mining one often encounters situations where there are a large number of variables in the database. In such situations it is very likely
Module 3: Correlation and Covariance
 Using Statistical Data to Make Decisions Module 3: Correlation and Covariance Tom Ilvento Dr. Mugdim Pašiƒ University of Delaware Sarajevo Graduate School of Business O ften our interest in data analysis
Exploratory Factor Analysis
 Introduction Principal components: explain many variables using few new variables. Not many assumptions attached. Exploratory Factor Analysis Exploratory factor analysis: similar idea, but based on model.
Overview of Factor Analysis
 Overview of Factor Analysis Jamie DeCoster Department of Psychology University of Alabama 348 Gordon Palmer Hall Box 870348 Tuscaloosa, AL 35487-0348 Phone: (205) 348-4431 Fax: (205) 348-8648 August 1,
How To Understand Multivariate Models
 Neil H. Timm Applied Multivariate Analysis With 42 Figures Springer Contents Preface Acknowledgments List of Tables List of Figures vii ix xix xxiii 1 Introduction 1 1.1 Overview 1 1.2 Multivariate Models
Introduction to Principal Components and FactorAnalysis
 Introduction to Principal Components and FactorAnalysis Multivariate Analysis often starts out with data involving a substantial number of correlated variables. Principal Component Analysis (PCA) is a
Introduction: Overview of Kernel Methods
 Introduction: Overview of Kernel Methods Statistical Data Analysis with Positive Definite Kernels Kenji Fukumizu Institute of Statistical Mathematics, ROIS Department of Statistical Science, Graduate University
Multivariate Analysis of Variance (MANOVA)
") Multivariate Analysis of Variance (MANOVA) Aaron French, Marcelo Macedo, John Poulsen, Tyler Waterson and Angela Yu Keywords: MANCOVA, special cases, assumptions, further reading, computations Introduction
Multivariate Analysis of Variance (MANOVA) Aaron French, Marcelo Macedo, John Poulsen, Tyler Waterson and Angela Yu Keywords: MANCOVA, special cases, assumptions, further reading, computations Introduction
containing Kendall correlations; and the OUTH = option will create a data set containing Hoeffding statistics.
 Getting Correlations Using PROC CORR Correlation analysis provides a method to measure the strength of a linear relationship between two numeric variables. PROC CORR can be used to compute Pearson product-moment
Notes on Applied Linear Regression
 Notes on Applied Linear Regression Jamie DeCoster Department of Social Psychology Free University Amsterdam Van der Boechorststraat 1 1081 BT Amsterdam The Netherlands phone: +31 (0)20 444-8935 email:
SIMPLE LINEAR CORRELATION. r can range from -1 to 1, and is independent of units of measurement. Correlation can be done on two dependent variables.
 SIMPLE LINEAR CORRELATION Simple linear correlation is a measure of the degree to which two variables vary together, or a measure of the intensity of the association between two variables. Correlation
Multiple regression - Matrices
 Multiple regression - Matrices This handout will present various matrices which are substantively interesting and/or provide useful means of summarizing the data for analytical purposes. As we will see,
NCSS Statistical Software Principal Components Regression. In ordinary least squares, the regression coefficients are estimated using the formula ( )
") Chapter 340 Principal Components Regression Introduction is a technique for analyzing multiple regression data that suffer from multicollinearity. When multicollinearity occurs, least squares estimates
Chapter 340 Principal Components Regression Introduction is a technique for analyzing multiple regression data that suffer from multicollinearity. When multicollinearity occurs, least squares estimates
DISCRIMINANT FUNCTION ANALYSIS (DA)
") DISCRIMINANT FUNCTION ANALYSIS (DA) John Poulsen and Aaron French Key words: assumptions, further reading, computations, standardized coefficents, structure matrix, tests of signficance Introduction Discriminant
DISCRIMINANT FUNCTION ANALYSIS (DA) John Poulsen and Aaron French Key words: assumptions, further reading, computations, standardized coefficents, structure matrix, tests of signficance Introduction Discriminant
MISSING DATA TECHNIQUES WITH SAS. IDRE Statistical Consulting Group
 MISSING DATA TECHNIQUES WITH SAS IDRE Statistical Consulting Group ROAD MAP FOR TODAY To discuss: 1. Commonly used techniques for handling missing data, focusing on multiple imputation 2. Issues that could
Introduction to Principal Component Analysis: Stock Market Values
 Chapter 10 Introduction to Principal Component Analysis: Stock Market Values The combination of some data and an aching desire for an answer does not ensure that a reasonable answer can be extracted from
MATH 423 Linear Algebra II Lecture 38: Generalized eigenvectors. Jordan canonical form (continued).
.") MATH 423 Linear Algebra II Lecture 38: Generalized eigenvectors Jordan canonical form (continued) Jordan canonical form A Jordan block is a square matrix of the form λ 1 0 0 0 0 λ 1 0 0 0 0 λ 0 0 J = 0
MATH 423 Linear Algebra II Lecture 38: Generalized eigenvectors Jordan canonical form (continued) Jordan canonical form A Jordan block is a square matrix of the form λ 1 0 0 0 0 λ 1 0 0 0 0 λ 0 0 J = 0
A Primer on Mathematical Statistics and Univariate Distributions; The Normal Distribution; The GLM with the Normal Distribution
 A Primer on Mathematical Statistics and Univariate Distributions; The Normal Distribution; The GLM with the Normal Distribution PSYC 943 (930): Fundamentals of Multivariate Modeling Lecture 4: September
Factor Analysis. Chapter 420. Introduction
 Chapter 420 Introduction (FA) is an exploratory technique applied to a set of observed variables that seeks to find underlying factors (subsets of variables) from which the observed variables were generated.
Multivariate Analysis of Variance (MANOVA)
") Chapter 415 Multivariate Analysis of Variance (MANOVA) Introduction Multivariate analysis of variance (MANOVA) is an extension of common analysis of variance (ANOVA). In ANOVA, differences among various
Chapter 415 Multivariate Analysis of Variance (MANOVA) Introduction Multivariate analysis of variance (MANOVA) is an extension of common analysis of variance (ANOVA). In ANOVA, differences among various
A Demonstration of Hierarchical Clustering
 Recitation Supplement: Hierarchical Clustering and Principal Component Analysis in SAS November 18, 2002 The Methods In addition to K-means clustering, SAS provides several other types of unsupervised
15.062 Data Mining: Algorithms and Applications Matrix Math Review
 .6 Data Mining: Algorithms and Applications Matrix Math Review The purpose of this document is to give a brief review of selected linear algebra concepts that will be useful for the course and to develop
Multivariate Statistical Inference and Applications
 Multivariate Statistical Inference and Applications ALVIN C. RENCHER Department of Statistics Brigham Young University A Wiley-Interscience Publication JOHN WILEY & SONS, INC. New York Chichester Weinheim
Similarity and Diagonalization. Similar Matrices
 MATH022 Linear Algebra Brief lecture notes 48 Similarity and Diagonalization Similar Matrices Let A and B be n n matrices. We say that A is similar to B if there is an invertible n n matrix P such that
Review Jeopardy. Blue vs. Orange. Review Jeopardy
 Review Jeopardy Blue vs. Orange Review Jeopardy Jeopardy Round Lectures 0-3 Jeopardy Round $200 How could I measure how far apart (i.e. how different) two observations, y 1 and y 2, are from each other?
FACTOR ANALYSIS. Factor Analysis is similar to PCA in that it is a technique for studying the interrelationships among variables.
 FACTOR ANALYSIS Introduction Factor Analysis is similar to PCA in that it is a technique for studying the interrelationships among variables Both methods differ from regression in that they don t have
Introduction to Multivariate Analysis
 Introduction to Multivariate Analysis Lecture 1 August 24, 2005 Multivariate Analysis Lecture #1-8/24/2005 Slide 1 of 30 Today s Lecture Today s Lecture Syllabus and course overview Chapter 1 (a brief
Quadratic forms Cochran s theorem, degrees of freedom, and all that
 Quadratic forms Cochran s theorem, degrees of freedom, and all that Dr. Frank Wood Frank Wood, [email protected] Linear Regression Models Lecture 1, Slide 1 Why We Care Cochran s theorem tells us
Convolution. 1D Formula: 2D Formula: Example on the web: http://www.jhu.edu/~signals/convolve/
 Basic Filters (7) Convolution/correlation/Linear filtering Gaussian filters Smoothing and noise reduction First derivatives of Gaussian Second derivative of Gaussian: Laplacian Oriented Gaussian filters
Statistical Machine Learning
 Statistical Machine Learning UoC Stats 37700, Winter quarter Lecture 4: classical linear and quadratic discriminants. 1 / 25 Linear separation For two classes in R d : simple idea: separate the classes
Rachel J. Goldberg, Guideline Research/Atlanta, Inc., Duluth, GA
 PROC FACTOR: How to Interpret the Output of a Real-World Example Rachel J. Goldberg, Guideline Research/Atlanta, Inc., Duluth, GA ABSTRACT THE METHOD This paper summarizes a real-world example of a factor
Didacticiel - Études de cas
 1 Topic Linear Discriminant Analysis Data Mining Tools Comparison (Tanagra, R, SAS and SPSS). Linear discriminant analysis is a popular method in domains of statistics, machine learning and pattern recognition.
Multivariate Analysis (Slides 13)
") Multivariate Analysis (Slides 13) The final topic we consider is Factor Analysis. A Factor Analysis is a mathematical approach for attempting to explain the correlation between a large set of variables
Multivariate Analysis (Slides 13) The final topic we consider is Factor Analysis. A Factor Analysis is a mathematical approach for attempting to explain the correlation between a large set of variables
Principal Component Analysis
 Principal Component Analysis ERS70D George Fernandez INTRODUCTION Analysis of multivariate data plays a key role in data analysis. Multivariate data consists of many different attributes or variables recorded
Common factor analysis
 Common factor analysis This is what people generally mean when they say "factor analysis" This family of techniques uses an estimate of common variance among the original variables to generate the factor
Principal components analysis
 CS229 Lecture notes Andrew Ng Part XI Principal components analysis In our discussion of factor analysis, we gave a way to model data x R n as approximately lying in some k-dimension subspace, where k
Factor Analysis. Advanced Financial Accounting II Åbo Akademi School of Business
 Factor Analysis Advanced Financial Accounting II Åbo Akademi School of Business Factor analysis A statistical method used to describe variability among observed variables in terms of fewer unobserved variables
5. Linear Regression
 5. Linear Regression Outline.................................................................... 2 Simple linear regression 3 Linear model............................................................. 4
Multivariate Analysis of Variance. The general purpose of multivariate analysis of variance (MANOVA) is to determine
 is to determine") 2 - Manova 4.3.05 25 Multivariate Analysis of Variance What Multivariate Analysis of Variance is The general purpose of multivariate analysis of variance (MANOVA) is to determine whether multiple levels
2 - Manova 4.3.05 25 Multivariate Analysis of Variance What Multivariate Analysis of Variance is The general purpose of multivariate analysis of variance (MANOVA) is to determine whether multiple levels
T-test & factor analysis
 Parametric tests T-test & factor analysis Better than non parametric tests Stringent assumptions More strings attached Assumes population distribution of sample is normal Major problem Alternatives Continue
Association Between Variables
 Contents 11 Association Between Variables 767 11.1 Introduction............................ 767 11.1.1 Measure of Association................. 768 11.1.2 Chapter Summary.................... 769 11.2 Chi
9 Hedging the Risk of an Energy Futures Portfolio UNCORRECTED PROOFS. Carol Alexander 9.1 MAPPING PORTFOLIOS TO CONSTANT MATURITY FUTURES 12 T 1)
") Helyette Geman c0.tex V - 0//0 :00 P.M. Page Hedging the Risk of an Energy Futures Portfolio Carol Alexander This chapter considers a hedging problem for a trader in futures on crude oil, heating oil and
Helyette Geman c0.tex V - 0//0 :00 P.M. Page Hedging the Risk of an Energy Futures Portfolio Carol Alexander This chapter considers a hedging problem for a trader in futures on crude oil, heating oil and
SENSITIVITY ANALYSIS AND INFERENCE. Lecture 12
 This work is licensed under a Creative Commons Attribution-NonCommercial-ShareAlike License. Your use of this material constitutes acceptance of that license and the conditions of use of materials on this
Chapter 7 Factor Analysis SPSS
 Chapter 7 Factor Analysis SPSS Factor analysis attempts to identify underlying variables, or factors, that explain the pattern of correlations within a set of observed variables. Factor analysis is often
Elasticity Theory Basics
 G22.3033-002: Topics in Computer Graphics: Lecture #7 Geometric Modeling New York University Elasticity Theory Basics Lecture #7: 20 October 2003 Lecturer: Denis Zorin Scribe: Adrian Secord, Yotam Gingold
Linear smoother. ŷ = S y. where s ij = s ij (x) e.g. s ij = diag(l i (x)) To go the other way, you need to diagonalize S
 e.g. s ij = diag(l i (x)) To go the other way, you need to diagonalize S") Linear smoother ŷ = S y where s ij = s ij (x) e.g. s ij = diag(l i (x)) To go the other way, you need to diagonalize S 2 Online Learning: LMS and Perceptrons Partially adapted from slides by Ryan Gabbard
Linear smoother ŷ = S y where s ij = s ij (x) e.g. s ij = diag(l i (x)) To go the other way, you need to diagonalize S 2 Online Learning: LMS and Perceptrons Partially adapted from slides by Ryan Gabbard
Regression III: Advanced Methods
 Lecture 16: Generalized Additive Models Regression III: Advanced Methods Bill Jacoby Michigan State University http://polisci.msu.edu/jacoby/icpsr/regress3 Goals of the Lecture Introduce Additive Models
Regression and Correlation
 Regression and Correlation Topics Covered: Dependent and independent variables. Scatter diagram. Correlation coefficient. Linear Regression line. by Dr.I.Namestnikova 1 Introduction Regression analysis
An introduction to Value-at-Risk Learning Curve September 2003
 An introduction to Value-at-Risk Learning Curve September 2003 Value-at-Risk The introduction of Value-at-Risk (VaR) as an accepted methodology for quantifying market risk is part of the evolution of risk
Session 7 Bivariate Data and Analysis
 Session 7 Bivariate Data and Analysis Key Terms for This Session Previously Introduced mean standard deviation New in This Session association bivariate analysis contingency table co-variation least squares
Chapter 1. Vector autoregressions. 1.1 VARs and the identi cation problem
 Chapter Vector autoregressions We begin by taking a look at the data of macroeconomics. A way to summarize the dynamics of macroeconomic data is to make use of vector autoregressions. VAR models have become
CORRELATION ANALYSIS
 CORRELATION ANALYSIS Learning Objectives Understand how correlation can be used to demonstrate a relationship between two factors. Know how to perform a correlation analysis and calculate the coefficient
HYPOTHESIS TESTING: CONFIDENCE INTERVALS, T-TESTS, ANOVAS, AND REGRESSION
 HYPOTHESIS TESTING: CONFIDENCE INTERVALS, T-TESTS, ANOVAS, AND REGRESSION HOD 2990 10 November 2010 Lecture Background This is a lightning speed summary of introductory statistical methods for senior undergraduate
Orthogonal Diagonalization of Symmetric Matrices
 MATH10212 Linear Algebra Brief lecture notes 57 Gram Schmidt Process enables us to find an orthogonal basis of a subspace. Let u 1,..., u k be a basis of a subspace V of R n. We begin the process of finding
Principal Component Analysis
 Principal Component Analysis Principle Component Analysis: A statistical technique used to examine the interrelations among a set of variables in order to identify the underlying structure of those variables.
SPSS Guide: Regression Analysis
 SPSS Guide: Regression Analysis I put this together to give you a step-by-step guide for replicating what we did in the computer lab. It should help you run the tests we covered. The best way to get familiar
Eigenvalues, Eigenvectors, Matrix Factoring, and Principal Components
 Eigenvalues, Eigenvectors, Matrix Factoring, and Principal Components The eigenvalues and eigenvectors of a square matrix play a key role in some important operations in statistics. In particular, they
Chapter 1 Introduction. 1.1 Introduction
 Chapter 1 Introduction 1.1 Introduction 1 1.2 What Is a Monte Carlo Study? 2 1.2.1 Simulating the Rolling of Two Dice 2 1.3 Why Is Monte Carlo Simulation Often Necessary? 4 1.4 What Are Some Typical Situations
Determine If An Equation Represents a Function
 Question : What is a linear function? The term linear function consists of two parts: linear and function. To understand what these terms mean together, we must first understand what a function is. The
Metric Multidimensional Scaling (MDS): Analyzing Distance Matrices
: Analyzing Distance Matrices") Metric Multidimensional Scaling (MDS): Analyzing Distance Matrices Hervé Abdi 1 1 Overview Metric multidimensional scaling (MDS) transforms a distance matrix into a set of coordinates such that the (Euclidean)
Metric Multidimensional Scaling (MDS): Analyzing Distance Matrices Hervé Abdi 1 1 Overview Metric multidimensional scaling (MDS) transforms a distance matrix into a set of coordinates such that the (Euclidean)
Object Recognition and Template Matching
 Object Recognition and Template Matching Template Matching A template is a small image (sub-image) The goal is to find occurrences of this template in a larger image That is, you want to find matches of
MEASURES OF VARIATION
 NORMAL DISTRIBTIONS MEASURES OF VARIATION In statistics, it is important to measure the spread of data. A simple way to measure spread is to find the range. But statisticians want to know if the data are
Multivariate Analysis of Variance (MANOVA): I. Theory
: I. Theory") Gregory Carey, 1998 MANOVA: I - 1 Multivariate Analysis of Variance (MANOVA): I. Theory Introduction The purpose of a t test is to assess the likelihood that the means for two groups are sampled from the
Gregory Carey, 1998 MANOVA: I - 1 Multivariate Analysis of Variance (MANOVA): I. Theory Introduction The purpose of a t test is to assess the likelihood that the means for two groups are sampled from the
Section 14 Simple Linear Regression: Introduction to Least Squares Regression
 Slide 1 Section 14 Simple Linear Regression: Introduction to Least Squares Regression There are several different measures of statistical association used for understanding the quantitative relationship
Factor Analysis. Factor Analysis
 Factor Analysis Principal Components Analysis, e.g. of stock price movements, sometimes suggests that several variables may be responding to a small number of underlying forces. In the factor model, we
Sections 2.11 and 5.8
 Sections 211 and 58 Timothy Hanson Department of Statistics, University of South Carolina Stat 704: Data Analysis I 1/25 Gesell data Let X be the age in in months a child speaks his/her first word and
Lecture 3: Linear methods for classification
 Lecture 3: Linear methods for classification Rafael A. Irizarry and Hector Corrada Bravo February, 2010 Today we describe four specific algorithms useful for classification problems: linear regression,
Exploratory Factor Analysis and Principal Components. Pekka Malo & Anton Frantsev 30E00500 Quantitative Empirical Research Spring 2016
 and Principal Components Pekka Malo & Anton Frantsev 30E00500 Quantitative Empirical Research Spring 2016 Agenda Brief History and Introductory Example Factor Model Factor Equation Estimation of Loadings
4. Matrix Methods for Analysis of Structure in Data Sets:
 ATM 552 Notes: Matrix Methods: EOF, SVD, ETC. D.L.Hartmann Page 64 4. Matrix Methods for Analysis of Structure in Data Sets: Empirical Orthogonal Functions, Principal Component Analysis, Singular Value
Canonical Correlation Analysis
 Canonical Correlation Analysis LEARNING OBJECTIVES Upon completing this chapter, you should be able to do the following: State the similarities and differences between multiple regression, factor analysis,
Unit 31 A Hypothesis Test about Correlation and Slope in a Simple Linear Regression
 Unit 31 A Hypothesis Test about Correlation and Slope in a Simple Linear Regression Objectives: To perform a hypothesis test concerning the slope of a least squares line To recognize that testing for a
Factoring Trinomials of the Form x 2 bx c
 4.2 Factoring Trinomials of the Form x 2 bx c 4.2 OBJECTIVES 1. Factor a trinomial of the form x 2 bx c 2. Factor a trinomial containing a common factor NOTE The process used to factor here is frequently
October 3rd, 2012. Linear Algebra & Properties of the Covariance Matrix
 Linear Algebra & Properties of the Covariance Matrix October 3rd, 2012 Estimation of r and C Let rn 1, rn, t..., rn T be the historical return rates on the n th asset. rn 1 rṇ 2 r n =. r T n n = 1, 2,...,
Lecture 5: Singular Value Decomposition SVD (1)
") EEM3L1: Numerical and Analytical Techniques Lecture 5: Singular Value Decomposition SVD (1) EE3L1, slide 1, Version 4: 25-Sep-02 Motivation for SVD (1) SVD = Singular Value Decomposition Consider the system
EEM3L1: Numerical and Analytical Techniques Lecture 5: Singular Value Decomposition SVD (1) EE3L1, slide 1, Version 4: 25-Sep-02 Motivation for SVD (1) SVD = Singular Value Decomposition Consider the system
An Introduction to Path Analysis. nach 3
 An Introduction to Path Analysis Developed by Sewall Wright, path analysis is a method employed to determine whether or not a multivariate set of nonexperimental data fits well with a particular (a priori)
Ridge Regression. Patrick Breheny. September 1. Ridge regression Selection of λ Ridge regression in R/SAS
 Ridge Regression Patrick Breheny September 1 Patrick Breheny BST 764: Applied Statistical Modeling 1/22 Ridge regression: Definition Definition and solution Properties As mentioned in the previous lecture,
Additional sources Compilation of sources: http://lrs.ed.uiuc.edu/tseportal/datacollectionmethodologies/jin-tselink/tselink.htm
 Mgt 540 Research Methods Data Analysis 1 Additional sources Compilation of sources: http://lrs.ed.uiuc.edu/tseportal/datacollectionmethodologies/jin-tselink/tselink.htm http://web.utk.edu/~dap/random/order/start.htm
Math 265 (Butler) Practice Midterm II B (Solutions)
 Practice Midterm II B (Solutions)") Math 265 (Butler) Practice Midterm II B (Solutions) 1. Find (x 0, y 0 ) so that the plane tangent to the surface z f(x, y) x 2 + 3xy y 2 at ( x 0, y 0, f(x 0, y 0 ) ) is parallel to the plane 16x 2y 2z
Math 265 (Butler) Practice Midterm II B (Solutions) 1. Find (x 0, y 0 ) so that the plane tangent to the surface z f(x, y) x 2 + 3xy y 2 at ( x 0, y 0, f(x 0, y 0 ) ) is parallel to the plane 16x 2y 2z
Copyright 2007 by Laura Schultz. All rights reserved. Page 1 of 5
 Using Your TI-83/84 Calculator: Linear Correlation and Regression Elementary Statistics Dr. Laura Schultz This handout describes how to use your calculator for various linear correlation and regression
How to Get More Value from Your Survey Data
 Technical report How to Get More Value from Your Survey Data Discover four advanced analysis techniques that make survey research more effective Table of contents Introduction..............................................................2
Risk Decomposition of Investment Portfolios. Dan dibartolomeo Northfield Webinar January 2014
 Risk Decomposition of Investment Portfolios Dan dibartolomeo Northfield Webinar January 2014 Main Concepts for Today Investment practitioners rely on a decomposition of portfolio risk into factors to guide
Introduction to Matrix Algebra
 Psychology 7291: Multivariate Statistics (Carey) 8/27/98 Matrix Algebra - 1 Introduction to Matrix Algebra Definitions: A matrix is a collection of numbers ordered by rows and columns. It is customary
Optimal linear-quadratic control
 Optimal linear-quadratic control Martin Ellison 1 Motivation The lectures so far have described a general method - value function iterations - for solving dynamic programming problems. However, one problem
Factor Analysis Example: SAS program (in blue) and output (in black) interleaved with comments (in red)
 and output (in black) interleaved with comments (in red)") Factor Analysis Example: SAS program (in blue) and output (in black) interleaved with comments (in red) The following DATA procedure is to read input data. This will create a SAS dataset named CORRMATR
Factor Analysis Example: SAS program (in blue) and output (in black) interleaved with comments (in red) The following DATA procedure is to read input data. This will create a SAS dataset named CORRMATR
1 Teaching notes on GMM 1.
 Bent E. Sørensen January 23, 2007 1 Teaching notes on GMM 1. Generalized Method of Moment (GMM) estimation is one of two developments in econometrics in the 80ies that revolutionized empirical work in
Introduction to Fixed Effects Methods
 Introduction to Fixed Effects Methods 1 1.1 The Promise of Fixed Effects for Nonexperimental Research... 1 1.2 The Paired-Comparisons t-test as a Fixed Effects Method... 2 1.3 Costs and Benefits of Fixed
CHAPTER 8 FACTOR EXTRACTION BY MATRIX FACTORING TECHNIQUES. From Exploratory Factor Analysis Ledyard R Tucker and Robert C.
 CHAPTER 8 FACTOR EXTRACTION BY MATRIX FACTORING TECHNIQUES From Exploratory Factor Analysis Ledyard R Tucker and Robert C MacCallum 1997 180 CHAPTER 8 FACTOR EXTRACTION BY MATRIX FACTORING TECHNIQUES In
SAS Code to Select the Best Multiple Linear Regression Model for Multivariate Data Using Information Criteria
 Paper SA01_05 SAS Code to Select the Best Multiple Linear Regression Model for Multivariate Data Using Information Criteria Dennis J. Beal, Science Applications International Corporation, Oak Ridge, TN
Part 2: Analysis of Relationship Between Two Variables
 Part 2: Analysis of Relationship Between Two Variables Linear Regression Linear correlation Significance Tests Multiple regression Linear Regression Y = a X + b Dependent Variable Independent Variable
4. There are no dependent variables specified... Instead, the model is: VAR 1. Or, in terms of basic measurement theory, we could model it as:
 1 Neuendorf Factor Analysis Assumptions: 1. Metric (interval/ratio) data 2. Linearity (in the relationships among the variables--factors are linear constructions of the set of variables; the critical source
BEHAVIOR BASED CREDIT CARD FRAUD DETECTION USING SUPPORT VECTOR MACHINES
 BEHAVIOR BASED CREDIT CARD FRAUD DETECTION USING SUPPORT VECTOR MACHINES 123 CHAPTER 7 BEHAVIOR BASED CREDIT CARD FRAUD DETECTION USING SUPPORT VECTOR MACHINES 7.1 Introduction Even though using SVM presents
Pearson s Correlation
 Pearson s Correlation Correlation the degree to which two variables are associated (co-vary). Covariance may be either positive or negative. Its magnitude depends on the units of measurement. Assumes the
Imputing Missing Data using SAS
 ABSTRACT Paper 3295-2015 Imputing Missing Data using SAS Christopher Yim, California Polytechnic State University, San Luis Obispo Missing data is an unfortunate reality of statistics. However, there are
Lesson 1: Comparison of Population Means Part c: Comparison of Two- Means
 Lesson : Comparison of Population Means Part c: Comparison of Two- Means Welcome to lesson c. This third lesson of lesson will discuss hypothesis testing for two independent means. Steps in Hypothesis
3.1 Solving Systems Using Tables and Graphs
 Algebra 2 Chapter 3 3.1 Solve Systems Using Tables & Graphs 3.1 Solving Systems Using Tables and Graphs A solution to a system of linear equations is an that makes all of the equations. To solve a system
Goodness of fit assessment of item response theory models
 Goodness of fit assessment of item response theory models Alberto Maydeu Olivares University of Barcelona Madrid November 1, 014 Outline Introduction Overall goodness of fit testing Two examples Assessing
Multivariate Analysis. Overview
 Multivariate Analysis Overview Introduction Multivariate thinking Body of thought processes that illuminate the interrelatedness between and within sets of variables. The essence of multivariate thinking