Lecture 3: Linear methods for classification
|
|
|
- Cory Barber
- 8 years ago
- Views:
Transcription
1 Lecture 3: Linear methods for classification Rafael A. Irizarry and Hector Corrada Bravo February, 2010 Today we describe four specific algorithms useful for classification problems: linear regression, linear discriminant analysis, logistic regression and separating hyperplanes. Introduction We now revisit the classification problem and concentrate on linear methods. Recall that our setting is that we observe for subject i predictors (covariates) x i, and qualitative outcomes (or classes) g i, which can takes values from a discrete set G. Since our prediction Ĝ(x) will always take values in the discrete set G, we can always divide the input space into a collection of regions taking the same predicted values. The question is: what is the best sub-division of this space? We saw previously that the boundaries can be smooth or rough depending on the prediction function. For an important class of procedures, these decision boundaries are linear. This is what we will refer to as linear methods for classification. We will see that these can be quite flexible (much more than linear regression). Suppose we have K classes labeled 1,..., K and a single predictior X. We can define a 0 1 indicator for each class k, and perform regression for each of these. We would end up with a regression function f k (x) = ˆβ 0k + ˆβ 1k x for each class k. The decision boundary between class k and l is simply the set for which ˆf k (x) = ˆf l (x), i.e., {x : ˆβ 0k + ˆβ 1k x = ˆβ 0l + ˆβ 1l x} which is a hyperplane. Since the same holds for any pair of classes, the division of the input space is piecewise linear. 1
 x i, and qualitative outcomes (or classes) g i, which can takes values from a discrete set G.")
2 2

3 This regression approach is one of a number of methods that model a discriminant function δ k (x) for each class, and classifies X to the class with the largest value of the discriminant function. Methods that model the posterior probability P r(g = k X = x) are also in this class. If this is a linear function of x then we say it is linear. Furthermore, if it is a monotone transform of a linear function of x, we will sometimes say it is linear. An example is logistic regression. More on that later. Both decision boundaries shown in the next Figure are linear: one obtained with linear regression, the other using quadratic terms. Linear regression of an indicator matrix Each response is coded as a vector of 0 1 entries. If G has K classes, then Y k for k = 1,..., K is such that Y k = 1, if G = k and 0 otherwise. These are collected in a vector Y = (Y 1,..., Y k ) and the N training vectors are collected in an N K matrix, we denote by Y. For example, if we have K = 5 classes On the left is the original data, and on the right, the coded data. To fit with regression to each class simulatneously, we can simply use the same matrix multiplication trick Ŷ = X(X X) 1 X Y 3

4 Notice the matrix ˆB = (X X) 1 X Y has the coefficients for each regression in the columns. So, for any point x we can get the prediction by compute the fitted output ˆf(x) = [(1, x) ˆB], a K vector identify the largest component, and classify accordingly Ĝ(x) = arg max k G What is the rationale for this approach? ˆf k (x) Recall the expected prediction error we discussed last time. What do we do for qualitative data? Because the elements of G are not numbers, taking expectations doesn t mean anything. However, we can define a loss function. Say we have three elements G = {A, B, C}, we can define the loss function like this: L(Ĝ, G) = { 0 if Ĝ = G 1 if Ĝ G This can be thought of as a distance matrix with 0s in the diagonals and 1s everywhere else. Notice that in some applications this loss function may not be appropriate. For instance, saying someone has cancer when they don t is not as bad as saying they don t have cancer when they actually do. For now, let s stick to 1 and 0. We can now write EP E = E X K k=1 L(G k, Ĝ(X))P r(g = k X) The minimizer of EPE is known as the Bayes classifier, or Bayes decision rule. Ĝ(X) = max P r(g X = x) g G So, why don t we use it? Typically we don t know P r(g X = x), just like in the regression setting we don t know f(x) = E[Y X = x]. Note: If we simulate data like we do below, then we can compute the Bayes decision rule since we know P r(g X = x). 4

5 Note: If we use the encoding 0/1 encoding above for the two-class case, then we see the relationship between the Bayes classifier and the regression function since P r(g = g X = x) = E(Y X = x) in this case. The real issue here is, how good is the linear approximation here? Alternatively, are the ˆf k (x) good estimates of P r(g = k X = x). We know they are not great since we know ˆf(x) can be greater than 1 or less than 0. However, as we have discussed, this may not matter if we get good predictions. A more conventional way of fitting this model is by defining target t k as the vector with a 1 in the kth entry and 0 otherwise, such that y i = t k if g i = k. Then the above approach is equivalent to minimizing min B N y i {(1, x i )B} 2. i=1 A new observation is classified by computing ˆf(x) and choosing the closes target arg min k ˆf(x) t k 2 Because of the rigid nature of linear regression, a problem arises for linear regression with K >= 3. The next figure shows an extreme situation. Notice that decision boundaries can be formed by eye to perfectly discriminate the three classes. However, the decision boundaries from linear regression do not do well. Why does linear regression miss the classification in this case? Notice that the best direction to separate these data is a line going through the centroids of the data. Notice there is no information in the projection orthogonal to this one. 5

6 If we then regress Y on the transformed X, then there is barely any information about the second class. This is seen clearly in the left panel of the next Figure. However, by making the regression function a bit more flexible, we can do a bit better. One way to do this is to use quadratic terms (there are 3, what are they?) In the last two Figures, this linear regression version including quadratic terms does much better. However, if we increase the number of classes to K = 4 we would then need to start adding the cubic terms and now are dealing with lots of variables. A data set we may be working on later will be vowel sound data. The next Figure contains a plot of the first 2 coordinates and the classes. Linear Discriminant Analysis Decision theory tells us that we should know the class posteriors P r(g X = x) for optimal classification. Suppose f k (x) is the class conditional density of X in class G = k, and let π k be the prior probability of class k, with K k=1 π k = 1. A simple application of Bayes theorem gives us P r(g = k X = x) = f k(x)π k K l=1 f l(x)π l Notice that havign quantities f k (x) is almost equivalent to having the P r(g = k X = x) provided by Bayes rule. Suppose we model each class conditional density as multivariate Gaussian: f k (x) = 1 (2π) p/2 Σ k 1 1/2 exp{ 1 2 (x µ k) Σ k 1 (x µ k ). 6

7 7

8 The next Figure shows regions that contain 95% of the data for three bivariate distributions with different means, but the same covariance structure. The covariance structure make these ellipses rather than circles. The lines are the Bayes decision rules. Linear Discriminant Analysis (LDA) arises when we assume that the covariance is the same for all classes. In this case, we see that discriminant functions are simply δ k (x) = x Σ 1 µ k 1 2 µ kσ 1 µ k + log π k Notice: if we assume π k = 1/K then the last term is not needed. In any case, notice this is a linear function of x!. In practice, we do not have the means µ k or the covariance structure Σ. The strategy is to use training data to estimate these. In the next figure we see some outcomes in a three class simulation. The distributions used to create them are those shown on the left panel. The Bayes decision rules are shown dashed and the estimated LDA discrimant functions are shown as solid lines. To estimate the parameters we simply: ˆπ k = N k N, where N k is the observed number of subjects in class k ˆµ k = 1 N k g i=k x i ˆΣ = 1 K N K k=1 g (x i=k i ˆµ k )(x i ˆµ k ) Technical note: for two classes LDA is almost the same as regression, the coefficients of each are proportional, but unless N 1 = N 2 the intercepts are different. 8
 = x Σ 1 µ k 1 2 µ kσ 1 µ k + log π k Notice: if we assume π k = 1/K then the last term is not needed.")
9 If we assume that each class has its own correlation structure, the discriminant functions are no longer linear. Instead, we get δ k (x) = 1 2 log Σ k (x µ k) Σ 1 k (x µ k) The decision boundary is now described with a quadratic function. This is therefore called quadratic discriminant analysis (QDA). Next we plot LDA and QDA decision boundaries for the same data. Note: when the number of covariates grow, the number of things to estimate in the covariance matrix gets very large. One needs to be careful. Computations for LDA and QDA Suppose we compute the eigen-decomposition of each ˆΣ k = U k D k U k, where U k is a p p matrix with orthonormal columns and D k is a diagonal matrix of positive eigenvalues d kl. The ingredients for δ k (x) are: (x ˆµ k ) Σ 1 k (x ˆµ k) = [U k (x ˆµ k) ]D 1 k [(x ˆµ k)u k ] 9

10 log Σ k 1 = l log d kl Notice this is much easier to compute since D k is a diagonal matrix! Given this, we can now compute and interpret the LDA classifier as follows: Sphere the data with respect to the common covariance estimate ˆΣ to get X = D 1/2 U X. The common covariance estimate of X is now the identity matrix! Classify to the closes class centroid (µ k s) in the transformed space, correcting for the effect of the class prior probabilities π k. Section of Hastie, Tibshirani and Friedman, has a nice discussion of how LDA is related to the solution of the problem: find the linear combination Z = a X such that the between-class variance is maximized relative to the withinclass variance. Logistic regression Assume P r(g = 1 X = x) log P r(g = K X = x) = P r(g = 2 X = x) log P r(g = K X = x) = β 10 + β 1x β 20 + β 2x log Notice g(p) = log P r(g = K 1 X = x) P r(g = K X = x) p 1 p A simple calculation gives. = β (K 1)0 + β K 1x. is the logistic link and is g : (0, 1) R. exp(β k0 + β k P r(g = k X = x) = x) 1 + K 1 l=1 exp(β k = 1,..., K 1, l0 + β l x), 1 P r(g = K X = x) = 1 + K 1 l=1 exp(β l0 + β l x) When K = 2 this has a very simple form (only one set of covariates) and is a very popular model used in biostatistical applications. With this probability model we can now write the log-likelihood 10

11 N l(θ) = log p gi (x i ; θ) i=1 where p gi (x i ; θ) = P r(g = k X = x; θ). In the two-class case, use y i = 1 for g i = 1 and y i = 0 for g i = 2; let p 1 (x i ; θ) = p(x i ; θ), so p 2 (x i ; θ) = 1 p(x i ; θ). The log-likelihood is then l(β) = = N {y i log p(x i ; β) + (1 y i ) log(1 p(x i ; β))} i=1 N i=1 { } y i β x i log(1 + e β x i ) Our estimate of β will be the maximum likelihood estimate (MLE), obtained by maximizing the log-likelihood with respect to β. We do this by setting the partial derivatives of the log-likelihood to zero: l(β) β N = x i (y i p(x i ; β)) = 0 i=1 This results in a nonlinear system of p + 1 equations. These are also called the score equations. Notice that for the intercept (x 0 = 1), its score equation ( N i=1 y i = i=1 p(x i; β) states that for β to be an MLE solution, the expected number of observations in class 1, must match the observed number of observations. To solve the set of score equations, we can use the Newton-Raphson method, which starting from an initial guess β old iteratively updates the estimate using: β new β old ( 2 ) 1 l(β) l(β) β β β, with derivatives evaluated at β old. The matrix of second derivatives (Hessian matrix) is given by 2 l(β) β β = N x i x ip(x i ; β)(1 p(x i ; β)). i=1 By writing the gradient and Hessian in matrix notation, we can see a neat byproduct of using the Newton method in this case. The gradient and Hessian are given by 11

12 l(β) β = X (y p) 2 l(β) β β = X WX where vector y is the vector of y i values, X the N (p + 1) matrix of x i values, p the vector of fitted probabilities and W a N N diagonal matrix with ith entry p(x i ; β)(1 p(x i ; β)). With this we can rewrite the Newton update as β new = β old + (X XW) 1 X (y p) = (X XW) 1 X W(Xβ old + W 1 (y p)) Introducing notation z = Xβ old + W 1 (y p), we can see that the Newton update is the solution to a weighted least squares problem β new arg min(z Xβ) W(z Xβ) β This connection to least squares also gives us the following: The weighted residual-sum-of-squares is the Pearson chi-square statistic N i=1 (y i ˆp i ) 2 ˆp i (1 ˆp i ) a quadratic approximation to the deviance Asymptotic likelihood theory says that if the model is correct then ˆβ converges to the true β. A CLT then shows that the distribution of ˆβ converges to N(β, (X WX) 1 ) Logistic regression versus LDA Notice logistic regression provides a similar solution to LDA. Using Bayes theory we can show that log P r(g = k X = x) P r(g = K X = x) = log π k π K 1 2 (µ k +µ K ) Σ 1 (µ k µ K )+x Σ 1 (µ k µ K ) 12
 W(z Xβ) β This connection to least squares also gives us the following: The weighted residual-sum-of-squares is the Pearson chi-square")
13 which can be re-written as log P r(g = k X = x) P r(g = K X = x) = α 0k + α kx. For logistic regression, we explicitly write log P r(g = k X = x) P r(g = K X = x) = β 0k + β kx. The difference comes from how the parameters are estimated. The estimate of the αs assumes that the conditional distribution of x is multivariate Gaussian. Thus, the main difference is that LDA imposes a distributional assumption on X which, if it holds, yields more efficient estimates. Logistic regression is conditional methodology. We condition on X and do not specify a distribution for it. This presents a big advantage in cases where we know X can not be normal, e.g. categorical variables. However, many times in practice both methods perform similarly. extreme cases with categorical variables. Even in Separating hyperplanes So far we have seen methods that use a probabilistic argument to estimate parameters. For example, in LDA we assume the class conditional density is Gaussian and find maximum likelihood estimates. In this section, we look at methods that make no probabilistic arguments, but instead rely entirely on geometric arguments. In all of the linear classification we have seen, we are looking for discriminant functions that are linear with respect to the covariates X 1,..., X p. In p-dimensional space R p these are described by vectors β. The decision boundary is thus L = {x : β x = 0}. Technical note: The literature on separating hyperplanes traditionally uses w (they call it a weight vector) in place of β. Notice that this boundary partitions the input space into two sets on each side of the line. If we restrict estimates to those for which β β = β 2 = 1, then the signed distance of any point x to the decision boundary L is β x. With this we can easily describe the two partitions as 13

14 14
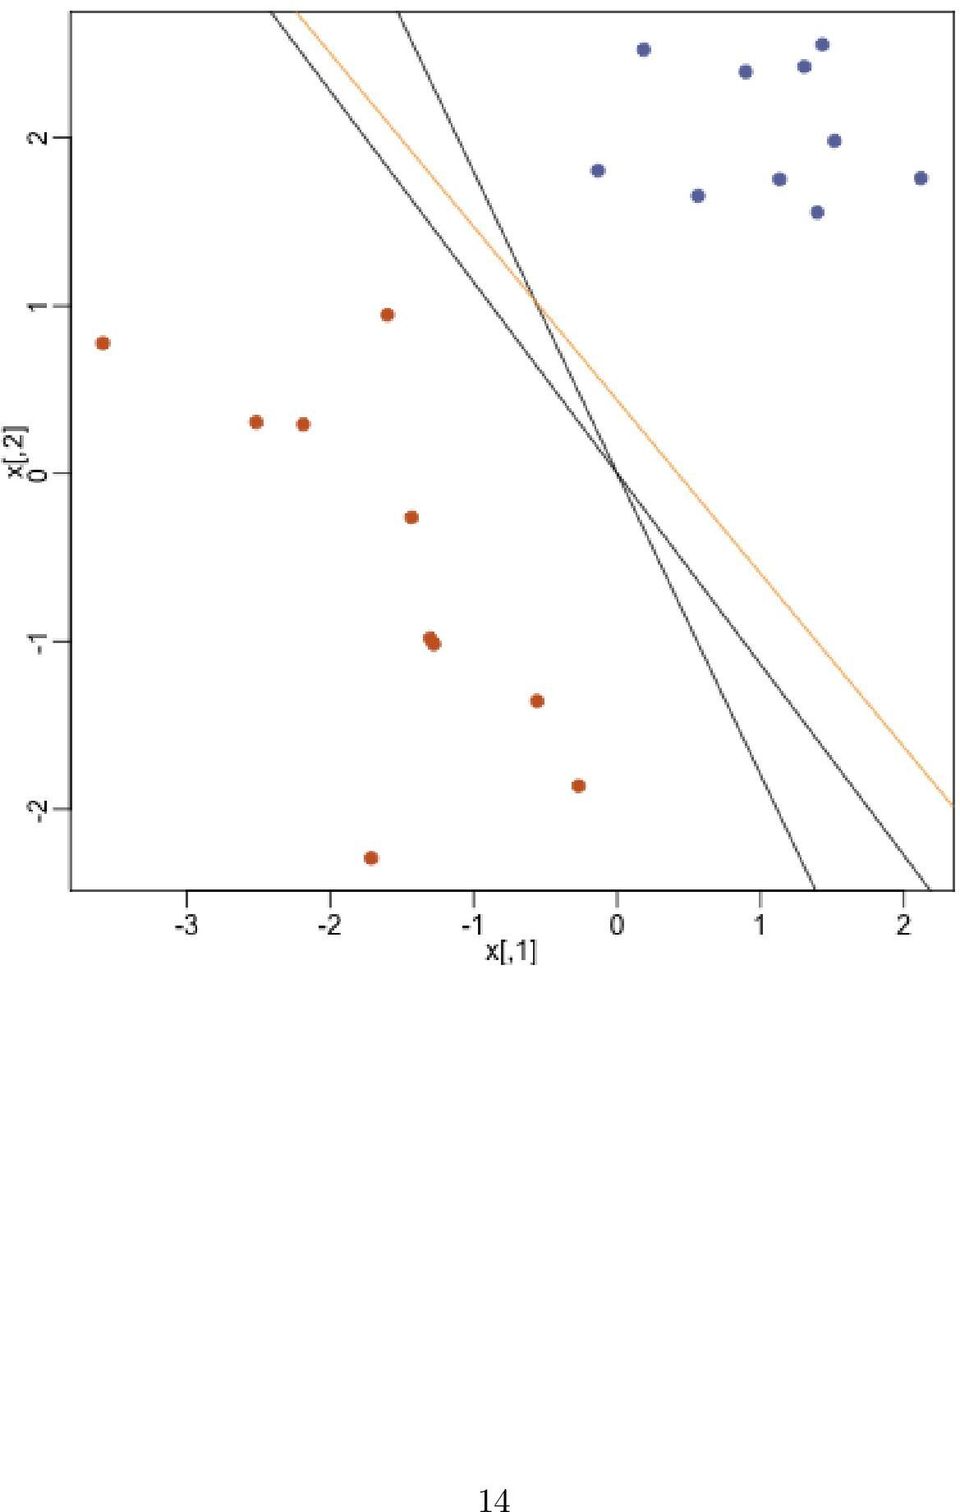
15 L + = {x : β x > 0}, L = {x : β x < 0} Intuitively, the β we want as an estimate is one that separates the training data as perfectly as possible. If we code our classes as y = 1 if g = 1 and y = +1 if g = 2, we can describe our intuitive requirement for estimate β as: y i (x β) > 0, i = 1,..., N Rosenblatt s algorithm Rosenblatt s algorithm is one way of finding a vector β that satisfies the separation requirement as much as possible. The goal is to penalize β by how far into the wrong side misclassified points are: D(β) = i M y i x β where M is the set points misclassified (on the wrong side of the line) by β. Thus, we estimate β by minimizing D. Assuming M is constant, the gradient of D is D(β) β = i M y i x i Rosenblatt s algorithm uses stochastic gradient descent: 1. Initialize β 2. Cycle through training points i, if it is misclassified, update β as β β + ρy i x i 3. Stop when converged (or get tired of waiting) Parameter ρ is used to control how much we update β in each step. There are a few problems with this algorithm: When the data are separable, i.e. there exists a β that separates the training points perfectly, then there are an infinite number of βs that also separate the data perfectly 15
 = i M y i x β where M is the set points misclassified (on the wrong side of the line) by β.")
16 Although this algorithm will converge in a finite number of steps if the training data is separable, the number of finite steps can be very large When the training data is not separable, the algorithm will not converge. In a future lecture we will discuss Support Vector Machines (SVMs) which are based on addressing these problems. For example, when the data are separable, SVMs will choose among the infinite number of βs that separate the data perfectly, a single optimal β that maximizes the distance between the decision boundary and the closest point in each class. Why is this a good idea? 16

Logistic Regression. Jia Li. Department of Statistics The Pennsylvania State University. Logistic Regression
 Logistic Regression Department of Statistics The Pennsylvania State University Email: jiali@stat.psu.edu Logistic Regression Preserve linear classification boundaries. By the Bayes rule: Ĝ(x) = arg max
Statistical Machine Learning
 Statistical Machine Learning UoC Stats 37700, Winter quarter Lecture 4: classical linear and quadratic discriminants. 1 / 25 Linear separation For two classes in R d : simple idea: separate the classes
Example: Credit card default, we may be more interested in predicting the probabilty of a default than classifying individuals as default or not.
 Statistical Learning: Chapter 4 Classification 4.1 Introduction Supervised learning with a categorical (Qualitative) response Notation: - Feature vector X, - qualitative response Y, taking values in C
These slides follow closely the (English) course textbook Pattern Recognition and Machine Learning by Christopher Bishop
 course textbook Pattern Recognition and Machine Learning by Christopher Bishop") Music and Machine Learning (IFT6080 Winter 08) Prof. Douglas Eck, Université de Montréal These slides follow closely the (English) course textbook Pattern Recognition and Machine Learning by Christopher
Music and Machine Learning (IFT6080 Winter 08) Prof. Douglas Eck, Université de Montréal These slides follow closely the (English) course textbook Pattern Recognition and Machine Learning by Christopher
PATTERN RECOGNITION AND MACHINE LEARNING CHAPTER 4: LINEAR MODELS FOR CLASSIFICATION
 PATTERN RECOGNITION AND MACHINE LEARNING CHAPTER 4: LINEAR MODELS FOR CLASSIFICATION Introduction In the previous chapter, we explored a class of regression models having particularly simple analytical
Linear Threshold Units
 Linear Threshold Units w x hx (... w n x n w We assume that each feature x j and each weight w j is a real number (we will relax this later) We will study three different algorithms for learning linear
CS 688 Pattern Recognition Lecture 4. Linear Models for Classification
 CS 688 Pattern Recognition Lecture 4 Linear Models for Classification Probabilistic generative models Probabilistic discriminative models 1 Generative Approach ( x ) p C k p( C k ) Ck p ( ) ( x Ck ) p(
Wes, Delaram, and Emily MA751. Exercise 4.5. 1 p(x; β) = [1 p(xi ; β)] = 1 p(x. y i [βx i ] log [1 + exp {βx i }].
![Wes, Delaram, and Emily MA751. Exercise 4.5. 1 p(x; β) = [1 p(xi ; β)] = 1 p(x. y i [βx i ] log [1 + exp {βx i }].](/thumbs/30/14087801.jpg "Wes, Delaram, and Emily MA751. Exercise 4.5. 1 p(x; β) = [1 p(xi ; β)] = 1 p(x. y i [βx i ] log [1 + exp {βx i }].") Wes, Delaram, and Emily MA75 Exercise 4.5 Consider a two-class logistic regression problem with x R. Characterize the maximum-likelihood estimates of the slope and intercept parameter if the sample for
Wes, Delaram, and Emily MA75 Exercise 4.5 Consider a two-class logistic regression problem with x R. Characterize the maximum-likelihood estimates of the slope and intercept parameter if the sample for
Linear Classification. Volker Tresp Summer 2015
 Linear Classification Volker Tresp Summer 2015 1 Classification Classification is the central task of pattern recognition Sensors supply information about an object: to which class do the object belong
CSCI567 Machine Learning (Fall 2014)
") CSCI567 Machine Learning (Fall 2014) Drs. Sha & Liu {feisha,yanliu.cs}@usc.edu September 22, 2014 Drs. Sha & Liu ({feisha,yanliu.cs}@usc.edu) CSCI567 Machine Learning (Fall 2014) September 22, 2014 1 /
CSCI567 Machine Learning (Fall 2014) Drs. Sha & Liu {feisha,yanliu.cs}@usc.edu September 22, 2014 Drs. Sha & Liu ({feisha,yanliu.cs}@usc.edu) CSCI567 Machine Learning (Fall 2014) September 22, 2014 1 /
Machine Learning and Pattern Recognition Logistic Regression
 Machine Learning and Pattern Recognition Logistic Regression Course Lecturer:Amos J Storkey Institute for Adaptive and Neural Computation School of Informatics University of Edinburgh Crichton Street,
Pattern Analysis. Logistic Regression. 12. Mai 2009. Joachim Hornegger. Chair of Pattern Recognition Erlangen University
 Pattern Analysis Logistic Regression 12. Mai 2009 Joachim Hornegger Chair of Pattern Recognition Erlangen University Pattern Analysis 2 / 43 1 Logistic Regression Posteriors and the Logistic Function Decision
STA 4273H: Statistical Machine Learning
 STA 4273H: Statistical Machine Learning Russ Salakhutdinov Department of Statistics! rsalakhu@utstat.toronto.edu! http://www.cs.toronto.edu/~rsalakhu/ Lecture 6 Three Approaches to Classification Construct
LOGISTIC REGRESSION. Nitin R Patel. where the dependent variable, y, is binary (for convenience we often code these values as
 LOGISTIC REGRESSION Nitin R Patel Logistic regression extends the ideas of multiple linear regression to the situation where the dependent variable, y, is binary (for convenience we often code these values
Classification by Pairwise Coupling
 Classification by Pairwise Coupling TREVOR HASTIE * Stanford University and ROBERT TIBSHIRANI t University of Toronto Abstract We discuss a strategy for polychotomous classification that involves estimating
Least Squares Estimation
 Least Squares Estimation SARA A VAN DE GEER Volume 2, pp 1041 1045 in Encyclopedia of Statistics in Behavioral Science ISBN-13: 978-0-470-86080-9 ISBN-10: 0-470-86080-4 Editors Brian S Everitt & David
Logistic Regression. Vibhav Gogate The University of Texas at Dallas. Some Slides from Carlos Guestrin, Luke Zettlemoyer and Dan Weld.
 Logistic Regression Vibhav Gogate The University of Texas at Dallas Some Slides from Carlos Guestrin, Luke Zettlemoyer and Dan Weld. Generative vs. Discriminative Classifiers Want to Learn: h:x Y X features
Probabilistic Linear Classification: Logistic Regression. Piyush Rai IIT Kanpur
 Probabilistic Linear Classification: Logistic Regression Piyush Rai IIT Kanpur Probabilistic Machine Learning (CS772A) Jan 18, 2016 Probabilistic Machine Learning (CS772A) Probabilistic Linear Classification:
Lecture 9: Introduction to Pattern Analysis
 Lecture 9: Introduction to Pattern Analysis g Features, patterns and classifiers g Components of a PR system g An example g Probability definitions g Bayes Theorem g Gaussian densities Features, patterns
Econometrics Simple Linear Regression
 Econometrics Simple Linear Regression Burcu Eke UC3M Linear equations with one variable Recall what a linear equation is: y = b 0 + b 1 x is a linear equation with one variable, or equivalently, a straight
Lecture 8 February 4
 ICS273A: Machine Learning Winter 2008 Lecture 8 February 4 Scribe: Carlos Agell (Student) Lecturer: Deva Ramanan 8.1 Neural Nets 8.1.1 Logistic Regression Recall the logistic function: g(x) = 1 1 + e θt
Classification Problems
 Classification Read Chapter 4 in the text by Bishop, except omit Sections 4.1.6, 4.1.7, 4.2.4, 4.3.3, 4.3.5, 4.3.6, 4.4, and 4.5. Also, review sections 1.5.1, 1.5.2, 1.5.3, and 1.5.4. Classification Problems
Pa8ern Recogni6on. and Machine Learning. Chapter 4: Linear Models for Classifica6on
 Pa8ern Recogni6on and Machine Learning Chapter 4: Linear Models for Classifica6on Represen'ng the target values for classifica'on If there are only two classes, we typically use a single real valued output
Introduction to General and Generalized Linear Models
 Introduction to General and Generalized Linear Models General Linear Models - part I Henrik Madsen Poul Thyregod Informatics and Mathematical Modelling Technical University of Denmark DK-2800 Kgs. Lyngby
Multivariate Normal Distribution
 Multivariate Normal Distribution Lecture 4 July 21, 2011 Advanced Multivariate Statistical Methods ICPSR Summer Session #2 Lecture #4-7/21/2011 Slide 1 of 41 Last Time Matrices and vectors Eigenvalues
Logistic Regression (1/24/13)
") STA63/CBB540: Statistical methods in computational biology Logistic Regression (/24/3) Lecturer: Barbara Engelhardt Scribe: Dinesh Manandhar Introduction Logistic regression is model for regression used
STA63/CBB540: Statistical methods in computational biology Logistic Regression (/24/3) Lecturer: Barbara Engelhardt Scribe: Dinesh Manandhar Introduction Logistic regression is model for regression used
Christfried Webers. Canberra February June 2015
 c Statistical Group and College of Engineering and Computer Science Canberra February June (Many figures from C. M. Bishop, "Pattern Recognition and ") 1of 829 c Part VIII Linear Classification 2 Logistic
Linear Models for Classification
 Linear Models for Classification Sumeet Agarwal, EEL709 (Most figures from Bishop, PRML) Approaches to classification Discriminant function: Directly assigns each data point x to a particular class Ci
Penalized Logistic Regression and Classification of Microarray Data
 Penalized Logistic Regression and Classification of Microarray Data Milan, May 2003 Anestis Antoniadis Laboratoire IMAG-LMC University Joseph Fourier Grenoble, France Penalized Logistic Regression andclassification
MACHINE LEARNING IN HIGH ENERGY PHYSICS
 MACHINE LEARNING IN HIGH ENERGY PHYSICS LECTURE #1 Alex Rogozhnikov, 2015 INTRO NOTES 4 days two lectures, two practice seminars every day this is introductory track to machine learning kaggle competition!
An Introduction to Machine Learning
 An Introduction to Machine Learning L5: Novelty Detection and Regression Alexander J. Smola Statistical Machine Learning Program Canberra, ACT 0200 Australia Alex.Smola@nicta.com.au Tata Institute, Pune,
i=1 In practice, the natural logarithm of the likelihood function, called the log-likelihood function and denoted by
 Statistics 580 Maximum Likelihood Estimation Introduction Let y (y 1, y 2,..., y n be a vector of iid, random variables from one of a family of distributions on R n and indexed by a p-dimensional parameter
Nominal and ordinal logistic regression
 Nominal and ordinal logistic regression April 26 Nominal and ordinal logistic regression Our goal for today is to briefly go over ways to extend the logistic regression model to the case where the outcome
11 Linear and Quadratic Discriminant Analysis, Logistic Regression, and Partial Least Squares Regression
 Frank C Porter and Ilya Narsky: Statistical Analysis Techniques in Particle Physics Chap. c11 2013/9/9 page 221 le-tex 221 11 Linear and Quadratic Discriminant Analysis, Logistic Regression, and Partial
Linear Discrimination. Linear Discrimination. Linear Discrimination. Linearly Separable Systems Pairwise Separation. Steven J Zeil.
 Steven J Zeil Old Dominion Univ. Fall 200 Discriminant-Based Classification Linearly Separable Systems Pairwise Separation 2 Posteriors 3 Logistic Discrimination 2 Discriminant-Based Classification Likelihood-based:
Exact Inference for Gaussian Process Regression in case of Big Data with the Cartesian Product Structure
 Exact Inference for Gaussian Process Regression in case of Big Data with the Cartesian Product Structure Belyaev Mikhail 1,2,3, Burnaev Evgeny 1,2,3, Kapushev Yermek 1,2 1 Institute for Information Transmission
Spatial Statistics Chapter 3 Basics of areal data and areal data modeling
 Spatial Statistics Chapter 3 Basics of areal data and areal data modeling Recall areal data also known as lattice data are data Y (s), s D where D is a discrete index set. This usually corresponds to data
Reject Inference in Credit Scoring. Jie-Men Mok
 Reject Inference in Credit Scoring Jie-Men Mok BMI paper January 2009 ii Preface In the Master programme of Business Mathematics and Informatics (BMI), it is required to perform research on a business
Poisson Models for Count Data
 Chapter 4 Poisson Models for Count Data In this chapter we study log-linear models for count data under the assumption of a Poisson error structure. These models have many applications, not only to the
Class #6: Non-linear classification. ML4Bio 2012 February 17 th, 2012 Quaid Morris
 Class #6: Non-linear classification ML4Bio 2012 February 17 th, 2012 Quaid Morris 1 Module #: Title of Module 2 Review Overview Linear separability Non-linear classification Linear Support Vector Machines
Inner Product Spaces
 Math 571 Inner Product Spaces 1. Preliminaries An inner product space is a vector space V along with a function, called an inner product which associates each pair of vectors u, v with a scalar u, v, and
CCNY. BME I5100: Biomedical Signal Processing. Linear Discrimination. Lucas C. Parra Biomedical Engineering Department City College of New York
 BME I5100: Biomedical Signal Processing Linear Discrimination Lucas C. Parra Biomedical Engineering Department CCNY 1 Schedule Week 1: Introduction Linear, stationary, normal - the stuff biology is not
203.4770: Introduction to Machine Learning Dr. Rita Osadchy
 203.4770: Introduction to Machine Learning Dr. Rita Osadchy 1 Outline 1. About the Course 2. What is Machine Learning? 3. Types of problems and Situations 4. ML Example 2 About the course Course Homepage:
Lecture 6: Logistic Regression
 Lecture 6: CS 194-10, Fall 2011 Laurent El Ghaoui EECS Department UC Berkeley September 13, 2011 Outline Outline Classification task Data : X = [x 1,..., x m]: a n m matrix of data points in R n. y { 1,
Logit Models for Binary Data
 Chapter 3 Logit Models for Binary Data We now turn our attention to regression models for dichotomous data, including logistic regression and probit analysis. These models are appropriate when the response
3F3: Signal and Pattern Processing
 3F3: Signal and Pattern Processing Lecture 3: Classification Zoubin Ghahramani zoubin@eng.cam.ac.uk Department of Engineering University of Cambridge Lent Term Classification We will represent data by
Chapter 13 Introduction to Nonlinear Regression( 非 線 性 迴 歸 )
") Chapter 13 Introduction to Nonlinear Regression( 非 線 性 迴 歸 ) and Neural Networks( 類 神 經 網 路 ) 許 湘 伶 Applied Linear Regression Models (Kutner, Nachtsheim, Neter, Li) hsuhl (NUK) LR Chap 10 1 / 35 13 Examples
Chapter 13 Introduction to Nonlinear Regression( 非 線 性 迴 歸 ) and Neural Networks( 類 神 經 網 路 ) 許 湘 伶 Applied Linear Regression Models (Kutner, Nachtsheim, Neter, Li) hsuhl (NUK) LR Chap 10 1 / 35 13 Examples
Two Topics in Parametric Integration Applied to Stochastic Simulation in Industrial Engineering
 Two Topics in Parametric Integration Applied to Stochastic Simulation in Industrial Engineering Department of Industrial Engineering and Management Sciences Northwestern University September 15th, 2014
Linear smoother. ŷ = S y. where s ij = s ij (x) e.g. s ij = diag(l i (x)) To go the other way, you need to diagonalize S
 e.g. s ij = diag(l i (x)) To go the other way, you need to diagonalize S") Linear smoother ŷ = S y where s ij = s ij (x) e.g. s ij = diag(l i (x)) To go the other way, you need to diagonalize S 2 Online Learning: LMS and Perceptrons Partially adapted from slides by Ryan Gabbard
Linear smoother ŷ = S y where s ij = s ij (x) e.g. s ij = diag(l i (x)) To go the other way, you need to diagonalize S 2 Online Learning: LMS and Perceptrons Partially adapted from slides by Ryan Gabbard
STATISTICA Formula Guide: Logistic Regression. Table of Contents
 : Table of Contents... 1 Overview of Model... 1 Dispersion... 2 Parameterization... 3 Sigma-Restricted Model... 3 Overparameterized Model... 4 Reference Coding... 4 Model Summary (Summary Tab)... 5 Summary
Elements of statistics (MATH0487-1)
") Elements of statistics (MATH0487-1) Prof. Dr. Dr. K. Van Steen University of Liège, Belgium December 10, 2012 Introduction to Statistics Basic Probability Revisited Sampling Exploratory Data Analysis -
Elements of statistics (MATH0487-1) Prof. Dr. Dr. K. Van Steen University of Liège, Belgium December 10, 2012 Introduction to Statistics Basic Probability Revisited Sampling Exploratory Data Analysis -
Maximum Likelihood Estimation
 Math 541: Statistical Theory II Lecturer: Songfeng Zheng Maximum Likelihood Estimation 1 Maximum Likelihood Estimation Maximum likelihood is a relatively simple method of constructing an estimator for
Web-based Supplementary Materials for Bayesian Effect Estimation. Accounting for Adjustment Uncertainty by Chi Wang, Giovanni
 1 Web-based Supplementary Materials for Bayesian Effect Estimation Accounting for Adjustment Uncertainty by Chi Wang, Giovanni Parmigiani, and Francesca Dominici In Web Appendix A, we provide detailed
Machine Learning Big Data using Map Reduce
 Machine Learning Big Data using Map Reduce By Michael Bowles, PhD Where Does Big Data Come From? -Web data (web logs, click histories) -e-commerce applications (purchase histories) -Retail purchase histories
Nonlinear Algebraic Equations. Lectures INF2320 p. 1/88
 Nonlinear Algebraic Equations Lectures INF2320 p. 1/88 Lectures INF2320 p. 2/88 Nonlinear algebraic equations When solving the system u (t) = g(u), u(0) = u 0, (1) with an implicit Euler scheme we have
Statistical Data Mining. Practical Assignment 3 Discriminant Analysis and Decision Trees
 Statistical Data Mining Practical Assignment 3 Discriminant Analysis and Decision Trees In this practical we discuss linear and quadratic discriminant analysis and tree-based classification techniques.
Numerical methods for American options
 Lecture 9 Numerical methods for American options Lecture Notes by Andrzej Palczewski Computational Finance p. 1 American options The holder of an American option has the right to exercise it at any moment
1 Maximum likelihood estimation
 COS 424: Interacting with Data Lecturer: David Blei Lecture #4 Scribes: Wei Ho, Michael Ye February 14, 2008 1 Maximum likelihood estimation 1.1 MLE of a Bernoulli random variable (coin flips) Given N
Factor analysis. Angela Montanari
 Factor analysis Angela Montanari 1 Introduction Factor analysis is a statistical model that allows to explain the correlations between a large number of observed correlated variables through a small number
Effective Linear Discriminant Analysis for High Dimensional, Low Sample Size Data
 Effective Linear Discriant Analysis for High Dimensional, Low Sample Size Data Zhihua Qiao, Lan Zhou and Jianhua Z. Huang Abstract In the so-called high dimensional, low sample size (HDLSS) settings, LDA
THE NUMBER OF GRAPHS AND A RANDOM GRAPH WITH A GIVEN DEGREE SEQUENCE. Alexander Barvinok
 THE NUMBER OF GRAPHS AND A RANDOM GRAPH WITH A GIVEN DEGREE SEQUENCE Alexer Barvinok Papers are available at http://www.math.lsa.umich.edu/ barvinok/papers.html This is a joint work with J.A. Hartigan
Introduction to Logistic Regression
 OpenStax-CNX module: m42090 1 Introduction to Logistic Regression Dan Calderon This work is produced by OpenStax-CNX and licensed under the Creative Commons Attribution License 3.0 Abstract Gives introduction
Fitting Subject-specific Curves to Grouped Longitudinal Data
 Fitting Subject-specific Curves to Grouped Longitudinal Data Djeundje, Viani Heriot-Watt University, Department of Actuarial Mathematics & Statistics Edinburgh, EH14 4AS, UK E-mail: vad5@hw.ac.uk Currie,
Basics of Statistical Machine Learning
 CS761 Spring 2013 Advanced Machine Learning Basics of Statistical Machine Learning Lecturer: Xiaojin Zhu jerryzhu@cs.wisc.edu Modern machine learning is rooted in statistics. You will find many familiar
Variance Reduction. Pricing American Options. Monte Carlo Option Pricing. Delta and Common Random Numbers
 Variance Reduction The statistical efficiency of Monte Carlo simulation can be measured by the variance of its output If this variance can be lowered without changing the expected value, fewer replications
Local classification and local likelihoods
 Local classification and local likelihoods November 18 k-nearest neighbors The idea of local regression can be extended to classification as well The simplest way of doing so is called nearest neighbor
HETEROGENEOUS AGENTS AND AGGREGATE UNCERTAINTY. Daniel Harenberg daniel.harenberg@gmx.de. University of Mannheim. Econ 714, 28.11.
 COMPUTING EQUILIBRIUM WITH HETEROGENEOUS AGENTS AND AGGREGATE UNCERTAINTY (BASED ON KRUEGER AND KUBLER, 2004) Daniel Harenberg daniel.harenberg@gmx.de University of Mannheim Econ 714, 28.11.06 Daniel Harenberg
Data Mining and Data Warehousing. Henryk Maciejewski. Data Mining Predictive modelling: regression
 Data Mining and Data Warehousing Henryk Maciejewski Data Mining Predictive modelling: regression Algorithms for Predictive Modelling Contents Regression Classification Auxiliary topics: Estimation of prediction
Search Taxonomy. Web Search. Search Engine Optimization. Information Retrieval
 Information Retrieval INFO 4300 / CS 4300! Retrieval models Older models» Boolean retrieval» Vector Space model Probabilistic Models» BM25» Language models Web search» Learning to Rank Search Taxonomy!
Lecture 14: GLM Estimation and Logistic Regression
 Lecture 14: GLM Estimation and Logistic Regression Dipankar Bandyopadhyay, Ph.D. BMTRY 711: Analysis of Categorical Data Spring 2011 Division of Biostatistics and Epidemiology Medical University of South
Probabilistic Models for Big Data. Alex Davies and Roger Frigola University of Cambridge 13th February 2014
 Probabilistic Models for Big Data Alex Davies and Roger Frigola University of Cambridge 13th February 2014 The State of Big Data Why probabilistic models for Big Data? 1. If you don t have to worry about
GLM, insurance pricing & big data: paying attention to convergence issues.
 GLM, insurance pricing & big data: paying attention to convergence issues. Michaël NOACK - michael.noack@addactis.com Senior consultant & Manager of ADDACTIS Pricing Copyright 2014 ADDACTIS Worldwide.
Several Views of Support Vector Machines
 Several Views of Support Vector Machines Ryan M. Rifkin Honda Research Institute USA, Inc. Human Intention Understanding Group 2007 Tikhonov Regularization We are considering algorithms of the form min
Efficient Streaming Classification Methods
 1/44 Efficient Streaming Classification Methods Niall M. Adams 1, Nicos G. Pavlidis 2, Christoforos Anagnostopoulos 3, Dimitris K. Tasoulis 1 1 Department of Mathematics 2 Institute for Mathematical Sciences
Duality in General Programs. Ryan Tibshirani Convex Optimization 10-725/36-725
 Duality in General Programs Ryan Tibshirani Convex Optimization 10-725/36-725 1 Last time: duality in linear programs Given c R n, A R m n, b R m, G R r n, h R r : min x R n c T x max u R m, v R r b T
Overview of Violations of the Basic Assumptions in the Classical Normal Linear Regression Model
 Overview of Violations of the Basic Assumptions in the Classical Normal Linear Regression Model 1 September 004 A. Introduction and assumptions The classical normal linear regression model can be written
Designing a learning system
 Lecture Designing a learning system Milos Hauskrecht milos@cs.pitt.edu 539 Sennott Square, x4-8845 http://.cs.pitt.edu/~milos/courses/cs750/ Design of a learning system (first vie) Application or Testing
MVA ENS Cachan. Lecture 2: Logistic regression & intro to MIL Iasonas Kokkinos Iasonas.kokkinos@ecp.fr
 Machine Learning for Computer Vision 1 MVA ENS Cachan Lecture 2: Logistic regression & intro to MIL Iasonas Kokkinos Iasonas.kokkinos@ecp.fr Department of Applied Mathematics Ecole Centrale Paris Galen
Probabilistic Discriminative Kernel Classifiers for Multi-class Problems
 c Springer-Verlag Probabilistic Discriminative Kernel Classifiers for Multi-class Problems Volker Roth University of Bonn Department of Computer Science III Roemerstr. 164 D-53117 Bonn Germany roth@cs.uni-bonn.de
Statistics in Retail Finance. Chapter 2: Statistical models of default
 Statistics in Retail Finance 1 Overview > We consider how to build statistical models of default, or delinquency, and how such models are traditionally used for credit application scoring and decision
Machine Learning and Data Mining. Regression Problem. (adapted from) Prof. Alexander Ihler
 Prof. Alexander Ihler") Machine Learning and Data Mining Regression Problem (adapted from) Prof. Alexander Ihler Overview Regression Problem Definition and define parameters ϴ. Prediction using ϴ as parameters Measure the error
Machine Learning and Data Mining Regression Problem (adapted from) Prof. Alexander Ihler Overview Regression Problem Definition and define parameters ϴ. Prediction using ϴ as parameters Measure the error
CSI:FLORIDA. Section 4.4: Logistic Regression
 SI:FLORIDA Section 4.4: Logistic Regression SI:FLORIDA Reisit Masked lass Problem.5.5 2 -.5 - -.5 -.5 - -.5.5.5 We can generalize this roblem to two class roblem as well! SI:FLORIDA Reisit Masked lass
SAS Software to Fit the Generalized Linear Model
 SAS Software to Fit the Generalized Linear Model Gordon Johnston, SAS Institute Inc., Cary, NC Abstract In recent years, the class of generalized linear models has gained popularity as a statistical modeling
Least-Squares Intersection of Lines
 Least-Squares Intersection of Lines Johannes Traa - UIUC 2013 This write-up derives the least-squares solution for the intersection of lines. In the general case, a set of lines will not intersect at a
CHAPTER 2 Estimating Probabilities
 CHAPTER 2 Estimating Probabilities Machine Learning Copyright c 2016. Tom M. Mitchell. All rights reserved. *DRAFT OF January 24, 2016* *PLEASE DO NOT DISTRIBUTE WITHOUT AUTHOR S PERMISSION* This is a
Additional sources Compilation of sources: http://lrs.ed.uiuc.edu/tseportal/datacollectionmethodologies/jin-tselink/tselink.htm
 Mgt 540 Research Methods Data Analysis 1 Additional sources Compilation of sources: http://lrs.ed.uiuc.edu/tseportal/datacollectionmethodologies/jin-tselink/tselink.htm http://web.utk.edu/~dap/random/order/start.htm
HT2015: SC4 Statistical Data Mining and Machine Learning
 HT2015: SC4 Statistical Data Mining and Machine Learning Dino Sejdinovic Department of Statistics Oxford http://www.stats.ox.ac.uk/~sejdinov/sdmml.html Bayesian Nonparametrics Parametric vs Nonparametric
Chapter 3: The Multiple Linear Regression Model
 Chapter 3: The Multiple Linear Regression Model Advanced Econometrics - HEC Lausanne Christophe Hurlin University of Orléans November 23, 2013 Christophe Hurlin (University of Orléans) Advanced Econometrics
Response variables assume only two values, say Y j = 1 or = 0, called success and failure (spam detection, credit scoring, contracting.
 Prof. Dr. J. Franke All of Statistics 1.52 Binary response variables - logistic regression Response variables assume only two values, say Y j = 1 or = 0, called success and failure (spam detection, credit
Parametric fractional imputation for missing data analysis
 1 2 3 4 5 6 7 8 9 10 11 12 13 14 15 16 17 18 19 20 21 22 23 24 25 26 27 28 29 30 31 32 33 34 35 36 37 38 39 40 41 42 43 44 45 46 47 48 Biometrika (????,??,?, pp. 1 14 C???? Biometrika Trust Printed in
Robert Collins CSE598G. More on Mean-shift. R.Collins, CSE, PSU CSE598G Spring 2006
 More on Mean-shift R.Collins, CSE, PSU Spring 2006 Recall: Kernel Density Estimation Given a set of data samples x i ; i=1...n Convolve with a kernel function H to generate a smooth function f(x) Equivalent
ANALYSIS, THEORY AND DESIGN OF LOGISTIC REGRESSION CLASSIFIERS USED FOR VERY LARGE SCALE DATA MINING
 ANALYSIS, THEORY AND DESIGN OF LOGISTIC REGRESSION CLASSIFIERS USED FOR VERY LARGE SCALE DATA MINING BY OMID ROUHANI-KALLEH THESIS Submitted as partial fulfillment of the requirements for the degree of
BOOSTING ALGORITHMS: REGULARIZATION, PREDICTION AND MODEL FITTING
 Submitted to Statistical Science BOOSTING ALGORITHMS: REGULARIZATION, PREDICTION AND MODEL FITTING By Peter Bühlmann and Torsten Hothorn ETH Zürich and Universität Erlangen-Nürnberg We present a statistical
A SURVEY ON CONTINUOUS ELLIPTICAL VECTOR DISTRIBUTIONS
 A SURVEY ON CONTINUOUS ELLIPTICAL VECTOR DISTRIBUTIONS Eusebio GÓMEZ, Miguel A. GÓMEZ-VILLEGAS and J. Miguel MARÍN Abstract In this paper it is taken up a revision and characterization of the class of
Multivariate Logistic Regression
 1 Multivariate Logistic Regression As in univariate logistic regression, let π(x) represent the probability of an event that depends on p covariates or independent variables. Then, using an inv.logit formulation
KERNEL LOGISTIC REGRESSION-LINEAR FOR LEUKEMIA CLASSIFICATION USING HIGH DIMENSIONAL DATA
 Rahayu, Kernel Logistic Regression-Linear for Leukemia Classification using High Dimensional Data KERNEL LOGISTIC REGRESSION-LINEAR FOR LEUKEMIA CLASSIFICATION USING HIGH DIMENSIONAL DATA S.P. Rahayu 1,2
Machine Learning Logistic Regression
 Machine Learning Logistic Regression Jeff Howbert Introduction to Machine Learning Winter 2012 1 Logistic regression Name is somewhat misleading. Really a technique for classification, not regression.
large-scale machine learning revisited Léon Bottou Microsoft Research (NYC)
") large-scale machine learning revisited Léon Bottou Microsoft Research (NYC) 1 three frequent ideas in machine learning. independent and identically distributed data This experimental paradigm has driven
large-scale machine learning revisited Léon Bottou Microsoft Research (NYC) 1 three frequent ideas in machine learning. independent and identically distributed data This experimental paradigm has driven
Linear Algebra Methods for Data Mining
 Linear Algebra Methods for Data Mining Saara Hyvönen, Saara.Hyvonen@cs.helsinki.fi Spring 2007 Lecture 3: QR, least squares, linear regression Linear Algebra Methods for Data Mining, Spring 2007, University