The following provides information on using some of the new/enhanced functionality in Excel 2013.
|
|
|
- Claire Stewart
- 9 years ago
- Views:
Transcription
1 Excel 2013 Tips & Tricks The following provides information on using various features and functionality in Microsoft Excel 2013 and some of the difference between the 2010 version and the 2013 version. Excel Resources For various Excel training videos, visit LyndaCampus at: For documentation and online training, visit the Microsoft Excel page at: Google Excel 2013 Excel 2013 The following provides information on using some of the new/enhanced functionality in Excel Note: To upgrade to Office 2013, please submit a Help Desk ticket (whd.ewu.edu). Get Started Quickly When creating a new worksheet, Excel provides sample templates to quickly choose from, as well as a search option for online templates, and links to template types (for example, Business, Finance-Accounting, and Lists). Note: To return to the worksheet view, click the arrow icon: 1


2 Start Screen and Pinning Favorites The Start screen displays all recently accessed worksheets. To pin a favorite worksheet so that it always displays, mouse over the worksheet and click the Pin icon. Saving Worksheets Excel 2013 provides the ability to save worksheets to the cloud. EWU is not using this feature. Be sure to save to your computer. Additional folders/locations (recent folders accessed, Desktop, My Documents, etc.) display allow quicker saving. 2

3 Excel Options Excel options are used to customize Excel. If you are in the worksheet, click File in the ribbon:. From the left-hand list, select Options:. Options opens in the worksheet view. Click thru the links in the left-hand list of the Excel Options dialog box to set up various customizations and options. 3


4 Flash Fill Flash Fill is a predictive data entry tool that detects patterns and extracts and enters data. For example, to extract a person s first name from a column of first and last name, place the cursor in the adjacent cell. Type the first name. Click Enter. From the Home tab select Fill, Flash Fill. The first names of everyone in the list will be entered into that column immediately. Chart Tools In previous versions of Excel, when a chart is selected, the Chart Tools tab revealed three additional tabs: Design, Layout, and Format. In Excel 2013, only the Design and Format tabs display;. In addition, a set of icons appears outside the top right edge of a chart when it is selected. Click any of these buttons; Chart Elements, Chart Styles or Chart Filters to quickly access additional chart formatting options. Recommended Charts. Select the cart data. Click the Insert tab and Recommended Charts:. Recommended Charts displays based on the chart data. Select the desired chart. 4

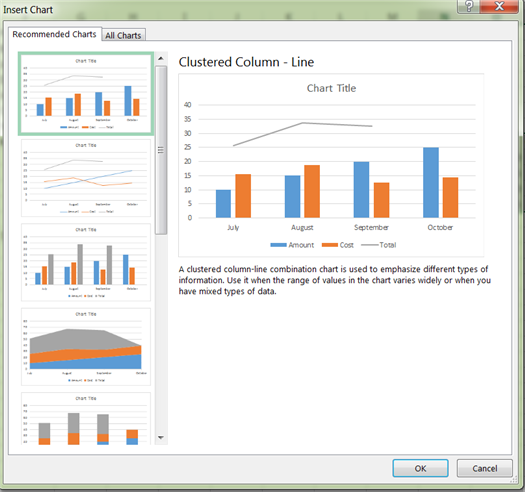
5 5


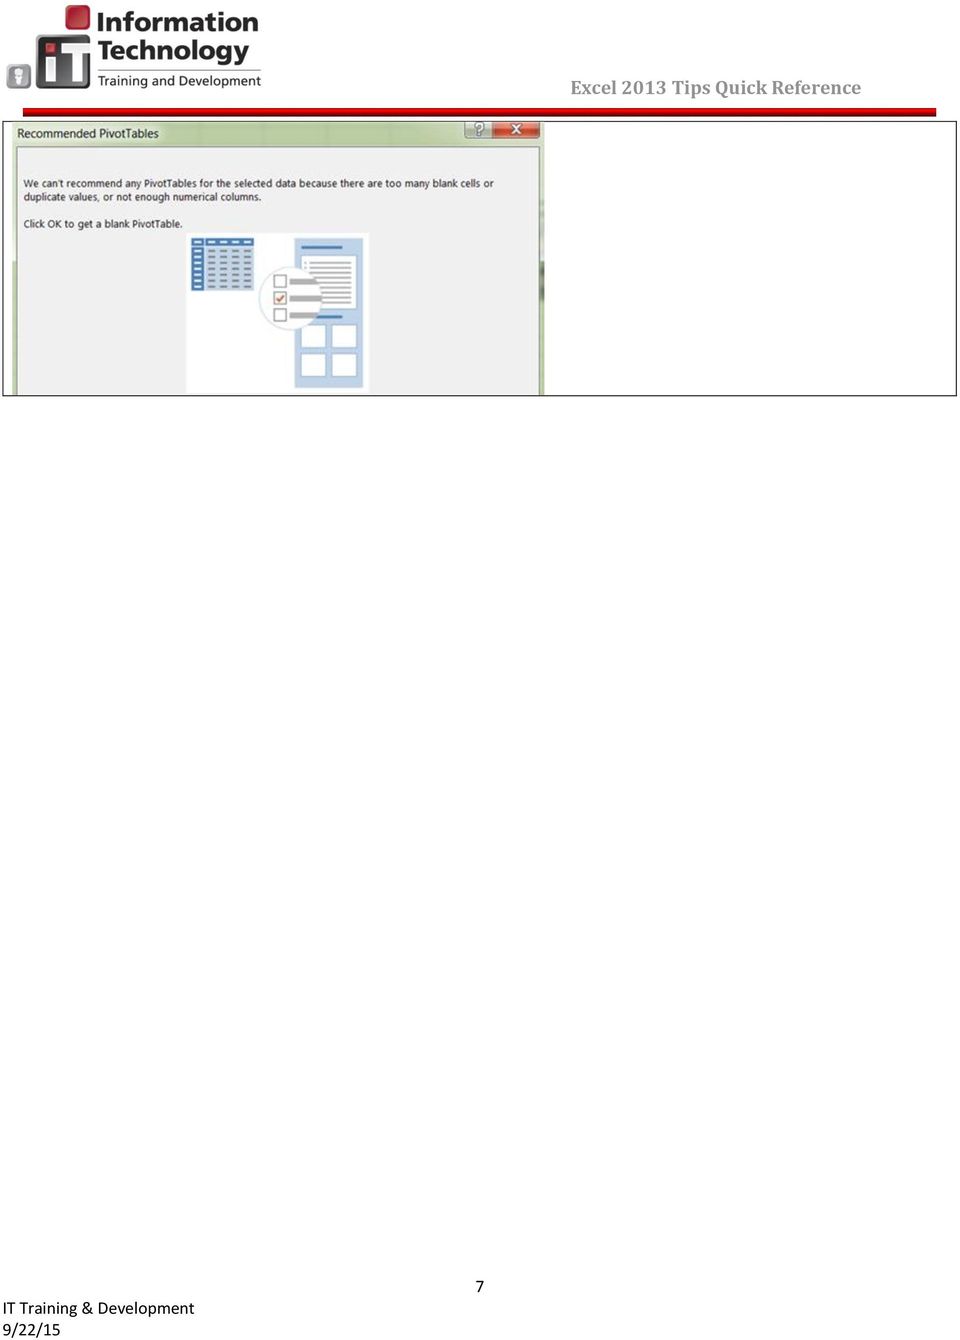
6 Quick Analysis Quick Analysis converts data into a chart or table in two steps or less. Highlight the desired data in the worksheet. Right click and select Quick Analysis based on the data:. Excel displays potential formatting, charts, styles and totals Choose the desired link for further functionality. Pivot Tables Click a mouse key to create a Pivot Table - displays Recommended PivotTables for the type of data being used. Make sure your data has column headings or table headers, and that there are no blank rows. Click any cell in the range of cells or table. From the Home tab, click the Insert tab and Recommended PivotTables. Recommended Pivot Tables display based on the chart data. 6

7 7
Excel 2013 What s New. Introduction. Modified Backstage View. Viewing the Backstage. Process Summary Introduction. Modified Backstage View
 Excel 03 What s New Introduction Microsoft Excel 03 has undergone some slight user interface (UI) enhancements while still keeping a similar look and feel to Microsoft Excel 00. In this self-help document,
Microsoft Office Excel 2013
 Microsoft Office Excel 2013 PivotTables and PivotCharts University Information Technology Services Training, Outreach & Learning Technologies Copyright 2014 KSU Department of University Information Technology
WHAT S NEW IN MS EXCEL 2013
 Contents Excel... 1 Filling empty cells using Flash Fill... 1 Filtering records using a Timeline... 2 Previewing with Quick Analysis... 4 Using Chart Advisor recommendations... 5 Finding errors and issues
Excel Pivot Tables. Blue Pecan Computer Training Ltd - Onsite Training Provider www.bluepecantraining.com :: 0800 6124105 :: [email protected].
 Excel Pivot Tables 1 Table of Contents Pivot Tables... 3 Preparing Data for a Pivot Table... 3 Creating a Dynamic Range for a Pivot Table... 3 Creating a Pivot Table... 4 Removing a Field... 5 Change the
Computer Training Centre University College Cork. Excel 2013 The Quick Analysis Tool
 Computer Training Centre University College Cork Excel 2013 The Quick Analysis Tool Quick Analysis Tool The quick analysis tool is new to Excel 2013. This tool enables the user to quickly access features
Produced by Flinders University Centre for Educational ICT. PivotTables Excel 2010
 Produced by Flinders University Centre for Educational ICT PivotTables Excel 2010 CONTENTS Layout... 1 The Ribbon Bar... 2 Minimising the Ribbon Bar... 2 The File Tab... 3 What the Commands and Buttons
By: Peter K. Mulwa MSc (UoN), PGDE (KU), BSc (KU) Email: [email protected]
, PGDE (KU), BSc (KU) Email: Peter.kyalo@uonbi.ac.ke") SPREADSHEETS FOR MARKETING & SALES TRACKING - DATA ANALYSIS TOOLS USING MS EXCEL By: Peter K. Mulwa MSc (UoN), PGDE (KU), BSc (KU) Email: [email protected] Objectives By the end of the session, participants
SPREADSHEETS FOR MARKETING & SALES TRACKING - DATA ANALYSIS TOOLS USING MS EXCEL By: Peter K. Mulwa MSc (UoN), PGDE (KU), BSc (KU) Email: [email protected] Objectives By the end of the session, participants
Word basics. Before you begin. What you'll learn. Requirements. Estimated time to complete:
 Word basics Word is a powerful word processing and layout application, but to use it most effectively, you first have to understand the basics. This tutorial introduces some of the tasks and features that
Word 2007 WOWS of Word Office 2007 brings a whole new basket of bells and whistles for our enjoyment. The whistles turn to wows.
 WOWS of Word Office brings a whole new basket of bells and whistles for our enjoyment. The whistles turn to wows. [email protected] Templates Click on the Office Button PDF and select New. You can now change
Create a PivotTable or PivotChart report
 Page 1 of 5 Excel Home > PivotTable reports and PivotChart reports > Basics Create or delete a PivotTable or PivotChart report Show All To analyze numerical data in depth and to answer unanticipated questions
Excel 2007 - Using Pivot Tables
 Overview A PivotTable report is an interactive table that allows you to quickly group and summarise information from a data source. You can rearrange (or pivot) the table to display different perspectives
Creating Pivot Tables
 Creating Pivot Tables Example Using CIA Inspection Information This is a step by step guide of how to create pivot tables using Microsoft Excel. You can create a pivot tables from any database you have
Basic Pivot Tables. To begin your pivot table, choose Data, Pivot Table and Pivot Chart Report. 1 of 18
 Basic Pivot Tables Pivot tables summarize data in a quick and easy way. In your job, you could use pivot tables to summarize actual expenses by fund type by object or total amounts. Make sure you do not
Creating tables of contents and figures in Word 2013
 Creating tables of contents and figures in Word 2013 Information Services Creating tables of contents and figures in Word 2013 This note shows you how to create a table of contents or a table of figures
ITS Training Class Charts and PivotTables Using Excel 2007
 When you have a large amount of data and you need to get summary information and graph it, the PivotTable and PivotChart tools in Microsoft Excel will be the answer. The data does not need to be in one
Scott Harvey, Registrar Tri County Technical College. Using Excel Pivot Tables to Analyze Student Data
 Scott Harvey, Registrar Tri County Technical College Using Excel Pivot Tables to Analyze Student Data 1Introduction to PivotTables 2Prepare the source data Discussion Points 3Create a PivotTable 5Show
Microsoft PowerPoint 2010
 Microsoft PowerPoint 2010 Starting PowerPoint... 2 PowerPoint Window Properties... 2 The Ribbon... 3 Default Tabs... 3 Contextual Tabs... 3 Minimizing and Restoring the Ribbon... 4 The Backstage View...
Advanced Excel Charts : Tables : Pivots : Macros
 Advanced Excel Charts : Tables : Pivots : Macros Charts In Excel, charts are a great way to visualize your data. However, it is always good to remember some charts are not meant to display particular types
Data Analysis with Microsoft Excel 2003
 Data Analysis with Microsoft Excel 2003 Working with Lists: Microsoft Excel is an excellent tool to manage and manipulate lists. With the information you have in a list, you can sort and display data that
Migrating to Excel 2010 from Excel 2003 - Excel - Microsoft Office 1 of 1
 Migrating to Excel 2010 - Excel - Microsoft Office 1 of 1 In This Guide Microsoft Excel 2010 looks very different, so we created this guide to help you minimize the learning curve. Read on to learn key
Excel 2013 - Using Pivot Tables
 Overview A PivotTable report is an interactive table that allows you to quickly group and summarise information from a data source. You can rearrange (or pivot) the table to display different perspectives
Advanced Presentation Features and Animation
 There are three features that you should remember as you work within PowerPoint 2007: the Microsoft Office Button, the Quick Access Toolbar, and the Ribbon. The function of these features will be more
To complete this workbook, you will need the following file:
 CHAPTER 4 Excel More Skills 13 Create PivotTable Reports A PivotTable report is an interactive, crosstabulated Excel report that summarizes and analyzes data such as database records from various sources,
Using Excel for your assignments
 [Type here] Using Excel for your assignments This document covers the basics of using Excel to perform simple data analysis and represent that data visually. Excel is a very powerful data analysis tool.
CREATING EXCEL PIVOT TABLES AND PIVOT CHARTS FOR LIBRARY QUESTIONNAIRE RESULTS
 CREATING EXCEL PIVOT TABLES AND PIVOT CHARTS FOR LIBRARY QUESTIONNAIRE RESULTS An Excel Pivot Table is an interactive table that summarizes large amounts of data. It allows the user to view and manipulate
Introduction to Pivot Tables in Excel 2007
 The Company Rocks Introduction to Pivot Tables in Excel 2007 Step-by-step instructions to accompany video lessons Danny Rocks 4/11/2011 Introduction to Pivot Tables in Excel 2007 Pivot Tables are the most
Microsoft Office. Mail Merge in Microsoft Word
 Microsoft Office Mail Merge in Microsoft Word TABLE OF CONTENTS Microsoft Office... 1 Mail Merge in Microsoft Word... 1 CREATE THE SMS DATAFILE FOR EXPORT... 3 Add A Label Row To The Excel File... 3 Backup
In This Issue: Excel Sorting with Text and Numbers
 In This Issue: Sorting with Text and Numbers Microsoft allows you to manipulate the data you have in your spreadsheet by using the sort and filter feature. Sorting is performed on a list that contains
Merging Labels, Letters, and Envelopes Word 2013
 Merging Labels, Letters, and Envelopes Word 2013 Merging... 1 Types of Merges... 1 The Merging Process... 2 Labels - A Page of the Same... 2 Labels - A Blank Page... 3 Creating Custom Labels... 3 Merged
The first thing to do is choose if you are creating a mail merge for printing or an e-mail merge for distribution over e-mail.
 Create a mail or e-mail merge Use mail or e-mail merge when you want to create a large number of documents that are mostly identical but include some unique information. For example, you can use mail merge
NAVIGATION TIPS. Special Tabs
 rp`=j~êëü~ää=påüççä=çñ=_ìëáåéëë Academic Information Services Excel 2007 Cheat Sheet Find Excel 2003 Commands in Excel 2007 Use this handout to find where Excel 2003 commands are located in Excel 2007.
Advanced Excel 10/20/2011 1
 Advanced Excel Data Validation Excel has a feature called Data Validation, which will allow you to control what kind of information is typed into cells. 1. Select the cell(s) you wish to control. 2. Click
Microsoft PowerPoint 2011
 Microsoft PowerPoint 2011 Starting PowerPoint... 2 Creating Slides in Your Presentation... 3 Beginning with the Title Slide... 3 Inserting a New Slide... 3 Adding an Image to a Slide... 4 Downloading Images
Quick Start Guide. Microsoft Publisher 2013 looks different from previous versions, so we created this guide to help you minimize the learning curve.
 Quick Start Guide Microsoft Publisher 2013 looks different from previous versions, so we created this guide to help you minimize the learning curve. Quick Access Toolbar Add your favorite commands to the
How To Create A Powerpoint Intelligence Report In A Pivot Table In A Powerpoints.Com
 Sage 500 ERP Intelligence Reporting Getting Started Guide 27.11.2012 Table of Contents 1.0 Getting started 3 2.0 Managing your reports 10 3.0 Defining report properties 18 4.0 Creating a simple PivotTable
Computer Training Centre University College Cork. Excel 2013 Pivot Tables
 Computer Training Centre University College Cork Excel 2013 Pivot Tables Table of Contents Pivot Tables... 1 Changing the Value Field Settings... 2 Refreshing the Data... 3 Refresh Data when opening a
"Excel with Excel 2013: Pivoting with Pivot Tables" by Venu Gopalakrishna Remani. October 28, 2014
 Teaching Excellence and Innovation 1 Pivot table Pivot table does calculations with criteria Data should be arranged as : Field names in the first rows, records in rows No blank rows or blank columns should
Create a Poster Using Publisher
 Contents 1. Introduction 1. Starting Publisher 2. Create a Poster Template 5. Aligning your images and text 7. Apply a background 12. Add text to your poster 14. Add pictures to your poster 17. Add graphs
Explore commands on the ribbon Each ribbon tab has groups, and each group has a set of related commands.
 Quick Start Guide Microsoft Excel 2013 looks different from previous versions, so we created this guide to help you minimize the learning curve. Add commands to the Quick Access Toolbar Keep favorite commands
Search help. More on Office.com: images templates. Here are some basic tasks that you can do in Microsoft Excel 2010.
 Page 1 of 8 Excel 2010 Home > Excel 2010 Help and How-to > Getting started with Excel Search help More on Office.com: images templates Basic tasks in Excel 2010 Here are some basic tasks that you can do
Microsoft Office 2013
 Student manuals available at: www.learnit.com/manuals Username: manuals; Password: password Microsoft Office 2013 New Features Take this class home with you! Student Videos Available at: www.learnitanytime.com
Microsoft Word 2011: Create a Table of Contents
 Microsoft Word 2011: Create a Table of Contents Creating a Table of Contents for a document can be updated quickly any time you need to add or remove details for it will update page numbers for you. A
Using the Advanced Tier Data Collection Tool. A Troubleshooting Guide
 Using the Advanced Tier Data Collection Tool A Troubleshooting Guide Table of Contents Mouse Click the heading to jump to the page Enable Content/ Macros... 4 Add a new student... 6 Data Entry Screen...
MICROSOFT ACCESS 2007 BOOK 2
 MICROSOFT ACCESS 2007 BOOK 2 4.1 INTRODUCTION TO ACCESS FIRST ENCOUNTER WITH ACCESS 2007 P 205 Access is activated by means of Start, Programs, Microsoft Access or clicking on the icon. The window opened
Create Charts in Excel
 Create Charts in Excel Table of Contents OVERVIEW OF CHARTING... 1 AVAILABLE CHART TYPES... 2 PIE CHARTS... 2 BAR CHARTS... 3 CREATING CHARTS IN EXCEL... 3 CREATE A CHART... 3 HOW TO CHANGE THE LOCATION
Microsoft Excel 2013: Macro to apply Custom Margins, Titles, Gridlines, Autofit Width & Add Macro to Quick Access Toolbar & How to Delete a Macro.
 Microsoft Excel 2013: Macro to apply Custom Margins, Titles, Gridlines, Autofit Width & Add Macro to Quick Access Toolbar & How to Delete a Macro. Do you need to always add gridlines, bold the heading
Word 2010: Mail Merge to Email with Attachments
 Word 2010: Mail Merge to Email with Attachments Table of Contents TO SEE THE SECTION FOR MACROS, YOU MUST TURN ON THE DEVELOPER TAB:... 2 SET REFERENCE IN VISUAL BASIC:... 2 CREATE THE MACRO TO USE WITHIN
Basic Microsoft Excel 2007
 Basic Microsoft Excel 2007 The biggest difference between Excel 2007 and its predecessors is the new layout. All of the old functions are still there (with some new additions), but they are now located
Quick Start Guide. Microsoft Access 2013 looks different from previous versions, so we created this guide to help you minimize the learning curve.
 Quick Start Guide Microsoft Access 2013 looks different from previous versions, so we created this guide to help you minimize the learning curve. Change the screen size or close a database Click the Access
Overview What is a PivotTable? Benefits
 Overview What is a PivotTable? Benefits Create a PivotTable Select Row & Column labels & Values Filtering & Sorting Calculations Data Details Refresh Data Design options Create a PivotChart Slicers Charts
Instructions for Formatting MLA Style Papers in Microsoft Word 2010
 Instructions for Formatting MLA Style Papers in Microsoft Word 2010 To begin a Microsoft Word 2010 project, click on the Start bar in the lower left corner of the screen. Select All Programs and then find
MICROSOFT EXCEL 2010 ANALYZE DATA
 MICROSOFT EXCEL 2010 ANALYZE DATA Microsoft Excel 2010 Essential Analyze data Last Edited: 2012-07-09 1 Basic analyze data... 4 Use diagram to audit formulas... 4 Use Error Checking feature... 4 Use Evaluate
To reuse a template that you ve recently used, click Recent Templates, click the template that you want, and then click Create.
 What is Excel? Applies to: Excel 2010 Excel is a spreadsheet program in the Microsoft Office system. You can use Excel to create and format workbooks (a collection of spreadsheets) in order to analyze
Microsoft Excel 2010. Understanding the Basics
 Microsoft Excel 2010 Understanding the Basics Table of Contents Opening Excel 2010 2 Components of Excel 2 The Ribbon 3 o Contextual Tabs 3 o Dialog Box Launcher 4 o Quick Access Toolbar 4 Key Tips 5 The
Microsoft Excel 2007 Finding Objects and How To
 Microsoft Excel 2007 Finding Objects and How To What s New pg. 2 o Formatting Made Easy o Formulas o Tables o Web o Space and Recovery Finding Your Way Around the Ribbon pg. 3 8 o Office Logo Button o
How to Excel with CUFS Part 2 Excel 2010
 How to Excel with CUFS Part 2 Excel 2010 Course Manual Finance Training Contents 1. Working with multiple worksheets 1.1 Inserting new worksheets 3 1.2 Deleting sheets 3 1.3 Moving and copying Excel worksheets
INTERMEDIATE Excel 2013
 INTERMEDIATE Excel 2013 Information Technology September 1, 2014 1 P a g e Managing Workbooks Excel uses the term workbook for a file. The term worksheet refers to an individual spreadsheet within a workbook.
Right-click the Start button and select Properties. Click the Customize button and choose from the options displayed:
 What s New in Windows 7 & Office 2010 www.salford.ac.uk/library Contents 1 Windows 7... 2 2 General Office 2010... 4 3 Access... 5 4 Excel 2010... 7 5 Outlook... 8 6 PowerPoint... 9 7 Word... 10 1 (KS
Page 1. 1.0 Create and Manage a Presentation 1.1 Create a Presentation Pages Where Covered
 Page 1 Study Guide for MOS Objectives in Microsoft PowerPoint 2013 Illustrated 1.0 Create and Manage a Presentation 1.1 Create a Presentation creating blank presentations 6 creating presentations using
In this example, Mrs. Smith is looking to create graphs that represent the ethnic diversity of the 24 students in her 4 th grade class.
 Creating a Pie Graph Step-by-step directions In this example, Mrs. Smith is looking to create graphs that represent the ethnic diversity of the 24 students in her 4 th grade class. 1. Enter Data A. Open
STATEMENT OF TRANSACTION REPORT ANALYSIS USING EXCEL
 STATEMENT OF TRANSACTION REPORT ANALYSIS USING EXCEL Excel can be used to analyze the MCPS Statement of Transaction EXCEL Report Selected Fields to more easily track expenses through the procurement cycle.
Advanced Microsoft Excel 2010
 Advanced Microsoft Excel 2010 Table of Contents THE PASTE SPECIAL FUNCTION... 2 Paste Special Options... 2 Using the Paste Special Function... 3 ORGANIZING DATA... 4 Multiple-Level Sorting... 4 Subtotaling
Introduction to Microsoft Word 2003
 Introduction to Microsoft Word 2003 Sabeera Kulkarni Information Technology Lab School of Information University of Texas at Austin Fall 2004 1. Objective This tutorial is designed for users who are new
Microsoft Office Excel 2007 Key Features. Office of Enterprise Development and Support Applications Support Group
 Microsoft Office Excel 2007 Key Features Office of Enterprise Development and Support Applications Support Group 2011 TABLE OF CONTENTS Office of Enterprise Development & Support Acknowledgment. 3 Introduction.
Microsoft Office PowerPoint 2013
 Microsoft Office PowerPoint 2013 Navigating the PowerPoint 2013 Environment The Ribbon: The ribbon is where you will access a majority of the commands you will use to create and develop your presentation.
Pivot Tables & Pivot Charts
 Pivot Tables & Pivot Charts Pivot tables... 2 Creating pivot table using the wizard...2 The pivot table toolbar...5 Analysing data in a pivot table...5 Pivot Charts... 6 Creating a pivot chart using the
3 What s New in Excel 2007
 3 What s New in Excel 2007 3.1 Overview of Excel 2007 Microsoft Office Excel 2007 is a spreadsheet program that enables you to enter, manipulate, calculate, and chart data. An Excel file is referred to
WHAT S NEW IN WORD 2010 & HOW TO CUSTOMIZE IT
 WHAT S NEW IN WORD 2010 & HOW TO CUSTOMIZE IT The Ribbon... 2 Default Tabs... 2 Contextual Tabs... 2 Minimizing and Restoring the Ribbon... 3 Customizing the Ribbon... 3 A New Graphic Interface... 5 Live
A Beginning Guide to the Excel 2007 Pivot Table
 A Beginning Guide to the Excel 2007 Pivot Table Paula Ecklund Summer 2008 Page 1 Contents I. What is a Pivot Table?...1 II. Basic Excel 2007 Pivot Table Creation Source data requirements...2 Pivot Table
1. Right click using your mouse on the desktop and select New Shortcut.
 offers 3 login page styles: Standard Login, List Login or Quick Time Punch. Each login page can be saved as a shortcut to your desktop or as a bookmark for easy fast login access. For quicker access to
Microsoft Excel 2013: Charts June 2014
 Microsoft Excel 2013: Charts June 2014 Description We will focus on Excel features for graphs and charts. We will discuss multiple axes, formatting data, choosing chart type, adding notes and images, and
Quick Start Guide. Microsoft Access 2013 looks different from previous versions, so we created this guide to help you minimize the learning curve.
 Quick Start Guide Microsoft Access 2013 looks different from previous versions, so we created this guide to help you minimize the learning curve. Change the screen size or close a database Click the Access
Microsoft PowerPoint 2008
 Microsoft PowerPoint 2008 Starting PowerPoint... 2 Creating Slides in Your Presentation... 3 Beginning with the Title Slide... 3 Inserting a New Slide... 3 Slide Layouts... 3 Adding an Image to a Slide...
A simple three dimensional Column bar chart can be produced from the following example spreadsheet. Note that cell A1 is left blank.
 Department of Library Services Creating Charts in Excel 2007 www.library.dmu.ac.uk Using the Microsoft Excel 2007 chart creation system you can quickly produce professional looking charts. This help sheet
MY EWU PORTAL FEATURES AND BENEFITS. Promotion of the Eastern brand name
 MY EWU PORTAL The My EWU web portal is an interactive website that provides single sign-on access to different EWU information and services. Content is based on your role or roles for example; student,
PowerPoint 2013: Basic Skills
 PowerPoint 2013: Basic Skills Information Technology September 1, 2014 1 P a g e Getting Started There are a variety of ways to start using PowerPoint software. You can click on a shortcut on your desktop
Creating a Newsletter with Microsoft Word
 Creating a Newsletter with Microsoft Word Frank Schneemann In this assignment we are going to use Microsoft Word to create a newsletter that can be used in your classroom instruction. If you already know
Microsoft Excel 2013 Step-by-Step Exercises: PivotTables and PivotCharts: Exercise 1
 Microsoft Excel 2013 Step-by-Step Exercises: PivotTables and PivotCharts: Exercise 1 In this exercise you will learn how to: Create a new PivotTable Add fields to a PivotTable Format and rename PivotTable
Introduction to Microsoft Excel 2010
 Introduction to Microsoft Excel 2010 Screen Elements Quick Access Toolbar The Ribbon Formula Bar Expand Formula Bar Button File Menu Vertical Scroll Worksheet Navigation Tabs Horizontal Scroll Bar Zoom
Creating and Formatting Charts in Microsoft Excel
 Creating and Formatting Charts in Microsoft Excel This document provides instructions for creating and formatting charts in Microsoft Excel, which makes creating professional-looking charts easy. The chart
Excel 2010: Create your first spreadsheet
 Excel 2010: Create your first spreadsheet Goals: After completing this course you will be able to: Create a new spreadsheet. Add, subtract, multiply, and divide in a spreadsheet. Enter and format column
Introduction To Microsoft Office PowerPoint 2007. Bob Booth July 2008 AP-PPT5
 Introduction To Microsoft Office PowerPoint 2007. Bob Booth July 2008 AP-PPT5 University of Sheffield Contents 1. INTRODUCTION... 3 2. GETTING STARTED... 4 2.1 STARTING POWERPOINT... 4 3. THE USER INTERFACE...
Stored Documents and the FileCabinet
 Stored Documents and the FileCabinet Introduction The stored document features have been greatly enhanced to allow easier storage and retrieval of a clinic s electronic documents. Individual or multiple
Planning and Managing Projects with Microsoft Project Professional 2013
 Project management deliverables (e.g. reports); WBS deliverables can be used for report timing Steps to Create a Project from an Existing Template: 1. Click File then New. 2. Select any of the featured
Microsoft Excel 2010
 Microsoft Excel 2010 Special Topics PivotTable IF Function V-Lookup Function Information Technology Services Outreach and Distance Learning Technologies Copyright 2011 KSU Department of Information Technology
INTRODUCTION TO DESKTOP PUBLISHING
 INTRODUCTION TO DESKTOP PUBLISHING Desktop publishing uses page layout software and a personal computer to combine text, type, drawings, and images on a page to create books, newsletters, marketing brochures,
ACCESS 2007 BASICS. Best Practices in MS Access. Information Technology. MS Access 2007 Users Guide. IT Training & Development (818) 677-1700
 677-1700") Information Technology MS Access 2007 Users Guide ACCESS 2007 BASICS Best Practices in MS Access IT Training & Development (818) 677-1700 Email: [email protected] Website: www.csun.edu/it/training Access
Information Technology MS Access 2007 Users Guide ACCESS 2007 BASICS Best Practices in MS Access IT Training & Development (818) 677-1700 Email: [email protected] Website: www.csun.edu/it/training Access
Introduction to Pivot Tables in Excel 2003
 The Company Rocks Introduction to Pivot Tables in Excel 2003 Step-by-step instructions to accompany video lessons Danny Rocks 4/11/2011 Introduction to Pivot Tables in Excel 2003 Pivot Tables are the most
How to Use Excel for Law Firm Billing
 How to Use Excel for Law Firm Billing FEATURED FACULTY: Staci Warne, Microsoft Certified Trainer (MCT) (801) 463-1213 [email protected] Staci Warne, Microsoft Certified Trainer (MCT) Staci Warne
Microsoft Excel: Pivot Tables
 Microsoft Excel: Pivot Tables Pivot Table Reports A PivotTable report is an interactive table that you can use to quickly summarize large amounts of data. You can rotate its rows and columns to see different
MS Excel. Handout: Level 2. elearning Department. Copyright 2016 CMS e-learning Department. All Rights Reserved. Page 1 of 11
 MS Excel Handout: Level 2 elearning Department 2016 Page 1 of 11 Contents Excel Environment:... 3 To create a new blank workbook:...3 To insert text:...4 Cell addresses:...4 To save the workbook:... 5
Microsoft Word 2010 Prepared by Computing Services at the Eastman School of Music July 2010
 Microsoft Word 2010 Prepared by Computing Services at the Eastman School of Music July 2010 Contents Microsoft Office Interface... 4 File Ribbon Tab... 5 Microsoft Office Quick Access Toolbar... 6 Appearance
Excel 2003 PivotTables Summarizing, Analyzing, and Presenting Your Data
 The Company Rocks Excel 2003 PivotTables Summarizing, Analyzing, and Presenting Step-by-step instructions to accompany video lessons Danny Rocks 5/19/2011 Creating PivotTables in Excel 2003 PivotTables
Mail Merge Creating Mailing Labels 3/23/2011
 Creating Mailing Labels in Microsoft Word Address data in a Microsoft Excel file can be turned into mailing labels in Microsoft Word through a mail merge process. First, obtain or create an Excel spreadsheet
PA Payroll Exercise for Intermediate Excel
 PA Payroll Exercise for Intermediate Excel Follow the directions below to create a payroll exercise. Read through each individual direction before performing it, like you are following recipe instructions.
Create a New Database in Access 2010
 Create a New Database in Access 2010 Table of Contents OVERVIEW... 1 CREATING A DATABASE... 1 ADDING TO A DATABASE... 2 CREATE A DATABASE BY USING A TEMPLATE... 2 CREATE A DATABASE WITHOUT USING A TEMPLATE...
Microsoft Excel 2010 Tutorial
 1 Microsoft Excel 2010 Tutorial Excel is a spreadsheet program in the Microsoft Office system. You can use Excel to create and format workbooks (a collection of spreadsheets) in order to analyze data and
Overview. Table of Contents. isupport Incident Management
 Overview The isupport software is a powerful and flexible help desk/desktop support solution used by San José State to manage information technology tickets, or incidents. While isupport has many tools