Environmental Monitoring of Lake Michigan Using CoastWatch Data and JAVA GIS
|
|
|
- Ralph Chambers
- 8 years ago
- Views:
Transcription
1 Environmental Monitoring of Lake Michigan Using CoastWatch Data and JAVA GIS Page 1 of 12 Environmental Monitoring of Lake Michigan Using CoastWatch Data and JAVA GIS George A. Leshkevich and Songzhi Liu Table of Contents Abstract Introduction AVHRR Imagery (NOAA 14 & NOAA 16 AVHRR Imagery) GLSEA (Great Lakes Surface Environmental Analysis) GOES Imagery (GOES 8 Imagery) RADARSAT (RADARSAT Imagery) Image Products (Channel 1 / Channel 2 Reflectance Products) In Situ Data (Great Lakes NOAAPORT Marine Observation Data) Statistics (Great Lakes Average Surface Water Temperature) JAVA GIS (JAVA Applet) CDAT (CoastWatch Data Analysis Tool) Future Plans References Great Lakes CW Web Site Address Abstract CoastWatch is a nationwide National Oceanic and Atmospheric Administration (NOAA) program within which the Great Lakes Environmental Research Laboratory (GLERL) functions as the Great Lakes regional node. In this capacity, GLERL obtains, produces, and delivers environmental data and products for near real-time observation of the Great Lakes to support environmental science, decision making, and supporting research. This is achieved by providing Internet access to near real-time and retrospective satellite observations, in-situ Great Lakes data, and derived products to Federal, state, and local agencies, academic institutions, and the public via the Great Lakes CoastWatch web site ( The goals and objectives of the CoastWatch Great Lakes Program directly support NOAA s statutory responsibilities in estuarine and marine science, living marine resource protection, and ecosystem monitoring and management. Great Lakes CoastWatch data are used in a variety of ways including monitoring of algal blooms, plumes, ice cover, and water temperatures, two and three dimensional modeling of Great Lakes physical parameters such as wave height and currents, damage assessment modeling, research, and for educational and recreational activities. New utilities such as JAVA based interactive retrieval of physical parameters such as surface temperature, ice cover, winds, and bottom depth at a given location enhance the accessibility and utility of Great Lakes CoastWatch data. Plans include enhancing the present product suite with image products from new satellite sensors such as Synthetic Aperture Radar (SAR) and ocean color sensors. [Back to Table of Contents] 10/5/2002
 JAVA GIS (JAVA Applet) CDAT (CoastWatch Data Analysis Tool) Future Plans References Great Lakes CW Web Site Address Abstract CoastWatch is a nationwide National Oceanic and Atmospheric")
2 Environmental Monitoring of Lake Michigan Using CoastWatch Data and JAVA GIS Page 2 of 12 Introduction In response to an occurrence of "Red Tide" off the coast of North Carolina in late 1987, a program was developed within NOAA's National Environmental Satellite, Data and Information Service (NESDIS) to provide the NOAA National Marine Fisheries Service Laboratory at Beaufort, North Carolina with satellite-derived sea surface temperature (SST) maps of the Gulf Stream and other types of data so that future occurrences of this phenomenon or other coastal environmental events could be better anticipated and monitored (Pyke, 1989). Within the NOAA Coastal Ocean Program, this program was extended to other coastal regions of the U.S., including the Great Lakes, to become the NOAA CoastWatch Program, now a part of NESDIS (Leshkevich et al., 1997, Leshkevich et al, 1993, Schwab et al., 1992). The original goal of the CoastWatch Program, to develop and deliver environmental data and products for near real-time monitoring of U.S. coastal waters to support environmental science and decision making, has expanded to include research, educational, and recreational uses. NOAA CoastWatch Regional Nodes The CoastWatch Great Lakes Node is currently receiving a suite of 33 enhanced digital image products including satellite-derived surface temperature, visible and near-infrared reflectance, brightness temperatures, cloud masks, and satellite/solar zenith angle data from the NOAA/AVHRR (Advanced Very High Resolution Radiometer) series of satellites, as well as GOES (Geostationary Operational Environmental Satellites) visible, near infrared, and water vapor imagery. These near real-time products are acquired at GLERL from NESDIS via the Internet. The Great Lakes environmental data received at the CoastWatch Great Lakes Node are processed within 30 minutes after download. Several types of the products are produced and stored on the CoastWatch Great Lakes Node web site, including AVHRR imagery in GIF, PostScript, and CoastWatch raw data format, AVHRR interactive SST imagery (SatView), Great Lakes Surface Environmental Analysis (GLSEA), subtraction or histogram equalized reflectance imagery, and GOES imagery (see Figure 1). Currently, the AVHRR imagery on the web site are updated continually as the imagery becomes available. GLSEA, subtraction and histogram equalized reflectance imagery are updated once a day. AVHRR satellite data and products are kept on the web site for two weeks. Access to a retrospective archive beginning in 1990 via the NOAA CoastWatch Active Access System (NCAAS) is also available. The CoastWatch Great Lakes Node also receives raw marine observations for the Great Lakes region via satellite transmission from the NOAAPORT broadcast system. The information extracted from NOAAPORT observations includes: air temperature, dew point, wind direction, wind speed, maximum wind gust, cloud cover, air pressure, water temperature, wave height, and wave period. The raw marine observations are available on the CoastWatch Great Lakes Node web site and are updated hourly. In addition, other in-situ data and modeled data including marine and meteorological observations, NDBC buoy observations, water level gauge measurements received from the National Ocean Service (NOS),. 10/5/2002
. Within the NOAA Coastal Ocean Program, this program was extended to other coastal regions of the U.S.")
3 Environmental Monitoring of Lake Michigan Using CoastWatch Data and JAVA GIS Page 3 of 12 and Great Lakes Forecasting System (nowcast and forecast) products are made available to Great Lakes CoastWatch data users via links on the CoastWatch Great Lakes web site. Access to near real-time AVHRR satellite imagery received at GLERL is available at no cost after submitting an electronic registration form via the CoastWatch Great Lakes web site. Other data and products (with the exception of the proprietary RADARSAT data) do not require registration for access. In a cooperative project with the Great Lakes Sea Grant Network, CoastWatch AVHRR imagery is downloaded from the CoastWatch Great Lakes Node by Michigan Sea Grant and the Michigan State University (MSU) Institute of Water Research and processed to produce a contoured surface water temperature product of regional areas on the Great Lakes. This product is available on the CoastWatch Great Lakes web site via a link to the Michigan Sea Grant web site at Michigan State University. Figure 1. NOAA CoastWatch Great Lakes Node Web Site ( [Back to Table of Contents] AVHRR Imagery (NOAA 14 & NOAA 16 AVHRR Imagery) CoastWatch image products, i.e., water surface temperature imagery, visible (Ch.1) and near-infrared (Ch.2) reflectance data, cloud mask, and satellite/solar zenith angle data are obtained from NOAA polarorbiting weather satellites. There are currently two operational polar-orbiting weather satellites (NOAA 14 and NOAA 16) which each carry (among other sensors) the Advanced Very High Resolution Radiometer (AVHRR). Each satellite passes over a given area twice a day (about 5 AM and 4:30 PM local time for NOAA 14 and about 2 AM and 1:30 PM local time for NOAA 16) The AVHRR scans a swath of approximately 2700 km on the earth's surface beneath the satellite in five radiometric bands, Ch.1 - visible ( µm), Ch.2 - reflected infrared ( µm), and three thermal infrared channels (Ch µm, Ch µm, Ch µm) (Koczor, 1987). AVHRR data are processed at two resolutions, 4 km Global Area Coverage (GAC) and 1 km High Resolution Picture Transmission (HRPT). The HRPT data are used for Great Lakes CoastWatch imagery. These data are downloaded to a satellite receiving station then transmitted to NESDIS facilities in Suitland, Maryland where they are calibrated, geo-located, quality controlled, and made available as AVHRR level 1b data sets (see Kidwell, 1991 and Pichel et al., 1991 for details of this process). For the CoastWatch program, the level-1b data are mapped to a Mercator projection and resampled to a 512x512 pixel grid. Four scenes or "windows" are extracted for the Great Lakes region as listed in Table 1. One synoptic scene covers all five lakes at a 2.56 km resolution. The other three scenes focus on Lake Superior, Lakes Michigan and Huron, and Lakes Erie and Ontario at twice the resolution of the five-lake scene. Actual resolution is determined by d cos f, where d is the spatial resolution at the equator, and f is the latitude. The grid spacing for the three high resolution Great Lakes scenes ranges from 1.24 to 1.30 km as indicated in Table 1. Table 1. CoastWatch Windows for the Great Lakes 10/5/2002
 do not require registration for access.")
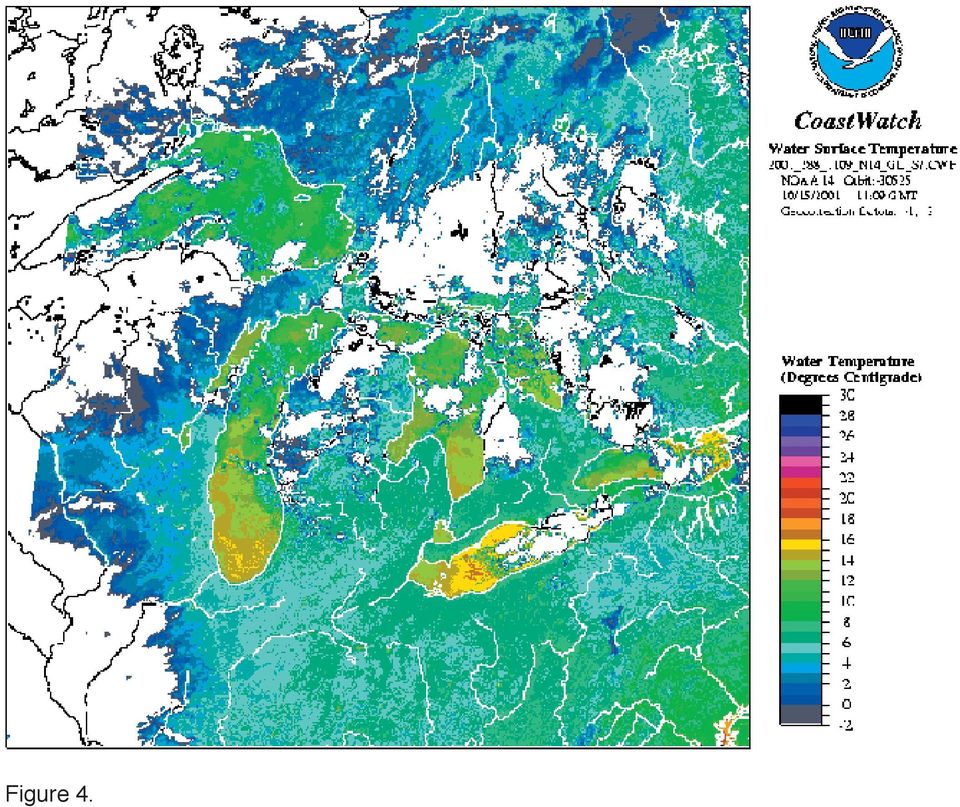
4 Environmental Monitoring of Lake Michigan Using CoastWatch Data and JAVA GIS Page 4 of 12 Latitude Longitude Pixel Size (km) Range ( N) Range ( W) (at mid-latitude) Full Region Superior Michigan-Huron Erie-Ontario Full resolution (1.3 km) synoptic scenes on a 1024x1024 pixel grid are currently being received and are available in the JAVA GIS utility. In the AVHRR Imagery section, users can: select the synoptic scene or one of the three subscenes (see Figure 2). Figure 2. The Laurentian Great Lakes select daytime or nighttime SST or Ch.1 (visible) or Ch.2 (near-infrared) scenes from the thumbnail images of the past two weeks. (see Figure 3). Figure 3. Thumbnail Images of the Past Two Weeks view or download selected images (see Figure 4). Figure 4. Selected Image run a Java applet program to interactively retrieve temperature (C or F) and Lat/Long at the cursor position (see Figure 5). 10/5/2002
. Figure 2. The Laurentian Great Lakes select daytime or nighttime SST or Ch.")
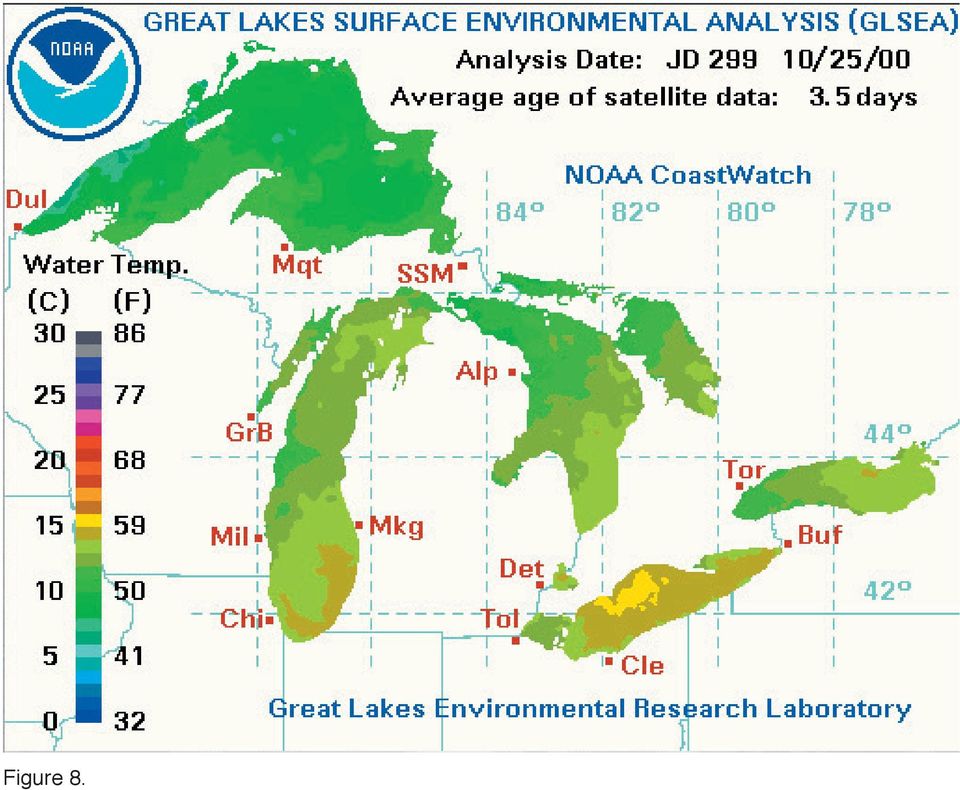
5 Environmental Monitoring of Lake Michigan Using CoastWatch Data and JAVA GIS Page 5 of 12 Figure 5. Run a Java Satview program GLSEA (Great Lakes Surface Environmental Analysis) [Back to Table of Contents] The Great Lakes Surface Environmental Analysis (GLSEA) is a daily, cloud free digital map of the Great Lakes surface water temperature (with ice cover overlay during the winter) produced at the NOAA CoastWatch Great Lakes Node. The GLSEA is stored as a 512x400 pixel map in GIF format, suitable for viewing on PCs and workstations (see Figure 6). Software for accessing and viewing CoastWatch image data and products is available for download from the "Software" page on the CoastWatch Great Lakes web site. Figure 6. Great Lakes Surface Environmental Analysis (GLSEA) The lake surface temperatures are derived from the near real-time AVHRR satellite imagery obtained by the Great Lakes CoastWatch program. The addition of ice cover concentration information provided by the National Ice Center (NIC) was implemented in late 1997 (see Figure 7). Lake surface temperatures are updated daily with information from the cloud-free portions of the previous day's satellite imagery. If no imagery is available, a smoothing algorithm is applied to the previous day's map (see Schwab et al., 1999). During the winter season, ice concentration information is then added, using the most recent Great Lakes Ice Analysis produced by the NIC, nominally three times per week during the ice season. Figure 7. Great Lakes Surface Environmental Analysis with Ice Cover (GLSEA) Yearly and previous 365 day animations of the daily GLSEA chart in QT, FLC, and AVI formats are also available (see Figure 8). Figure 8. Previous 365 days GLSEA animation (AVI format) [Back to Table of Contents] 10/5/2002
.")
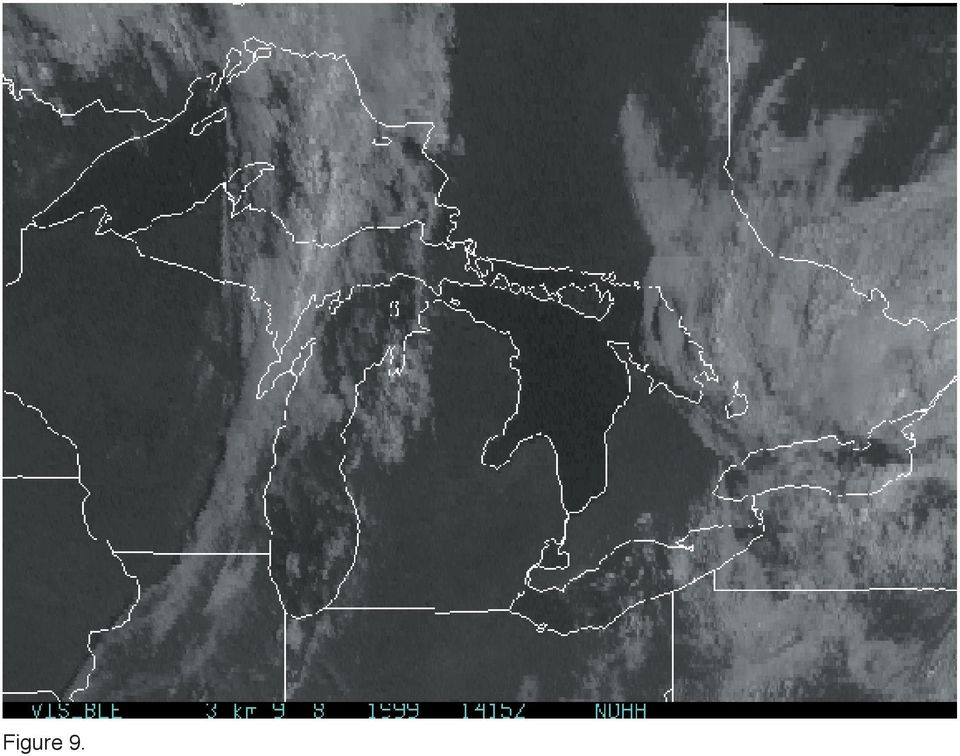
6 Environmental Monitoring of Lake Michigan Using CoastWatch Data and JAVA GIS Page 6 of 12 GOES Imagery (GOES 8 Imagery) The GOES spacecraft is designed to operate in geosynchronous orbit, 35,790 km (22,240 statute miles) above the earth, thereby remaining stationary relative to the earth's surface. The spacecraft continuously views the continental U.S., neighboring environs of the Pacific and Atlantic Oceans, and Central and South America. The three-axis, body stabilized spacecraft design (GOES-8, onward) enables the sensors to image clouds, monitor earth's surface temperature and water vapor fields, and sound the atmosphere for its vertical thermal and water vapor structures. The main mission is carried out by the primary payload instruments, the Imager and the Sounder. The Imager is a multichannel instrument that senses radiant energy and reflected solar energy from the earth's surface and atmosphere. The Sounder provides data for vertical atmospheric temperature and moisture profiles, surface and cloud top temperature, and ozone distribution. Two advanced GOES satellites are in use: GOES-8, and -10 (Series I-M). Currently the CoastWatch Great Lakes Node recieves four types of GOES-8 satellite imagery: Visible Channel (Ch.1) (see Figure 9), Infrared Channel (Ch.2) (see Figure 10), Water Vapor (see Figure 11) (hourly - 3 km resolution), and a recently added GOES sea surface temperature product for the Great Lakes (3 hourly - 6 km resolution) (see Figure 11b). Figure 9. GOES-8 Satellite Imagery (Visible Channel 1) Figure 10. GOES-8 Satellite Imagery (Infrared Channel 2) Figure 11. GOES-8 Satellite Imagery (Water Vapor) Figure 11b. GOES SST 3-hour Composite Imagery 10/5/2002
 enables the sensors to image clouds, monitor earth's surface temperature and water vapor fields, and sound the atmosphere for its")
7 Environmental Monitoring of Lake Michigan Using CoastWatch Data and JAVA GIS Page 7 of 12 [Back to Table of Contents] RADARSAT (RADARSAT Imagery) Figure 12a. RADARSAT Imagery [Back to Table of Contents] Image Products (Channel 1 / Channel 2 Reflectance Products) Great Lakes CoastWatch visible reflectance products are produced using two types of Advanced Very High Resolution Radiometer (AVHRR) satellite data. AVHRR Channel 1 (visible, µm) and Channel 2 (reflected infrared, µm) from daytime passes of NOAA polar orbiting satellites. The CoastWatch Great Lakes Node currently provides two types of reflectance imagery products: Subtraction (Ch.1 - Ch.2) (see Figure 12) which is useful in the detection of suspended solids (plumes) and algal blooms in the Great Lakes, and Histogram Equalized Ch.1 (see Figure 13) which is useful for ice cover detection and monitoring during the winter season. Figure 12. Subtraction (Ch.1 - Ch.2) Figure 13. Histogram Equalized Ch.1 [Back to Table of Contents] In Situ Data (Great Lakes NOAAPORT Marine Observation Data) Marine observations for the Great Lakes region are obtained via satellite transmission from the NOAAPORT broadcast system. The NOAAPORT broadcast system provides a one-way broadcast 10/5/2002

8 Environmental Monitoring of Lake Michigan Using CoastWatch Data and JAVA GIS Page 8 of 12 communication of NOAA environmental data and information in near real-time to NOAA and external users. This broadcast service is implemented by a commercial provider of satellite communications utilizing C-band. These NOAAPORT observations, acquired hourly by the CoastWatch Great Lakes node, are decoded and processed to produce various data files, timeseries plots, and interactive imagemaps (see Figure 14). Figure 14. Interactive Image Map - Buoy Data The Great Lakes surface observation network is comprised of 205 fixed stations including 18 moored buoys, 11 Coastal Marine Automated Network (CMAN) stations, 35 US Coast Guard stations, 21 Other Marine Reports (OMR) stations, and 120 surface airways stations. In addition, many commercial cargo ships and Coast Guard vessels provide regular meteorological reports. Frequency of observational reporting ranges from about once every 3 hours to 3-5 times per hour depending on the type of station. The Great Lakes CoastWatch data base includes the following information extracted from NOAAPORT observations: air temperature, dew point, wind direction, wind speed, maximum wind gust, cloud cover, air pressure, water temperature, wave height, and wave period. During a typical summer day, the marine observation data includes about 300 buoy observations, 3500 observations from land stations, and about 300 reports from vessels. [Back to Table of Contents] Statistics (Great Lakes Average Surface Water Temperature) Great Lakes average surface water temperature derived from the daily Great Lakes Surface Environmental Analysis (GLSEA) is displayed in three formats: Previous 365 day GLSEA Average Surface Water Temperature for each lake. Average GLSEA Surface Water Temperature Graphs (see Figure 16) for each lake for the previous 5 years and for all lakes for each of the previous 5 years. Average GLSEA Surface Water Temperature Data for each lake for the previous 5 years. The average GLSEA surface water temperature graphs and data will help data users compare Great Lakes surface water temperatures for the past 5 years. Figure 16. GLSEA Average Surface Water Temperature Graph 10/5/2002

9 Environmental Monitoring of Lake Michigan Using CoastWatch Data and JAVA GIS Page 9 of 12 [Back to Table of Contents] JAVA GIS A new utility, based on a JAVA applet, allows interactive retrieval of physical parameters such as surface temperature, ice cover, winds, and bottom depth at a given location in an image, which enhances the accessibility and utility of Great Lakes CoastWatch data (see Figure 17). The applet is initiated using the JAVA GIS buttom on the Great Lakes CoastWatch home page. A window will appear in which you can specify an image type and date, overlay (shapefile) data, or the URL of a custom shapefile to be viewed. Current image data includes near real-time NOAA AVHRR surface temperature data, Channel 1 visible reflectance data, and GLSEA (Great Lakes Surface Environmental Analysis) cloud-free composited surface temperature data. Ice concentration data is available during the winter season. Shapefiles include shoreline, bathymetry, and state boundary/land mask overlays. Once the image type and date are chosen, select and load desired shapefiles, then press the start button. Three new windows (Panner window, Image window, and Control Panel window) will appear on your screen. Scroll and zoom options are available using the Panner and Image windows. Overlays (shapefiles) are turned on and off using the Control Panel. Overlay colors can be changed to enhance visibility. In addition, near real-time NOAAPort marine observation data at buoy, CMAN, and Coast Guard shore station locations and/or nowcast gridded winds (at the hour of the displayed satellite image) can be displayed and observed values obtained by moving the cursor over the station or wind vector of interest. Figure 17. Great Lakes CoastWatch Java GIS CDAT (CoastWatch Data Analysis Tool) [Back to Table of Contents] The CoastWatch Data Analysis Tool (CDAT) is a data visualization program with a graphical interface that allows users to view and perform simple analysis on CoastWatch and other satellite data such as applying cloud masks (Maturi and Pichel, 1993) to the imagery and querying and obtaining statistics for a user defined regional area of interest. CDAT is currently under development, but versions for Unix and Windows platforms are available for download from the "Software" page on the CoastWatch Great Lakes web site. Figure 18. Imagery and Information Panel 10/5/2002
 data, or the URL of a custom shapefile to be viewed.")
10 Environmental Monitoring of Lake Michigan Using CoastWatch Data and JAVA GIS Page 10 of 12 Figure 19. Imagery with Grid and Geography Overlay Figure 20. Imagery with Cloud Mask Overlay Figure 21. Imagery Zoom In Figure 22. Imagery Survey (regional area of interest) and Statistics [Back to Table of Contents] Future Plans Plans include enhancing the present product suite with products derived from new satellite sensors such as synthetic aperture radar (SAR) (see example in Figure 12a ) and ocean color sensors. Figure 23 is an example of a chlorophyll map derived from the SeaWiFS ocean color sensor. Image viewing and analysis tools will be improved and other image and in situ data will be added. In addition, a new CoastWatch file naming convention will soon be implemented. The new file names contain additional information about the image data and will be in the form: YYYY_JJJ_HHMM_SSS_NR_PP.TYP where YYYY Year JJJ Julian Day HH Hour MM Minute SSS Satellite Code (N14, N16, etc.) NR CoastWatch Node and Regional Scene (l, m, s, e) PP Product Data Type (d1, s7, etc.) TYP File Format Type (cwf, gif, hdf, etc) For example, a file with the name 2001_310_1740_n16_gl_d1.cwf contains image data for year 2001, 10/5/2002
![Imagery Survey (regional area of interest) and Statistics [Back to Table of Contents] Future Plans Plans include enhancing the present product suite with products derived from new satellite sensors](/docs-images/44/15308368/images/page_10.jpg "such as synthetic aperture radar (SAR) (see example in Figure 12a ) and ocean color sensors. Figure 23 is an example of a chlorophyll map derived from the SeaWiFS ocean color sensor.")
11 Environmental Monitoring of Lake Michigan Using CoastWatch Data and JAVA GIS Page 11 of 12 julian day 310, hour 17 minute 40 (GMT), and was acquired by NOAA-16, covers the Great Lakes region, synoptic (all lakes) scene, and is a daytime image in CoastWatch format. Figure 23. Chlorophyll Map Derived from SeaWiFS Image. Provided by the SeaWiFS Project, NASA/Goddard Space Flight Center and ORBIMAGE [Back to Table of Contents] References Kidwell, K.B. (ed.), NOAA Polar Orbiter Data Users Guide (TIROS-N, NOAA-6, NOAA-7, NOAA-8, NOAA-9, NOAA-10, NOAA-11, NOAA-12). National Environmental Satellite, Data and Information Service, National Climatic Data Center, Satellite Data Services Division, Washington, D.C pp Koczor, R.J., Multispectral sensing with the AVHRR. ITT Aerospace Optical Division, Fort Wayne, Indiana, 9pp. (presented at the North American NOAA Polar Orbiters Users Group Meeting, Boulder, Colorado, July, 1987). Leshkevich, G.A., Schwab, D.J. and Muhr, G.C., Satellite Environmental Monitoring of the Great Lakes: A Review of NOAA's Great Lakes CoastWatch Program. Photogrammetric Engineering & Remote Sensing 59(3): (1993). Leshkevich, G.A., Schwab, D.J. and Muhr, G.C., Satellite environmental monitoring of the Great Lakes: Great Lakes CoastWatch Program update. Marine Technology Society Journal 30(4): Maturi, E.M., and Pichel, W.G Cloud masking for CoastWatch satellite imagery. In Engeering in Harmony with the Oceans, Oceans '93, Volume II, pp Pichel, W., Weaks, M., Sapper, J., Tadepalli, K., Jandhyala, A., and Ketineni, S., Satellite mapped imagery for CoastWatch. In Proceedings, 7th Symposium on Coast & Ocean Management, pp Long Beach, ASCE. Pyke, T.N., CoastWatch: New mission for NOAA weather satellites. Sea Technology 30(4): Schwab, D.J., Leshkevich, G.A., and Muhr, G.C., Satellite measurements of surface water temperature in the Great Lakes - Great Lakes CoastWatch. Journal of Great Lakes Research 18(2): (1992). 10/5/2002
![Provided by the SeaWiFS Project, NASA/Goddard Space Flight Center and ORBIMAGE [Back to Table of Contents] References Kidwell, K.B. (ed.), 1991.](/docs-images/44/15308368/images/page_11.jpg "NOAA Polar Orbiter Data Users Guide (TIROS-N, NOAA-6, NOAA-7, NOAA-8, NOAA-9, NOAA-10, NOAA-11, NOAA-12).")
12 Environmental Monitoring of Lake Michigan Using CoastWatch Data and JAVA GIS Page 12 of 12 Schwab, D.J., Leshkevich, G.A., and Muhr, G.C., Automated Mapping of Surface Water Temperature in the Great Lakes. Journal of Great Lakes Research 25(3): Author George A. Leshkevich NOAA/ Great Lakes Environmental Research Laboratory 2205 Commonwealth Blvd. Ann Arbor, MI Co-Author Songzhi Liu Cooperative Institute for Limnology and Ecosystems Research University of Michigan 2200 Bonisteel Blvd. Ann Arbor, MI * GLERL Contribution Number 1218 LESHKEVICH, G.A., and S.V. LIU. Environmental Monitoring of Lake Michigan using CoastWatch data and JAVA GIS. Proceedings, Lake Michigan: State of the Lake 2001, Muskegon, MI, November 6-7, U.S. EPA Lake Michigan Forum, Grand Valley State University, Annis, Water Resources Institute (2002).

13

14 Figure 1.

15 Figure 2.

16 Figure 4.
17 Figure 6.

18 Figure 7.

19 Figure 8.
20 Figure 9.
21 Figure 10.
22 Figure 11.
23 Figure 11b.
24 Figure 12a.
25 Figure 12.
26 Figure 13.
27 Figure 14.
28 Figure 16.
29 Figure 18.
30 Figure 19.
31 Figure 20.
32 Figure 21.
33 Figure 22.
34 Figure 23.
NCDC s SATELLITE DATA, PRODUCTS, and SERVICES
 **** NCDC s SATELLITE DATA, PRODUCTS, and SERVICES Satellite data and derived products from NOAA s satellite systems are available through the National Climatic Data Center. The two primary systems are
Joint Polar Satellite System (JPSS)
") Joint Polar Satellite System (JPSS) John Furgerson, User Liaison Joint Polar Satellite System National Environmental Satellite, Data, and Information Service National Oceanic and Atmospheric Administration
Joint Polar Satellite System (JPSS) John Furgerson, User Liaison Joint Polar Satellite System National Environmental Satellite, Data, and Information Service National Oceanic and Atmospheric Administration
Daily High-resolution Blended Analyses for Sea Surface Temperature
 Daily High-resolution Blended Analyses for Sea Surface Temperature by Richard W. Reynolds 1, Thomas M. Smith 2, Chunying Liu 1, Dudley B. Chelton 3, Kenneth S. Casey 4, and Michael G. Schlax 3 1 NOAA National
Satellite SST Product Development Proposal
 Call for Proposals under the IMOS (EIF) Five Year Strategy: Enhancement or extension of IMOS July 2009 to June 2013 Satellite SST Products Sub-Facility Plan Overview: Proposed Infrastructure Investment:
16 th IOCCG Committee annual meeting. Plymouth, UK 15 17 February 2011. mission: Present status and near future
 16 th IOCCG Committee annual meeting Plymouth, UK 15 17 February 2011 The Meteor 3M Mt satellite mission: Present status and near future plans MISSION AIMS Satellites of the series METEOR M M are purposed
Clear Sky Radiance (CSR) Product from MTSAT-1R. UESAWA Daisaku* Abstract
 Product from MTSAT-1R. UESAWA Daisaku* Abstract") Clear Sky Radiance (CSR) Product from MTSAT-1R UESAWA Daisaku* Abstract The Meteorological Satellite Center (MSC) has developed a Clear Sky Radiance (CSR) product from MTSAT-1R and has been disseminating
Clear Sky Radiance (CSR) Product from MTSAT-1R UESAWA Daisaku* Abstract The Meteorological Satellite Center (MSC) has developed a Clear Sky Radiance (CSR) product from MTSAT-1R and has been disseminating
Hyperspectral Satellite Imaging Planning a Mission
 Hyperspectral Satellite Imaging Planning a Mission Victor Gardner University of Maryland 2007 AIAA Region 1 Mid-Atlantic Student Conference National Institute of Aerospace, Langley, VA Outline Objective
Estimating Firn Emissivity, from 1994 to1998, at the Ski Hi Automatic Weather Station on the West Antarctic Ice Sheet Using Passive Microwave Data
 Estimating Firn Emissivity, from 1994 to1998, at the Ski Hi Automatic Weather Station on the West Antarctic Ice Sheet Using Passive Microwave Data Mentor: Dr. Malcolm LeCompte Elizabeth City State University
Studying cloud properties from space using sounder data: A preparatory study for INSAT-3D
 Studying cloud properties from space using sounder data: A preparatory study for INSAT-3D Munn V. Shukla and P. K. Thapliyal Atmospheric Sciences Division Atmospheric and Oceanic Sciences Group Space Applications
Remote Sensing Satellite Information Sheets Geophysical Institute University of Alaska Fairbanks
 Remote Sensing Satellite Information Sheets Geophysical Institute University of Alaska Fairbanks ASTER Advanced Spaceborne Thermal Emission and Reflection Radiometer AVHRR Advanced Very High Resolution
COASTAL WIND ANALYSIS BASED ON ACTIVE RADAR IN QINGDAO FOR OLYMPIC SAILING EVENT
 COASTAL WIND ANALYSIS BASED ON ACTIVE RADAR IN QINGDAO FOR OLYMPIC SAILING EVENT XIAOMING LI a, b, * a Remote Sensing Technology Institute, German Aerospace Center (DLR), Oberpfaffenhofen, 82234, Germany
Suomi / NPP Mission Applications Workshop Meeting Summary
 Suomi / NPP Mission Applications Workshop Meeting Summary Westin City Center, Washington, DC June 21-22, 2012 Draft Report (updated March 12, 2013) I. Background The Suomi National Polar- orbiting Partnership
Temporal variation in snow cover over sea ice in Antarctica using AMSR-E data product
 Temporal variation in snow cover over sea ice in Antarctica using AMSR-E data product Michael J. Lewis Ph.D. Student, Department of Earth and Environmental Science University of Texas at San Antonio ABSTRACT
A remote sensing instrument collects information about an object or phenomenon within the
 Satellite Remote Sensing GE 4150- Natural Hazards Some slides taken from Ann Maclean: Introduction to Digital Image Processing Remote Sensing the art, science, and technology of obtaining reliable information
Slide 1. Slide 2. Slide 3
 Satellite Analysis of Sea Surface Temperatures in the Florida Keys to Monitor Coral Reef Health NASA Stennis Space Center Earthzine/DEVELOP Virtual Poster Session, Summer 2011 Video Transcript Slide 1
McIDAS-V Tutorial Displaying Polar Satellite Imagery updated September 2015 (software version 1.5)
") McIDAS-V Tutorial Displaying Polar Satellite Imagery updated September 2015 (software version 1.5) McIDAS-V is a free, open source, visualization and data analysis software package that is the next generation
McIDAS-V Tutorial Displaying Polar Satellite Imagery updated September 2015 (software version 1.5) McIDAS-V is a free, open source, visualization and data analysis software package that is the next generation
Clouds and the Energy Cycle
 August 1999 NF-207 The Earth Science Enterprise Series These articles discuss Earth's many dynamic processes and their interactions Clouds and the Energy Cycle he study of clouds, where they occur, and
The NASA NEESPI Data Portal to Support Studies of Climate and Environmental Changes in Non-boreal Europe
 The NASA NEESPI Data Portal to Support Studies of Climate and Environmental Changes in Non-boreal Europe Suhung Shen NASA Goddard Space Flight Center/George Mason University Gregory Leptoukh, Tatiana Loboda,
Comparison of NOAA's Operational AVHRR Derived Cloud Amount to other Satellite Derived Cloud Climatologies.
 Comparison of NOAA's Operational AVHRR Derived Cloud Amount to other Satellite Derived Cloud Climatologies. Sarah M. Thomas University of Wisconsin, Cooperative Institute for Meteorological Satellite Studies
Cloud detection and clearing for the MOPITT instrument
 Cloud detection and clearing for the MOPITT instrument Juying Warner, John Gille, David P. Edwards and Paul Bailey National Center for Atmospheric Research, Boulder, Colorado ABSTRACT The Measurement Of
Precipitation Remote Sensing
 Precipitation Remote Sensing Huade Guan Prepared for Remote Sensing class Earth & Environmental Science University of Texas at San Antonio November 14, 2005 Outline Background Remote sensing technique
Scholar: Elaina R. Barta. NOAA Mission Goal: Climate Adaptation and Mitigation
 Development of Data Visualization Tools in Support of Quality Control of Temperature Variability in the Equatorial Pacific Observed by the Tropical Atmosphere Ocean Data Buoy Array Abstract Scholar: Elaina
Development of an Integrated Data Product for Hawaii Climate
 Development of an Integrated Data Product for Hawaii Climate Jan Hafner, Shang-Ping Xie (PI)(IPRC/SOEST U. of Hawaii) Yi-Leng Chen (Co-I) (Meteorology Dept. Univ. of Hawaii) contribution Georgette Holmes
Near Real Time Blended Surface Winds
 Near Real Time Blended Surface Winds I. Summary To enhance the spatial and temporal resolutions of surface wind, the remotely sensed retrievals are blended to the operational ECMWF wind analyses over the
Monitoring Soil Moisture from Space. Dr. Heather McNairn Science and Technology Branch Agriculture and Agri-Food Canada heather.mcnairn@agr.gc.
 Monitoring Soil Moisture from Space Dr. Heather McNairn Science and Technology Branch Agriculture and Agri-Food Canada heather.mcnairn@agr.gc.ca What is Remote Sensing? Scientists turn the raw data collected
Review for Introduction to Remote Sensing: Science Concepts and Technology
 Review for Introduction to Remote Sensing: Science Concepts and Technology Ann Johnson Associate Director ann@baremt.com Funded by National Science Foundation Advanced Technological Education program [DUE
Coral Reef Watch A Satellite View. AE Strong. Satellite SST Anomalies. January 2002 May 2003
 Coral Reef Watch A Satellite View AE Strong Satellite SST Anomalies January 2002 May 2003 Coral Reefs, Climate, and Coral Bleaching Workshop June 18-20, 2003 Turtle Bay, Oahu, HI NOAA s Program Leaders:
High Resolution Information from Seven Years of ASTER Data
 High Resolution Information from Seven Years of ASTER Data Anna Colvin Michigan Technological University Department of Geological and Mining Engineering and Sciences Outline Part I ASTER mission Terra
IMPACTS OF IN SITU AND ADDITIONAL SATELLITE DATA ON THE ACCURACY OF A SEA-SURFACE TEMPERATURE ANALYSIS FOR CLIMATE
 INTERNATIONAL JOURNAL OF CLIMATOLOGY Int. J. Climatol. 25: 857 864 (25) Published online in Wiley InterScience (www.interscience.wiley.com). DOI:.2/joc.68 IMPACTS OF IN SITU AND ADDITIONAL SATELLITE DATA
Automated Spacecraft Scheduling The ASTER Example
 Automated Spacecraft Scheduling The ASTER Example Ron Cohen ronald.h.cohen@jpl.nasa.gov Ground System Architectures Workshop 2002 Jet Propulsion Laboratory The Concept Scheduling by software instead of
Vulnerability assessment of ecosystem services for climate change impacts and adaptation (VACCIA)
") Vulnerability assessment of ecosystem services for climate change impacts and adaptation (VACCIA) Action 2: Derivation of GMES-related remote sensing data Deliverable 1: Time-series of Earth Observation
Vulnerability assessment of ecosystem services for climate change impacts and adaptation (VACCIA) Action 2: Derivation of GMES-related remote sensing data Deliverable 1: Time-series of Earth Observation
Obtaining and Processing MODIS Data
 Obtaining and Processing MODIS Data MODIS is an extensive program using sensors on two satellites that each provide complete daily coverage of the earth. The data have a variety of resolutions; spectral,
CLOUD CLASSIFICATION EXTRACTED FROM AVHRR AND GOES IMAGERY. M.Derrien, H.Le Gléau
 CLOUD CLASSIFICATION EXTRACTED FROM AVHRR AND GOES IMAGERY M.Derrien, H.Le Gléau Météo-France / SCEM / Centre de Météorologie Spatiale BP 147 22302 Lannion. France ABSTRACT We developed an automated pixel-scale
Water Monitoring System Website User Guide www.fldep-stevens.com
 Florida Department of Environmental Protection Division of State Lands Bureau of Survey and Mapping Water Monitoring System Website User Guide www.fldep-stevens.com Provided by Stevens Water Monitoring
Environmental Data Services for Delaware:
 Environmental Data Services for Delaware: Serving Emergency Responders, Planners, and Researchers Network Delaware Day November 6, 2013 Overview Operational Data Services More than just research DEOS and
Authors: Thierry Phulpin, CNES Lydie Lavanant, Meteo France Claude Camy-Peyret, LPMAA/CNRS. Date: 15 June 2005
 Comments on the number of cloud free observations per day and location- LEO constellation vs. GEO - Annex in the final Technical Note on geostationary mission concepts Authors: Thierry Phulpin, CNES Lydie
Active and Passive Microwave Remote Sensing
 Active and Passive Microwave Remote Sensing Passive remote sensing system record EMR that was reflected (e.g., blue, green, red, and near IR) or emitted (e.g., thermal IR) from the surface of the Earth.
Digital Remote Sensing Data Processing Digital Remote Sensing Data Processing and Analysis: An Introduction and Analysis: An Introduction
 Digital Remote Sensing Data Processing Digital Remote Sensing Data Processing and Analysis: An Introduction and Analysis: An Introduction Content Remote sensing data Spatial, spectral, radiometric and
Overview of the IR channels and their applications
 Ján Kaňák Slovak Hydrometeorological Institute Jan.kanak@shmu.sk Overview of the IR channels and their applications EUMeTrain, 14 June 2011 Ján Kaňák, SHMÚ 1 Basics in satellite Infrared image interpretation
USING THE GOES 3.9 µm SHORTWAVE INFRARED CHANNEL TO TRACK LOW-LEVEL CLOUD-DRIFT WINDS ABSTRACT
 USING THE GOES 3.9 µm SHORTWAVE INFRARED CHANNEL TO TRACK LOW-LEVEL CLOUD-DRIFT WINDS Jason P. Dunion 1 and Christopher S. Velden 2 1 NOAA/AOML/Hurricane Research Division, 2 UW/CIMSS ABSTRACT Low-level
Coastal Research Proposal Abstracts
 Coastal Research Proposal Abstracts An Automated Data Analysis, Processing, and Management System Proposal to NASA with SAIC Total Budget $15K Submitted 10/31/2008 The goal of this study is to design,
Monitoring of Arctic Conditions from a Virtual Constellation of Synthetic Aperture Radar Satellites
 DISTRIBUTION STATEMENT A. Approved for public release; distribution is unlimited. Monitoring of Arctic Conditions from a Virtual Constellation of Synthetic Aperture Radar Satellites Hans C. Graber RSMAS
Huai-Min Zhang & NOAAGlobalTemp Team
 Improving Global Observations for Climate Change Monitoring using Global Surface Temperature (& beyond) Huai-Min Zhang & NOAAGlobalTemp Team NOAA National Centers for Environmental Information (NCEI) [formerly:
How To Find Natural Oil Seepage In The Dreki Area Using An Envisat Image
 rn ORKUSTOFNUN National Energy Authority Searching for natural oil seepage in the Dreki area using ENVISAT radar images. Ingibjorg J6nsd6ttir and Arni Freyr Valdimarsson, Faculty of Earth Sciences School
VIIRS-CrIS mapping. NWP SAF AAPP VIIRS-CrIS Mapping
 NWP SAF AAPP VIIRS-CrIS Mapping This documentation was developed within the context of the EUMETSAT Satellite Application Facility on Numerical Weather Prediction (NWP SAF), under the Cooperation Agreement
3.4 Cryosphere-related Algorithms
 3.4 Cryosphere-related Algorithms GLI Algorithm Description 3.4.-1 3.4.1 CTSK1 A. Algorithm Outline (1) Algorithm Code: CTSK1 (2) Product Code: CLFLG_p (3) PI Name: Dr. Knut Stamnes (4) Overview of Algorithm
Radiative effects of clouds, ice sheet and sea ice in the Antarctic
 Snow and fee Covers: Interactions with the Atmosphere and Ecosystems (Proceedings of Yokohama Symposia J2 and J5, July 1993). IAHS Publ. no. 223, 1994. 29 Radiative effects of clouds, ice sheet and sea
Monitoring a Changing Environment with Synthetic Aperture Radar. Alaska Satellite Facility National Park Service Don Atwood
 Monitoring a Changing Environment with Synthetic Aperture Radar Don Atwood Alaska Satellite Facility 1 Entering the SAR Age 2 SAR Satellites RADARSAT-1 Launched 1995 by CSA 5.6 cm (C-Band) HH Polarization
DISMAR: Data Integration System for Marine Pollution and Water Quality
 DISMAR: Data Integration System for Marine Pollution and Water Quality T. Hamre a,, S. Sandven a, É. Ó Tuama b a Nansen Environmental and Remote Sensing Center, Thormøhlensgate 47, N-5006 Bergen, Norway
Principles and Practices of Data Integration
 Data Integration Data integration is the process of combining data of different themes, content, scale or spatial extent, projections, acquisition methods, formats, schema, or even levels of uncertainty,
ENVIRONMENTAL MONITORING Vol. I - Remote Sensing (Satellite) System Technologies - Michael A. Okoye and Greg T. Koeln
 System Technologies - Michael A. Okoye and Greg T. Koeln") REMOTE SENSING (SATELLITE) SYSTEM TECHNOLOGIES Michael A. Okoye and Greg T. Earth Satellite Corporation, Rockville Maryland, USA Keywords: active microwave, advantages of satellite remote sensing, atmospheric
REMOTE SENSING (SATELLITE) SYSTEM TECHNOLOGIES Michael A. Okoye and Greg T. Earth Satellite Corporation, Rockville Maryland, USA Keywords: active microwave, advantages of satellite remote sensing, atmospheric
Present Status of Coastal Environmental Monitoring in Korean Waters. Using Remote Sensing Data
 Present Status of Coastal Environmental Monitoring in Korean Waters Using Remote Sensing Data Sang-Woo Kim, Young-Sang Suh National Fisheries Research & Development Institute #408-1, Shirang-ri, Gijang-up,
NASA Earth System Science: Structure and data centers
 SUPPLEMENT MATERIALS NASA Earth System Science: Structure and data centers NASA http://nasa.gov/ NASA Mission Directorates Aeronautics Research Exploration Systems Science http://nasascience.nasa.gov/
Advances in Cloud Imager Remote Sensing
 Advances in Cloud Imager Remote Sensing Andrew Heidinger NOAA/NESDIS/ORA Madison, Wisconsin With material from Mike Pavolonis, Robert Holz, Amato Evan and Fred Nagle STAR Science Symposium November 9,
Ocean Level-3 Standard Mapped Image Products June 4, 2010
 Ocean Level-3 Standard Mapped Image Products June 4, 2010 1.0 Introduction This document describes the specifications of Ocean Level-3 standard mapped archive products that are produced and distributed
Lake Monitoring in Wisconsin using Satellite Remote Sensing
 Lake Monitoring in Wisconsin using Satellite Remote Sensing D. Gurlin and S. Greb Wisconsin Department of Natural Resources 2015 Wisconsin Lakes Partnership Convention April 23 25, 2105 Holiday Inn Convention
HFIP Web Support and Display and Diagnostic System Development
 HFIP Web Support and Display and Diagnostic System Development Paul A. Kucera, Tatiana Burek, and John Halley-Gotway NCAR/Research Applications Laboratory HFIP Annual Meeting Miami, FL 18 November 2015
Real-time Ocean Forecasting Needs at NCEP National Weather Service
 Real-time Ocean Forecasting Needs at NCEP National Weather Service D.B. Rao NCEP Environmental Modeling Center December, 2005 HYCOM Annual Meeting, Miami, FL COMMERCE ENVIRONMENT STATE/LOCAL PLANNING HEALTH
GLOBAL FORUM London, October 24 & 25, 2012
 GLOBAL FORUM London, October 24 & 25, 2012-1 - Global Observations of Gas Flares Improving Global Observations of Gas Flares With Data From the Suomi NPP Visible Infrared Imaging Radiometer Suite (VIIRS)
Volcanic Ash Monitoring: Product Guide
 Doc.No. Issue : : EUM/TSS/MAN/15/802120 v1a EUMETSAT Eumetsat-Allee 1, D-64295 Darmstadt, Germany Tel: +49 6151 807-7 Fax: +49 6151 807 555 Date : 2 June 2015 http://www.eumetsat.int WBS/DBS : EUMETSAT
Ensuring the Preparedness of Users: NOAA Satellites GOES R, JPSS Laura K. Furgione
 Ensuring the Preparedness of Users: NOAA Satellites GOES R, JPSS Laura K. Furgione U.S. Permanent Representative with the WMO Deputy Director, NOAA s s National Weather Service WMO Executive Council 65
RESULTS FROM A SIMPLE INFRARED CLOUD DETECTOR
 RESULTS FROM A SIMPLE INFRARED CLOUD DETECTOR A. Maghrabi 1 and R. Clay 2 1 Institute of Astronomical and Geophysical Research, King Abdulaziz City For Science and Technology, P.O. Box 6086 Riyadh 11442,
The distribution of marine OpenData via distributed data networks and Web APIs. The example of ERDDAP, the message broker and data mediator from NOAA
 The distribution of marine OpenData via distributed data networks and Web APIs. The example of ERDDAP, the message broker and data mediator from NOAA Dr. Conor Delaney 9 April 2014 GeoMaritime, London
LANDSAT 7 - GROUND SEGMENT ACTIVITIES AT THE GERMAN REMOTE SENSING DATA CENTER. Deutsches Fernerkundungsdatenzentrum (DFD) DLR (*)
 DLR (*)") LANDSAT 7 - GROUND SEGMENT ACTIVITIES AT THE GERMAN REMOTE SENSING DATA CENTER Günter Strunz (*), Hans-Dietrich Bettac (**), Jörg Gredel (*), Klaus-Dieter Reiniger (*) & Gunter Schreier (*) Deutsches Fernerkundungsdatenzentrum
LANDSAT 7 - GROUND SEGMENT ACTIVITIES AT THE GERMAN REMOTE SENSING DATA CENTER Günter Strunz (*), Hans-Dietrich Bettac (**), Jörg Gredel (*), Klaus-Dieter Reiniger (*) & Gunter Schreier (*) Deutsches Fernerkundungsdatenzentrum
Monitoring of Arctic Conditions from a Virtual Constellation of Synthetic Aperture Radar Satellites
 DISTRIBUTION STATEMENT A. Approved for public release; distribution is unlimited. Monitoring of Arctic Conditions from a Virtual Constellation of Synthetic Aperture Radar Satellites Hans C. Graber RSMAS
P1.21 GOES CLOUD DETECTION AT THE GLOBAL HYDROLOGY AND CLIMATE CENTER
 P1.21 GOES CLOUD DETECTION AT THE GLOBAL HYDROLOGY AND CLIMATE CENTER Gary J. Jedlovec* NASA/MSFC/Global Hydrology and Climate Center National Space Science and Technology Center Huntsville, Alabama and
Straits of Mackinac Contaminant Release Scenarios: Flow Visualization and Tracer Simulations
 Straits of Mackinac Contaminant Release Scenarios: Flow Visualization and Tracer Simulations Research Report for the National Wildlife Federation Great Lakes Regional Center By David J. Schwab, Ph.D.,
Monitoring Global Crop Condition Indicators Using a Web-Based Visualization Tool
 Monitoring Global Crop Condition Indicators Using a Web-Based Visualization Tool Bob Tetrault, Regional Commodity Analyst, and Bob Baldwin, GIS Specialist, USDA, Foreign Agricultural Service, Washington,
Geography affects climate.
 KEY CONCEPT Climate is a long-term weather pattern. BEFORE, you learned The Sun s energy heats Earth s surface unevenly The atmosphere s temperature changes with altitude Oceans affect wind flow NOW, you
SAMPLE MIDTERM QUESTIONS
 Geography 309 Sample MidTerm Questions Page 1 SAMPLE MIDTERM QUESTIONS Textbook Questions Chapter 1 Questions 4, 5, 6, Chapter 2 Questions 4, 7, 10 Chapter 4 Questions 8, 9 Chapter 10 Questions 1, 4, 7
SAFNWC/MSG Cloud type/height. Application for fog/low cloud situations
 SAFNWC/MSG Cloud type/height. Application for fog/low cloud situations 22 September 2011 Hervé LE GLEAU, Marcel DERRIEN Centre de météorologie Spatiale. Lannion Météo-France 1 Fog or low level clouds?
8. Communications Subsystem
 PM-1.1-03 Rev C 8. Communications Subsystem The GOES-NOP spacecraft communications subsystem provides requisite conditioning, transmission, reception, and routing of mission data signals and telemetry
MI oceanographic data
 Marine Institute Oceanographic Data SMARTSkills 2013 Postgraduate Workshop Galway, Oct 2013 Kieran Lyons (kieran.lyons@marine.ie) MI oceanographic data Measured Operational metocean time series (weather
Update on EUMETSAT ocean colour services. Ewa J. Kwiatkowska
 Update on EUMETSAT ocean colour services Ewa J. Kwiatkowska 1 st International Ocean Colour Science meeting, 6 8 May, 2013 EUMETSAT space data provider for operational oceanography Operational data provider
National Data Buoy Center Cooperative Relations
 National Data Buoy Center Cooperative Relations Presentation For NGI Annual Conference May 23, 2012 Landry Bernard National Data Buoy Center Operational Mission To provide a real-time, end-to-end capability
NOAA Satellite Proving Ground Training and User Engagement
 NOAA Satellite Proving Ground Training and User Engagement Tony Mostek and Brian Motta (NWS) Wendy Abshire (COMET) Update September 2012 VISIT Training Sessions in 2012 TROWAL Identification (winter weather
PETROBRAS Orbital Sea Surface Monitoring
 PETROBRAS Orbital Sea Surface Monitoring Performed by : Contingency Control - Exploration & Production Area Technical support: R&D Center Cristina Bentz PETROBRAS R&D Center Environment Assessment and
THE GOCI INSTRUMENT ON COMS MISSION THE FIRST GEOSTATIONARY OCEAN COLOR IMAGER
 THE GOCI INSTRUMENT ON COMS MISSION THE FIRST GEOSTATIONARY OCEAN COLOR IMAGER Topic 1 - Optical instruments for Earth / Planets surface and atmosphere study François FAURE, Astrium SAS Satellite, Toulouse,
Our Antarctic Facilities
 Our Antarctic Facilities Australian Activities in Antarctica Tony Worby IICWG Chile, October 2014 3 days Macquarie Island Wilkins aerodrome Hobart is Australia s Gateway to East Antarctica and the Southern
Assessing Cloud Spatial and Vertical Distribution with Infrared Cloud Analyzer
 Assessing Cloud Spatial and Vertical Distribution with Infrared Cloud Analyzer I. Genkova and C. N. Long Pacific Northwest National Laboratory Richland, Washington T. Besnard ATMOS SARL Le Mans, France
ESCI 107/109 The Atmosphere Lesson 2 Solar and Terrestrial Radiation
 ESCI 107/109 The Atmosphere Lesson 2 Solar and Terrestrial Radiation Reading: Meteorology Today, Chapters 2 and 3 EARTH-SUN GEOMETRY The Earth has an elliptical orbit around the sun The average Earth-Sun
Reprojecting MODIS Images
 Reprojecting MODIS Images Why Reprojection? Reasons why reprojection is desirable: 1. Removes Bowtie Artifacts 2. Allows geographic overlays (e.g. coastline, city locations) 3. Makes pretty pictures for
Generation of Cloud-free Imagery Using Landsat-8
 Generation of Cloud-free Imagery Using Landsat-8 Byeonghee Kim 1, Youkyung Han 2, Yonghyun Kim 3, Yongil Kim 4 Department of Civil and Environmental Engineering, Seoul National University (SNU), Seoul,
Chapter Contents Page No
 Chapter Contents Page No Preface Acknowledgement 1 Basics of Remote Sensing 1 1.1. Introduction 1 1.2. Definition of Remote Sensing 1 1.3. Principles of Remote Sensing 1 1.4. Various Stages in Remote Sensing
A Wireless Internet-Based Observatory: The Real-time Coastal Observation Network (ReCON)
") A Wireless Internet-Based Observatory: The Real-time Coastal Observation Network (ReCON) S. A. Ruberg, R. W. Muzzi, S. B. Brandt, J. C. Lane, T. C. Miller National Oceanic and Atmospheric Administration
A Wireless Internet-Based Observatory: The Real-time Coastal Observation Network (ReCON) S. A. Ruberg, R. W. Muzzi, S. B. Brandt, J. C. Lane, T. C. Miller National Oceanic and Atmospheric Administration
A Mariner s Guide to Marine Weather Services Great Lakes
 A Mariner s Guide to Marine Weather Services Great Lakes U.S. DEPARTMENT OF COMMERCE National Oceanic and Atmospheric Administration National Weather Service NOAA PA 98053 Introduction Few people are affected
Combining Satellite High Frequency Microwave Radiometer & Surface Cloud Radar Data for Determination of Large Scale 3 D Cloud IWC 서은경
 11/21/2008 제9회 기상레이더 워크숍 Combining Satellite High Frequency Microwave Radiometer & Surface Cloud Radar Data for Determination of Large Scale 3 D Cloud IWC 서은경 공주대학교 지구과학교육과 Objective: To retrieve large
SIXTH GRADE WEATHER 1 WEEK LESSON PLANS AND ACTIVITIES
 SIXTH GRADE WEATHER 1 WEEK LESSON PLANS AND ACTIVITIES WATER CYCLE OVERVIEW OF SIXTH GRADE WATER WEEK 1. PRE: Evaluating components of the water cycle. LAB: Experimenting with porosity and permeability.
International coordination for continuity and interoperability: a CGMS perspective
 International coordination for continuity and interoperability: a CGMS perspective Peng Zhang, CGMS WG-III Co-Chair NSMC/CMA In Cooperation with Suzanne Hilding, CGMS WG-III Co-Chair OPPA/NESDIS/NOAA 1
SLSTR Breakout Summary - Gary Corlett (22/03/2012)
") SLSTR Breakout Summary - Gary Corlett (22/03/2012) [Updated 16/04/2012 with post meeting comments from Gorm Dybkjær, Simon hook and David Meldrum] The breakout session started with a clean slate and identified
SLSTR Breakout Summary - Gary Corlett (22/03/2012) [Updated 16/04/2012 with post meeting comments from Gorm Dybkjær, Simon hook and David Meldrum] The breakout session started with a clean slate and identified
Earth remote sensing systems of middle and low resolution
 Earth remote sensing systems of middle and low resolution Serial on-line remote sensing satellites delivering data available on the world market V.I. Gershenzon (ScanEx R&D Center) In 1980, graduated from
Monitoring of Arctic Conditions from a Virtual Constellation of Synthetic Aperture Radar Satellites
 DISTRIBUTION STATEMENT A. Approved for public release; distribution is unlimited. Monitoring of Arctic Conditions from a Virtual Constellation of Synthetic Aperture Radar Satellites RSMAS Department of
Satellite Snow Monitoring Activities Project CRYOLAND
 Satellite Snow Monitoring Activities Project CRYOLAND Background material for participants to the Workshop on European Snow Monitoring Perspectives, Darmstadt, 4-5 December 2012. CryoLand provides Snow,
Coral Bleaching Alert System
 Coral Bleaching Alert System Technical Document Indian National Centre for Ocean Information Services (INCOIS) Hyderabad 2011 Contents Page No. 1. Introduction...1 1. Objective...2 2. Study Area...2 3.
Validating MOPITT Cloud Detection Techniques with MAS Images
 Validating MOPITT Cloud Detection Techniques with MAS Images Daniel Ziskin, Juying Warner, Paul Bailey, John Gille National Center for Atmospheric Research, P.O. Box 3000, Boulder, CO 80307 ABSTRACT The
163 ANALYSIS OF THE URBAN HEAT ISLAND EFFECT COMPARISON OF GROUND-BASED AND REMOTELY SENSED TEMPERATURE OBSERVATIONS
 ANALYSIS OF THE URBAN HEAT ISLAND EFFECT COMPARISON OF GROUND-BASED AND REMOTELY SENSED TEMPERATURE OBSERVATIONS Rita Pongrácz *, Judit Bartholy, Enikő Lelovics, Zsuzsanna Dezső Eötvös Loránd University,
EUMETSAT Satellite Programmes
 EUMETSAT Satellite Programmes Nowcasting Applications Developing Countries Marianne König marianne.koenig@eumetsat.int WSN-12 Rio de Janeiro 06-10 August 2012 27 Member States & 4 Cooperating States Member
VALIDATION OF SAFNWC / MSG CLOUD PRODUCTS WITH ONE YEAR OF SEVIRI DATA
 VALIDATION OF SAFNWC / MSG CLOUD PRODUCTS WITH ONE YEAR OF SEVIRI DATA M.Derrien 1, H.Le Gléau 1, Jean-François Daloze 2, Martial Haeffelin 2 1 Météo-France / DP / Centre de Météorologie Spatiale. BP 50747.
Active Fire Monitoring: Product Guide
 Active Fire Monitoring: Product Guide Doc.No. Issue : : EUM/TSS/MAN/15/801989 v1c EUMETSAT Eumetsat-Allee 1, D-64295 Darmstadt, Germany Tel: +49 6151 807-7 Fax: +49 6151 807 555 Date : 14 April 2015 http://www.eumetsat.int
How Landsat Images are Made
 How Landsat Images are Made Presentation by: NASA s Landsat Education and Public Outreach team June 2006 1 More than just a pretty picture Landsat makes pretty weird looking maps, and it isn t always easy