Performance Measures for RIDOT s Traffic Management Center
|
|
|
- Erik Bradley
- 10 years ago
- Views:
Transcription
1 Performance Measures for RIDOT s Traffic Management Center Catherine Burns, EIT Transportation Engineer Sudhir Murthy, PE, PTOE President 5/2011


2 Presentation Outline RIDOT Performance Measures Public Outreach Lessons Learned Rhode Island Department of Transportation TMC vision, mission statement and goals Performance Measures Metrics, data sources, conclusions and internal presentation Online Reporting Developing traveler tools online for commuters and special events Lessons Learned Sensor placement and operator training RIDOT

3 Rhode Island Traffic Management Center TMC Mission To maintain and provide a safe, efficient, environmentally, aesthetically and culturally sensitive intermodal transportation network that offers a variety of convenient, cost effective mobility opportunities for people and the movement of goods to support economic development and an improved quality of life. RIDOT

4 Performance Measure Selection Criteria Follow FHWA/AASHTO recommendations Support the TMC s mission statement Ability to compute periodically Help improve safety and traffic operations Demonstrate the benefits derived from ITS Data must be Reliable Readily Available Performance Measures

5 LIST OF PERFORMANCE MEASURES Initial Future Performance Measure Definition Units Reporting Frequency Data Source Remarks Incident Management (Reported for each highway segment) Incident Clearance Time (for all incidents) Time from when incident is verified (reported) to the time the responders leave the scene and/or incident is declared as cleared. Minutes Monthly RIDOT TMC Database - Incidents FHWA Focus States Initiative TIM Final Report Roadway Clearance Time (for incidents with lane closure) Time from when incident is verified (reported) to the time when lanes are available to traffic Minutes Monthly RIDOT TMC Database - Incidents FHWA Focus States Initiative TIM Final Report Number of secondary crashes Number of crashes from time when primary incident is verified (reported) to the time when incident is declared as cleared, either at scene or in the queued section of highway in both directions None Yearly RIDOT TMC Data base - Incidents & RIDOT EARS Crash Database FHWA Focus States Initiative TIM Final Report. Crash Database late by one year. Incident Dispatch Time Time from when incident is verified (reported) to time when TMC personnel are dispatched to the scene Minutes Monthly RIDOT TMC Database Dispatch Will show how soon the TMC responded Incident Response Time Time from when incident is verified ( reported) to time when first responders arrive on scene Minutes Monthly RIDOT TMC Database Incidents Will show how soon the responders personnel arrived on scene Incident Recovery Time Time from when incident is declared to be cleared to the time when average speeds return to 95% of historic levels Minutes Monthly RIDOT TMC Database - Incidents & CMD DataCollector Shows the level of impact from an incident Incident Notification Time Time from when incident is verified (reported) to the time when motorists are notified either via DMS/VMS or via 511 Minutes Monthly RIDOT TMC Database - Incidents & Daktronix Vanguard Datbase & CARS 511 Database Shows the level of response of the TMC Number of Incidents Total number of incidents by type reported None Monthly RIDOT TMC Database Incidents Surrogate measure for overall safety of the highway segment Travel Time Reliability (Reported for each highway segment for Weekday AM Period (6: AM), Weekday PM Period (3:00-7:00 PM) 95%ile travel time 95 th percentile travel time Minutes Monthly CMD DataCollector/CMD DataViewer FHWA Travel Time Reliability Planning Time Index Ratio of 95 th percentile travel time to free flow travel time None Monthly CMD DataCollector/CMD DataViewer FHWA Travel Time Reliability Buffer Index Ratio of difference between 95 th percentile travel time and average None Monthly CMD DataCollector/CMD DataViewer FHWA Travel Time Reliability travel time to average travel time Frequency of Congestion Percent of time when sensor occupancy greater than 30-40% None Monthly CMD DataCollector/CMD DataViewer FHWA Travel Time Reliability Customer Satisfaction Level of customer satisfaction with the RIDOTs traveler information system including DMS and 511 % Annually User survey results collected through the TMC website Safety Management (Reported for each highway segment) Crash Rate Total annual crashes per 100 million vehicle-miles #/100MMV Annually RIDOT EARS Crash Database & RIDOT HPMS Database Level of satisfaction and effectiveness of traveler information AASHTO Recommended; But ADT and Crash data will be 1 year old Work Zone Monitoring Percent of total number of construction projects with ITS monitoring % Annually?????? Level of ITS monitoring of work zones Work Zone Travel Time Travel Time Reliability Indices as listed above None Annually RIDOT Construction Projects & CMD Delay impacts of work zones Reliability Indices DataCollector & CMD DataViewer Traveler Information (Reported Statewide) Number of 511 Calls Number of calls received by RI 511 # Monthly RIDOT 511 Usage level Number of 511 Website Hits Number of visits to the 511 website # Monthly CARS???? Usage level Number of TMC Website Hits Number of visits to the TMC Website # Monthly TMC Website Usage level System Performance & Maintenance (Reported Statewide) Percent CL Miles of Highway Network Covered Percent of total centerline miles of the highway network the is covered % Annually RIDOT GIS Database Coverage of ITS devices and services ITS Device Percent Uptime Ratio of amount of time an ITS device is operational, not including % Quarterly RIDOT TMC Database Devices Reliability of ITS devices planned or preventative maintenance and upgrade to total time in the reporting period TMC System Availability Percent of time when the systems at the TMC was operational and available for use by the operators % Annually????? Reliability of the systems in the TMC Mean Time Between Failures Average of time between failures of ITS devices Days Annually RIDOT TMC Database Devices Reliability of ITS devices


6 RIDOT Data Sources TMC Wavetronix Sensor Data Planned and Unplanned Incident Database External Crash Data Traffic.com Sensor Data Performance Measures


7 Metrics and Geographic Scope Travel Time Reliability Measures Average Travel Time 95 th %tile Travel Time Planning Index Buffer Index Congestion Frequency Incident Clearance Time Crash Rate ITS Equipment Uptime Performance Measures

8 Travel Time Reliability Indices FHWA encourages travel time reliability indices be included as part of an overall performance program: Currently used measures of congestion are inadequate for determining the true impact of the congestion that clogs up the transportation system from a user s perspective. And that they are not able to adequately measure the impacts of congestion mitigation strategies. Performance Measures

9 Travel Time Reliability Indices 95%ile Travel Time-How much delay will be on the heaviest travel days. Travel time Index-Average time it takes to travel during peak hours compared to free flow conditions. Buffer Index- Represents the extra buffer time (or time cushion) that most travelers add to their average travel time when planning trips to ensure ontime arrival. Planning Time Index-Represents the total travel time that should be planned when an adequate buffer time is included. Performance Measures


10 Travel Time Reliability Indices FHWA Example of Speed Profile vs. Buffer Index Profile Performance Measures

11 Speed (mph) Peak Periods Reviewed Reports Sensor Speed Profiles Speed Profile, April 24-28, 2010 Northbound (.3 mi N of DT Providence) :00:00 AM 6:00:00 AM 12:00:00 PM 6:00:00 PM 12:00:00 AM Sunday N Speed Limit Wednesday N Friday N Saturday N Morning 6:30 AM to 9:30 AM Evening 3:30 PM to 6:30 PM Weekend 11AM to 6 PM Performance Measures

12 Sample Reliability Indices Travel Time Reliability Indices Average Travel Time 95th Percentile Buffer Index Planning Index SB NB SB NB SB NB SB NB SB NB SB NB SB NB SB NB AM PM AM PM AM PM AM PM Weekday Friday % 16% 43% 13% % 12% 97% 19% Interpreting the Results Buffer Index - Drivers should allow for an extra 4 minutes on a weekday southbound in the morning and an extra 11 minutes on Fridays in the evening. Planning Index-Drivers should allow for a total trip time of 14 minutes on morning southbound commutes and total trip time of almost 30 minutes southbound in the evening on Fridays. Performance Measures

13 Incident Management Performance Measures Incident Clearance Time: Time from when the incident is verified to the time when the responders leave the scene currently implemented Roadway Clearance Time: Time from when the incident is verified to the time when the lane is opened to traffic (applicable only if incident involved lane closure) for future implementation Data extracted from the TMC Database for 2004 through 2011 Performance Measures
 for future implementation Data extracted from the TMC Database for 2004 through 2011 Performance")
14 Average Incident Duration (min) Incident Clearance Time I-95, Pawtucket, RI Average 0 Jan Feb Mar Apr May Jun Jul Aug Sep Oct Nov Dec Performance Measures


15 Incident Clearance Time Performance Measures

 Utilized Average Daily Traffic (ADT) from sensor data Sample Crash Rate along Test Segment 3.5 3 2.5 2 1.5 1 0.")
16 Safety & Crash Data Performance Measure Crash Rate: Total number of crashes in a year divided by total annual vehicle miles traveled times 100 million Crash records from RIDOT s Electronic Accident Reporting System (EARS) Utilized Average Daily Traffic (ADT) from sensor data Sample Crash Rate along Test Segment Exit 22 Exit 23 Exit 24 Exit 25 Exit 26 Exit 27 Exit 28 Exit 29 Exit 30 Performance Measures

17 Report Internal RIDOT use For each major segment including I-95, I-295, I-195, Route 10/6 Performance Measures


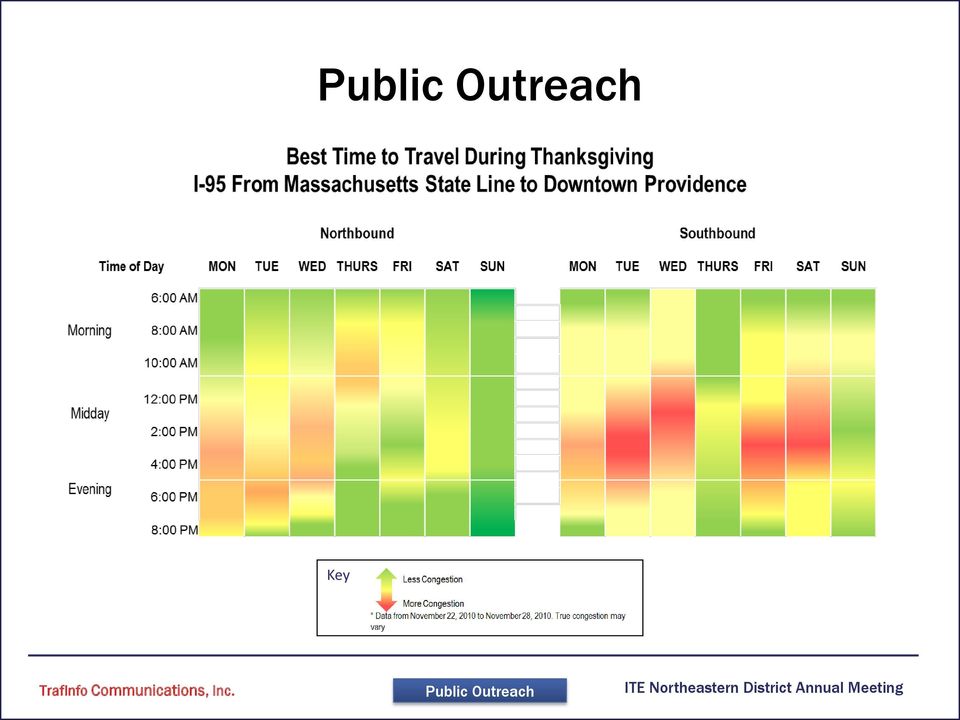
18 Public Outreach Key Public Outreach
19 Lessons Learned Sensor Location Can affect travel time reliability measures Consistency of data from multiple sources Sensor data: May need calibration of sensors Crash and incident data: Needs coordination between TMC operator and Police Operator training Understanding of data definitions Lessons Learned

20 Thank You Catherine Burns Tel: (888) Ext 103 Sudhir Murthy Tel: (888) Ext 101
")
Boston Traffic Management Center Activity Report for FY 2013 Real-time Traffic Signal Adjustments
 Boston Traffic Management Center Activity Report for FY 2013 Real-time Traffic Signal Adjustments The mission of the Traffic Management Center (TMC) within the Boston Transportation Department is to monitor,
Illinois Tollway: Development of Incident Management Based Performance Measures. Jeff Hochmuth, PE, PTOE Wilbur Smith Associates
 Illinois Tollway: Development of Incident Management Based Performance Measures Jeff Hochmuth, PE, PTOE Wilbur Smith Associates Tollways and Data Toll authorities have always been data heavy Need to verify
AT&T Global Network Client for Windows Product Support Matrix January 29, 2015
 AT&T Global Network Client for Windows Product Support Matrix January 29, 2015 Product Support Matrix Following is the Product Support Matrix for the AT&T Global Network Client. See the AT&T Global Network
FINAL REPORT DEVELOPMENT OF CONGESTION PERFORMANCE MEASURES USING ITS INFORMATION. Sarah B. Medley Graduate Research Assistant
 FINAL REPORT DEVELOPMENT OF CONGESTION PERFORMANCE MEASURES USING ITS INFORMATION Sarah B. Medley Graduate Research Assistant Michael J. Demetsky, Ph.D., P.E. Faculty Research Scientist and Professor of
Transportation Management Plan Template
 DATE: TO: FROM: SUBJECT: Date Name Position Transportation Service Center Name Position Transportation Service Center Transportation Management Plan Job Number(s) Control Section(s) Route Details County
COMPARISON OF FIXED & VARIABLE RATES (25 YEARS) CHARTERED BANK ADMINISTERED INTEREST RATES - PRIME BUSINESS*
 CHARTERED BANK ADMINISTERED INTEREST RATES - PRIME BUSINESS*") COMPARISON OF FIXED & VARIABLE RATES (25 YEARS) 2 Fixed Rates Variable Rates FIXED RATES OF THE PAST 25 YEARS AVERAGE RESIDENTIAL MORTGAGE LENDING RATE - 5 YEAR* (Per cent) Year Jan Feb Mar Apr May Jun
COMPARISON OF FIXED & VARIABLE RATES (25 YEARS) 2 Fixed Rates Variable Rates FIXED RATES OF THE PAST 25 YEARS AVERAGE RESIDENTIAL MORTGAGE LENDING RATE - 5 YEAR* (Per cent) Year Jan Feb Mar Apr May Jun
Auckland Motorways Network Performance Monitoring
 Network Performance Monitoring Anita Lin & Hanford Cheung Page 0 Auckland Motorways Network Performance Monitoring Authors Anita Lin Auckland Motorways (Presenter) Traffic Optimisation Leader BE, ME GIPENZ
STAFFORDSHIRE COUNTY COUNCIL ROAD CASUALTY REVIEW
 223/9/213 STAFFORDSHIRE COUNTY COUNCIL ROAD CASUALTY REVIEW 212 STAFFORDSHIRE COUNTY COUNCIL ROAD CASUALTY REVIEW 212 Contents 1. Accident and Casualty Statistics 2. Introduction 3. Long Term Progress/Casualty
Statewide Traffic Flow Data: Probe Vehicle Study for Iowa DOT
 Statewide Traffic Flow Data: Probe Vehicle Study for Iowa DOT Erik Minge, PE SRF Consulting Group, Inc. May 25, 2011 Types of Mobile Probe Data Cellular Telephone-Based Methods! Angle of arrival (E911)!
Analysis One Code Desc. Transaction Amount. Fiscal Period
 Analysis One Code Desc Transaction Amount Fiscal Period 57.63 Oct-12 12.13 Oct-12-38.90 Oct-12-773.00 Oct-12-800.00 Oct-12-187.00 Oct-12-82.00 Oct-12-82.00 Oct-12-110.00 Oct-12-1115.25 Oct-12-71.00 Oct-12-41.00
Practical Traffic Incident Management
 Practical Traffic Incident Management NATIONAL RURAL ITS CONFERENCE August 2011 Submittal by Delcan Emergency Transportation Operations Division (ETO) Gary Millsaps and Rita Brohman For more information,
Case 2:08-cv-02463-ABC-E Document 1-4 Filed 04/15/2008 Page 1 of 138. Exhibit 8
 Case 2:08-cv-02463-ABC-E Document 1-4 Filed 04/15/2008 Page 1 of 138 Exhibit 8 Case 2:08-cv-02463-ABC-E Document 1-4 Filed 04/15/2008 Page 2 of 138 Domain Name: CELLULARVERISON.COM Updated Date: 12-dec-2007
The characteristics of fatal road accidents during the end of year festive period
 The characteristics of fatal road accidents during the end of year festive period 1994-2003 March 2004 Traffic Management and Road Safety Unit Ministry of Public Infrastructure, Land Transport and Shipping
Stone Way N Rechannelization: Before and After Study. N 34th Street to N 50th Street
 City of Seattle Department of Transportation Stone Way N Rechannelization: Before and After Study N 34th Street to N 50th Street May, 2010 INTRODUCTION Population density in Seattle is increasing within
Guidelines for Virtual Transportation Management Center Development. National Rural ITS Meeting August 27, 2014
 Guidelines for Virtual Transportation Management Center Development National Rural ITS Meeting August 27, 2014 1 Project Purpose Overview To develop a guidebook that provides technical guidance on planning
Child Road Safety Audit for South Gloucestershire 2009-2011
 Child Road Safety Audit for South Gloucestershire 9 - August 9 Contents Page Foreword Executive Summary. Introduction. Review of the Action Plan. Summary of Casualty Statistics 9. Child Casualty Trends.
Alcohol. Alcohol SECTION 10. Contents:
 Contents: Alcohol Alcohol SECTION 1 Figure 1.1 Number of Collisions and Victims Involving Alcohol by Year 69 1.2 Per cent of Collisions and Victims Involving Alcohol by Year 7 1.3 Alcohol-Involved Collisions
Performance Measures. First Quarter 2012
 Performance Measures First Quarter 2012 1Q2012 Earn & Retain Community Trust 6 Performance Measures: Ridership Cost Efficiency (Cost per Revenue Hour) Cost Effectiveness (Cost per Passenger) Service Effectiveness
Enhanced Vessel Traffic Management System Booking Slots Available and Vessels Booked per Day From 12-JAN-2016 To 30-JUN-2017
 From -JAN- To -JUN- -JAN- VIRP Page Period Period Period -JAN- 8 -JAN- 8 9 -JAN- 8 8 -JAN- -JAN- -JAN- 8-JAN- 9-JAN- -JAN- -JAN- -JAN- -JAN- -JAN- -JAN- -JAN- -JAN- 8-JAN- 9-JAN- -JAN- -JAN- -FEB- : days
Module 2.1. Page 1 of 10. Slide 1
 Slide 1 Module 2: Traffic Incident Management Framework & Resources Lesson 2.1 Regional Transportation Management Centers This course was developed by the Baltimore Regional Operations Coordination Committee
Congestion (average speed during the weekday morning peak) on Local A Roads Methodology
 on Local A Roads Methodology") Congestion (average speed during the weekday morning peak) on Local A Roads Methodology IMPORTANT NOTE This methodology document refers to the previous Congestion on local A road statistics, published
Congestion (average speed during the weekday morning peak) on Local A Roads Methodology IMPORTANT NOTE This methodology document refers to the previous Congestion on local A road statistics, published
How To Understand The Traffic Patterns In Coronado
 CITY OF CORONADO ANNUAL TRAFFIC REPORT - 2010 PREPARED BY THE CITY OF CORONADO ENGINEERING AND PROJECT DEVELOPMENT DEPARTMENT TABLE OF CONTENTS SECTION PAGE EXECUTIVE SUMMARY i Quick Facts i Traffic Volume
2014 TRANSPORTATION SAFETY SUMMIT LOUISIANA STATE POLICE & LADOTD TIM INITIATIVE
 2014 TRANSPORTATION SAFETY SUMMIT LOUISIANA STATE POLICE & LADOTD TIM INITIATIVE PROJECT SUMMARY & PRESENTATION LAW ENFORCEMENT FIRE EMS TRANSPORTATION TOWING & RECOVERY COMMUNICATIONS What is Traffic
Central Regional Traffic Management Center
 Central Regional Traffic Management Center The Shift to Operations Rich Deen, RTMC Manager, District 8-0 October 5, 2009 ASHE Meeting Where we came from? Circa 1986 Someone in PENNDOT- We can t build our
Nearly 38,000 vehicles cross the Shinnecock Canal on Sunrise Highway (NYS Route 27) daily, during peak summer months.
 daily, during peak summer months.") 2. Traffic Characteristics Traffic volumes have increased in concert with population growth in the Towns of Southampton and East Hampton. The New York State Department of Transportation (NYSDOT) maintains
2. Traffic Characteristics Traffic volumes have increased in concert with population growth in the Towns of Southampton and East Hampton. The New York State Department of Transportation (NYSDOT) maintains
ALCOHOL, 2013 HIGHLIGHTS
 ALCOHOL, 2013 JUNE 2014 ISSUE 14-C08 HIGHLIGHTS During 2013, there were 114 fatal alcohol-impaired collisions in the state (16 percent of all fatal collisions). Alcohol-impaired fatal collisions decreased
Ashley Institute of Training Schedule of VET Tuition Fees 2015
 Ashley Institute of Training Schedule of VET Fees Year of Study Group ID:DECE15G1 Total Course Fees $ 12,000 29-Aug- 17-Oct- 50 14-Sep- 0.167 blended various $2,000 CHC02 Best practice 24-Oct- 12-Dec-
FUNCTIONS CHAPTER 1 INTRODUCTION TO TRANSPORTATION MANAGEMENT CENTER
 CHAPTER 1 INTRODUCTION TO TRANSPORTATION MANAGEMENT CENTER The Transportation Management Center (TMC) serves as the central communication hub of the NaviGAtor system in the Atlanta region. The NaviGAtor
ATSB RESEARCH AND ANALYSIS REPORT ROAD SAFETY. Characteristics of Fatal Road Crashes During National Holiday Periods
 ATSB RESEARCH AND ANALYSIS REPORT ROAD SAFETY Characteristics of Fatal Road Crashes During National Holiday Periods July 2006 ATSB RESEARCH AND ANALYSIS REPORT ROAD SAFETY Characteristics of Fatal Road
National Traffic Incident Management for Emergency Responders 4H-0
 4H-0 4H-1 NATIONAL TRAFFIC INCIDENT MANAGEMENT (TIM) RESPONDER TRAINING PROGRAM LAW ENFORCEMENT FIRE EMS TRANSPORTATION TOWING & RECOVERY COMMUNICATIONS TEXAS DEPARTMENT OF EMERGENCY MANAGEMENT MAY 19,
Academic Calendars. Term I (20081) Term II (20082) Term III (20083) Weekend College. International Student Admission Deadlines
 Term II (20082) Term III (20083) Weekend College. International Student Admission Deadlines") Academic Calendars Term I (20081) Term II (20082) Academic Calendars Term III (20083) Weekend College International Student Admission Deadlines Final Examination Schedule Broward Community College Catalog
Academic Calendars Term I (20081) Term II (20082) Academic Calendars Term III (20083) Weekend College International Student Admission Deadlines Final Examination Schedule Broward Community College Catalog
ACCESS Nursing Programs Session 1 Center Valley Campus Only 8 Weeks Academic Calendar 8 Weeks
 Session 1 Academic Calendar August 24, 2015 to October 17, 2015 Tuesday / Thursday, 5:30 pm to 8:30 pm M/W T/TH T/W TH S Saturday lab as scheduled Classes Begin 24-Aug 25-Aug 25-Aug 27-Aug 29-Aug NU205
ACCESS Nursing Programs Session 1 Center Valley Campus Only 8 Weeks Academic Calendar 8 Weeks
 Session 1 Academic Calendar August 24, 2015 to October 17, 2015 Tuesday / Thursday, 5:30 pm to 8:30 pm M/W T/TH T/W TH S Saturday lab as scheduled Classes Begin 24-Aug 25-Aug 25-Aug 27-Aug 29-Aug NU205
Metropolitan Intelligent Transportation Systems (ITS) Infrastructure 2010 Transportation Management Center
 Infrastructure 2010 Transportation Management Center") Metropolitan Intelligent Transportation Systems (ITS) Infrastructure 2010 Instructions This questionnaire is designed to obtain data measuring the level of Intelligent Transportation System (ITS) implemented
Metropolitan Intelligent Transportation Systems (ITS) Infrastructure 2010 Instructions This questionnaire is designed to obtain data measuring the level of Intelligent Transportation System (ITS) implemented
Accident & Emergency Department Clinical Quality Indicators
 Overview This dashboard presents our performance in the new A&E clinical quality indicators. These 8 indicators will allow you to see the quality of care being delivered by our A&E department, and reflect
ITS Investment Strategy 10-Year Program, FY07-16
 New Jersey Department of Transportation ITS Investment Strategy 10-Year Program, FY07-16 Statewide Traffic Operations ITS Engineering March, 2007 Intelligent Transportation Systems Investment Strategy
Traffic Incident Management PERFORMANCE METRIC ADOPTION CAMPAIGN. ITS Texas Annual Meeting November 10-12, 2010
 Traffic Incident Management PERFORMANCE METRIC ADOPTION CAMPAIGN ITS Texas Annual Meeting November 10-12, 2010 BACKGROUND National Unified Goal (NUG) for TIM Strategy 3. Goals for Performance and Progress
District Wide Traffic Incident Management Strategic Plan
 Page 1 Executive Summary The District Wide Traffic Incident Management (TIM) Strategic Plan was prepared to provide a roadmap for the Florida Department of Transportation (FDOT) District 4 to advance their
Congestion Pricing Experiences in Singapore. Dr Kian-Keong Chin Chief Engineer, Transportation Land Transport Authority Singapore
 Congestion Pricing Experiences in Singapore Dr Kian-Keong Chin Chief Engineer, Transportation Land Transport Authority Singapore Congestion Pricing just one component of a Transport Strategy Cannot work
NORTH EAST Regional Road Safety Resource
 NORTH EAST Regional Road Safety Resource Project Report: 1. Regional Overview of Pedal Cycle Accidents 2005 2007. Produced May 2008. Natalie Goodman Project is supported by the Department of Transport.
ONE CALL CENTER REPORT
 ITIC Mobile HTML Version of Excavators Ticket HTML format for proper display on any device Allows for different fonts, colors and embedded links Printed copies use greyscale TicketLINK Enhanced for ETM
Rhode Island Department of Transportation ITS State Architecture Update
 Rhode Island Department of Transportation ITS State Architecture Update By: 2014 1 Table of Contents ITS Architecture Description: 1. Introduction - What is an ITS Architecture?... 3 2. Background ITS
Pedestrian and Bicycle Crash Data Analysis: 2005-2010
 MICHIGAN DEPARTMENT OF TRANSPORTATION Pedestrian and Bicycle Crash Data Analysis: 2005-2010 FINAL REPORT Prepared by: T.Y. Lin International and Western Michigan University 4/3/2012 TABLE OF CONTENTS List
PERFORMANCE REPORT Quarter 2 2014/15
 PERFORMANCE REPORT Quarter 2 2014/15 CONTENTS 1. RELIABILITY... 3 2. NETWORK DISRUPTION... 9 3. TRAFFIC VOLUMES... 15 4. TRAFFIC SPEEDS... 17 5. ROAD SAFETY... 18 6. ASSET AVAILABILITY... 19 7. STATE OF
Incident Management Response Plan Hampton Roads Highway Incident Management Committee
 Incident Management Response Plan Hampton Roads Highway Incident Management Committee Multi-Jurisdictional Memorandum of Understanding Highway Incident Management Plan This memorandum of understanding
Efficiency/Accuracy Challenges in the Tolling Adjudication Process
 STATE ROAD AND TOLLWAY AUTHORITY Efficiency/Accuracy Challenges in the Tolling Adjudication Process IBTTA Summit on All Electronic Tolling, Managed Lanes & Operability July 21-23, 2013 Merryl Mandus, General
Department of Public Welfare (DPW)
") Department of Public Welfare (DPW) Office of Income Maintenance Electronic Benefits Transfer Card Risk Management Report Out-of-State Residency Review FISCAL YEAR 2012-2013 June 2013 (March, April and
Department of Public Welfare (DPW) Office of Income Maintenance Electronic Benefits Transfer Card Risk Management Report Out-of-State Residency Review FISCAL YEAR 2012-2013 June 2013 (March, April and
Traffic Incident Management From Activity to Public Safety Discipline
 Traffic Incident Management From Activity to Public Safety Discipline Slide 1 12-16 The Anatomy of a Modern Highway Incident Freight Mobility Towing & Recovery Performance Measures Hazardous Materials
NASDAQ DUBAI TRADING AND SETTLEMENT CALENDAR 2015. 1. On US Federal Reserve Holidays, no settlements will take place for USD.
 NASDAQ Dubai Circular No. : 65/14 Date of Issue : December 22 nd 2014 Date of Expiry : Upon issue of replacement Circular NASDAQ DUBAI TRADING AND SETTLEMENT CALENDAR 2015 Issued pursuant to the NASDAQ
9988 REDWOOD AVENUE PROJECT TRAFFIC IMPACT ANALYSIS. April 24, 2015
 9988 REDWOOD AVENUE PROJECT TRAFFIC IMPACT ANALYSIS April 24, 2015 Kunzman Associates, Inc. 9988 REDWOOD AVENUE PROJECT TRAFFIC IMPACT ANALYSIS April 24, 2015 Prepared by: Bryan Crawford Carl Ballard,
Provide an Efficient, Well-Connected Transportation Experience
 TANGIBLE RESULT #5 Provide an Efficient, Well-Connected MDOT will provide an easy, reliable transportation experience throughout the system. This includes good connections and world class transportation
Traffic Incident Management Where are we focused? Captain Mike Prochko Arizona Department of Public Safety Highway Patrol Division mprochko@azdps.
 Traffic Incident Management Where are we focused? Captain Mike Prochko Arizona Department of Public Safety Highway Patrol Division [email protected] Notable issues in AzDPS past Major Incidents generating
Fred N. Day IV, Chair
 1 chair s message Triangle Transit completed the fiscal year with strongly positive ridership, a successful referendum on the Orange County Transit Plan, and more transit service to meet growing demand.
Applying ICT and IoT to Multifamily Buildings. U.S. Department of Energy Buildings Interoperability Vision Meeting March 12, 2015 Jeff Hendler, ETS
 Applying ICT and IoT to Multifamily Buildings U.S. Department of Energy Buildings Interoperability Vision Meeting March 12, 2015 Jeff Hendler, ETS ETS is an Energy Technology, Behavior Management, and
USE OF STATE FLEET VEHICLE GPS DATA FOR TRAVEL TIME ANALYSIS
 USE OF STATE FLEET VEHICLE GPS DATA FOR TRAVEL TIME ANALYSIS David P. Racca Center for Applied Demography and Survey Research (CADSR) University of Delaware Graham Hall, Rm 284, Newark, Delaware 19716
ITD Help Desk Traffic Report May 2002
 ITD Help Desk Traffic Report May 2002 Call volumes and resolution times within the CONSULT Remedy workgroup June 10, 2002 Christopher King Help Desk Manager NC State University [email protected] Information
PEDESTRIAN AND BICYCLE ACCIDENT DATA. Irene Isaksson-Hellman If Insurance Company P&C Ltd.
 PEDESTRIAN AND BICYCLE ACCIDENT DATA Irene Isaksson-Hellman If Insurance Company P&C Ltd. Vulnerable road users 2 Number Number Official accident statistics 45 35 4 3 35 25 3 25 2 2 15 15 1 1 5 5 5 4 5
STRATEGIC BUSINESS PLAN QUARTERLY KPI REPORT FOR: FISCAL YEAR 2015, QUARTER 2 (JULY THROUGH DECEMBER 2014)
") STRATEGIC BUSINESS PLAN QUARTERLY KPI REPORT FOR: FISCAL YEAR 215, QUARTER 2 (JULY THROUGH DECEMBER ) CONTENTS BALANCED SCORECARD OF KEY PERFORMANCE INDICATORS SAFETY & SECURITY SLIDE VEHICLE, PASSENGER
STRATEGIC BUSINESS PLAN QUARTERLY KPI REPORT FOR: FISCAL YEAR 215, QUARTER 2 (JULY THROUGH DECEMBER ) CONTENTS BALANCED SCORECARD OF KEY PERFORMANCE INDICATORS SAFETY & SECURITY SLIDE VEHICLE, PASSENGER
NHS BLOOD AND TRANSPLANT MARCH 2009 RESPONDING EFFECTIVELY TO BLOOD DONOR FEEDBACK
 09/26 NHS BLOOD AND TRANSPLANT MARCH 2009 RESPONDING EFFECTIVELY TO BLOOD DONOR FEEDBACK EXECUTIVE SUMMARY From April 2009 an NHS wide common approach to complaint handling comes in to effect. This provides
TERMINAL 91 TRAFFIC MONITORING STUDY
 REVISED DRAFT TERMINAL 9 TRAFFIC MONITORING STUDY Prepared for: Port of Seattle Prepared by: 6544 NE 6st Street, Seattle, WA 985 ph: (26) 523-3939 fx: (26) 523-4949 NOVEMBER 22, 2 TABLE OF CONTENTS. INTRODUCTION...
Media Planning. Marketing Communications 2002
 Media Planning Marketing Communications 2002 Media Terminology Media Planning - A series of decisions involving the delivery of messages to audiences. Media Objectives - Goals to be attained by the media
Computing & Telecommunications Services Monthly Report March 2015
 March 215 Monthly Report Computing & Telecommunications Services Monthly Report March 215 CaTS Help Desk (937) 775-4827 1-888-775-4827 25 Library Annex [email protected] www.wright.edu/cats/ Last Modified
Section 16: Traffic Incident Management
 Section 16: Traffic Incident Management Traffic Incident Management (TIM) is the coordinated process to identify, respond to and clear traffic incidents to prevent secondary collisions and reduce the duration
Proposal to Reduce Opening Hours at the Revenues & Benefits Coventry Call Centre
 Proposal to Reduce Opening Hours at the Revenues & Benefits Coventry Call Centre Proposal To change the opening hours of the Revenues & Benefits Call Centre to 9am until 5pm Monday to Friday with effect
COLUMBIA COUNTY HIGHWAY INCIDENT MANAGEMENT PLAN Adopted April 2008
 COLUMBIA COUNTY HIGHWAY INCIDENT MANAGEMENT PLAN Adopted April 2008 PURPOSE This guideline provides information and procedures to allow for the safe and efficient resolution of incidents that occur on
Emergency and Incident Management
 I. Emergency Transportation Operations II. III. Emergency Restrictions Global Detours IV. Incident Management Manual (Pub 911) V. MPO Traffic Incident Management I. Emergency Transportation Operations
Moving TIM from Good to Great?
 FHWA Update: Traffic Incident Management Program Moving TIM from Good to Great? Iowa Traffic Safety Forum November 19, 2014 Mr. Jeff King (Retired Capt. AzDPS) Traffic Incident Management Public Safety
2015-16 BCOE Payroll Calendar. Monday Tuesday Wednesday Thursday Friday Jun 29 30 Jul 1 2 3. Full Force Calc
 July 2015 CM Period 1501075 July 2015 1 2 3 4 5 6 7 8 9 10 11 12 13 14 15 16 17 18 19 20 21 22 23 24 25 26 27 28 29 30 31 August 2015 1 2 3 4 5 6 7 8 9 10 11 12 13 14 15 16 17 18 19 20 21 22 23 24 25 26
Special GREYSTONE COLLEGE Prices for Turkish Students
 CANADA VANCOUVER, TORONTO Special GREYSTONE COLLEGE Prices for Turkish Students Promotion is valid for registrations received before December 31st, 2015 Start dates must be before March 31, 2016 PROGRAMS
2015 Settlement Calendar for ASX Cash Market Products ¹ Published by ASX Settlement Pty Limited A.B.N 49 008 504 532
 2015 Calendar for ASX Cash Market Products ¹ Published by ASX Pty Limited A.B.N 49 008 504 532 Calendar for ASX Cash Market Products¹ ASX Pty Limited (ASX ) operates a trade date plus three Business (T+3)
Traffic Incident Management Enhancement (TIME) Blueprint Version 2.0 Executive Summary
 Blueprint Version 2.0 Executive Summary") Blueprint Version 2.0 Executive Summary Strategic Background The Southeastern Wisconsin region, which encompasses the following eight counties: Fond du Lac, Kenosha, Milwaukee, Ozaukee, Racine, Walworth,
Blueprint Version 2.0 Executive Summary Strategic Background The Southeastern Wisconsin region, which encompasses the following eight counties: Fond du Lac, Kenosha, Milwaukee, Ozaukee, Racine, Walworth,
Intersection Cost Comparison Spreadsheet User Manual ROUNDABOUT GUIDANCE VIRGINIA DEPARTMENT OF TRANSPORTATION
 Intersection Cost Comparison Spreadsheet User Manual ROUNDABOUT GUIDANCE VIRGINIA DEPARTMENT OF TRANSPORTATION Version 2.5 i Virginia Department of Transportation Intersection Cost Comparison Spreadsheet
BlipTrack. Case Studies. ANPR vs. Bluetooth. This case describes how data from ANPR cameras match corresponding Bluetooth sensor data.
 ANPR vs. Bluetooth This case describes how data from ANPR cameras match corresponding Bluetooth sensor data. The map shows an arterial road in the city of Aalborg with a total of 4 lanes, 2 in each direction.
Comparing Arterial Speeds from Big-Data Sources in Southeast Florida (Bluetooth, HERE and INRIX)
") Comparing Arterial Speeds from Big-Data Sources in Southeast Florida (Bluetooth, HERE and INRIX) Sujith Rapolu Ashutosh Kumar TRB National Transportation Planning Applications Conference (Atlantic City,
Comparing Arterial Speeds from Big-Data Sources in Southeast Florida (Bluetooth, HERE and INRIX) Sujith Rapolu Ashutosh Kumar TRB National Transportation Planning Applications Conference (Atlantic City,
Unified Response Manual (URM)
") The 2014 Commonwealth of Massachusetts Unified Response Manual (URM) for the Massachusetts Highway System Photo Courtesy of The Republican by John Suchocki August 1, 2014 Revision Control Revision Number
The 2014 Commonwealth of Massachusetts Unified Response Manual (URM) for the Massachusetts Highway System Photo Courtesy of The Republican by John Suchocki August 1, 2014 Revision Control Revision Number
INTELLIGENT TRANSPORTATION SYSTEMS IN WHATCOM COUNTY A REGIONAL GUIDE TO ITS TECHNOLOGY
 INTELLIGENT TRANSPORTATION SYSTEMS IN WHATCOM COUNTY A REGIONAL GUIDE TO ITS TECHNOLOGY AN INTRODUCTION PREPARED BY THE WHATCOM COUNCIL OF GOVERNMENTS JULY, 2004 Whatcom Council of Governments 314 E. Champion
The partnership has selected three intersections where enforcement, education, and engineering initiatives are being implemented to improve safety:
 Hamilton-Finn Suite 310 Tel. (403) 207-6000 Road Safety 3016 5th Avenue N.E. Fax. (403) 273-3440 Consultants Ltd. Calgary, Alberta dawatt.dawatt.com www.hamiltonfinn.ca January 19, 2005 Mr. Don Szarko,
CENTERPOINT ENERGY TEXARKANA SERVICE AREA GAS SUPPLY RATE (GSR) JULY 2015. Small Commercial Service (SCS-1) GSR
 JULY 2015. Small Commercial Service (SCS-1) GSR") JULY 2015 Area (RS-1) GSR GSR (LCS-1) Texarkana Incorporated July-15 $0.50690/Ccf $0.45450/Ccf $0.00000/Ccf $2.85090/MMBtu $17.52070/MMBtu Texarkana Unincorporated July-15 $0.56370/Ccf $0.26110/Ccf $1.66900/Ccf
JULY 2015 Area (RS-1) GSR GSR (LCS-1) Texarkana Incorporated July-15 $0.50690/Ccf $0.45450/Ccf $0.00000/Ccf $2.85090/MMBtu $17.52070/MMBtu Texarkana Unincorporated July-15 $0.56370/Ccf $0.26110/Ccf $1.66900/Ccf