Using Statistical data formats in visualization
|
|
|
- Meghan Grant
- 10 years ago
- Views:
Transcription
1 Using Statistical data formats in visualization


2 Background Statistics explorer: Generic statistics visualization


3 Background Focus is on visualization, but that is useless without data and data is useless without an easy way to load it.

4 Background


5 Background
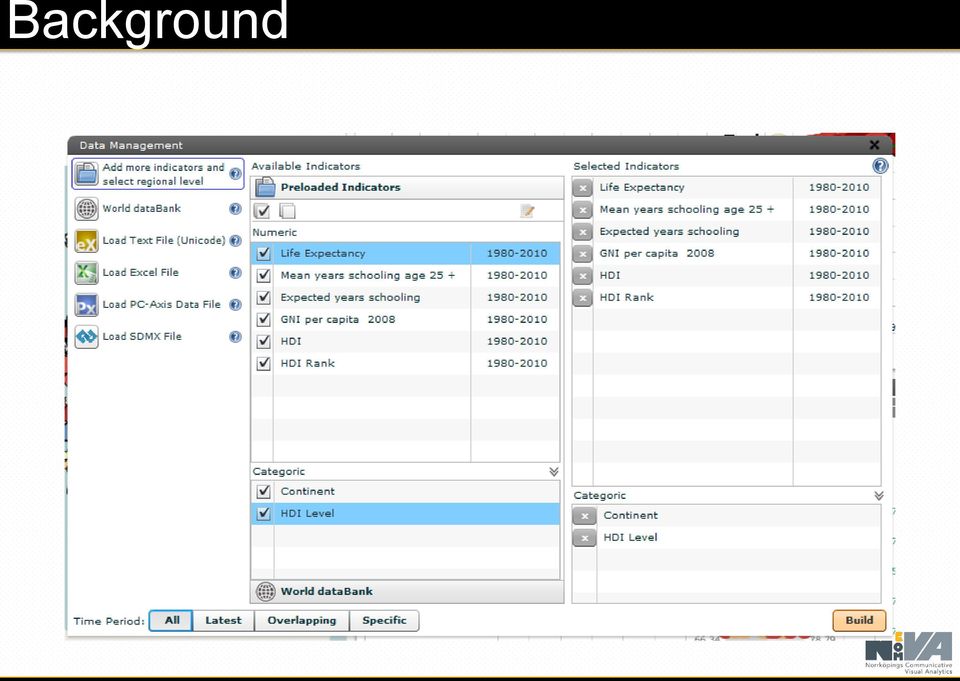
6 Background Data Providers Loaded Indicators Selected Indicators

7 Background Data loading demo Start off on a bright note Download PC-Axis from SCB Load directly into Statistics explorer or Mdim explorer aspx yp=duwird&xu=c &lang=1&langdb=1&fromw here=s&omradekod=be&huvudtabell=befolkningny &innehall=folkmangd&prodid=be0101&deltabell=k2 &fromsok=&preskat=o

8 Background To make our tool useful, it needs: Support the most common formats Combine data from different sources Load data in a intuitive way Should be easy to understand WHY data is loaded in a specific way Tell the user what is wrong with their data

9 Background To make our tool useful, it needs: Support the most common formats Combine data from different sources Load data in a intuitive way Should be easy to understand WHY data is loaded in a specific way Tell the user what is wrong with their data

10 Formats Generic Formats Excel txt CSV Statistics Formats PC-Axis SDMX

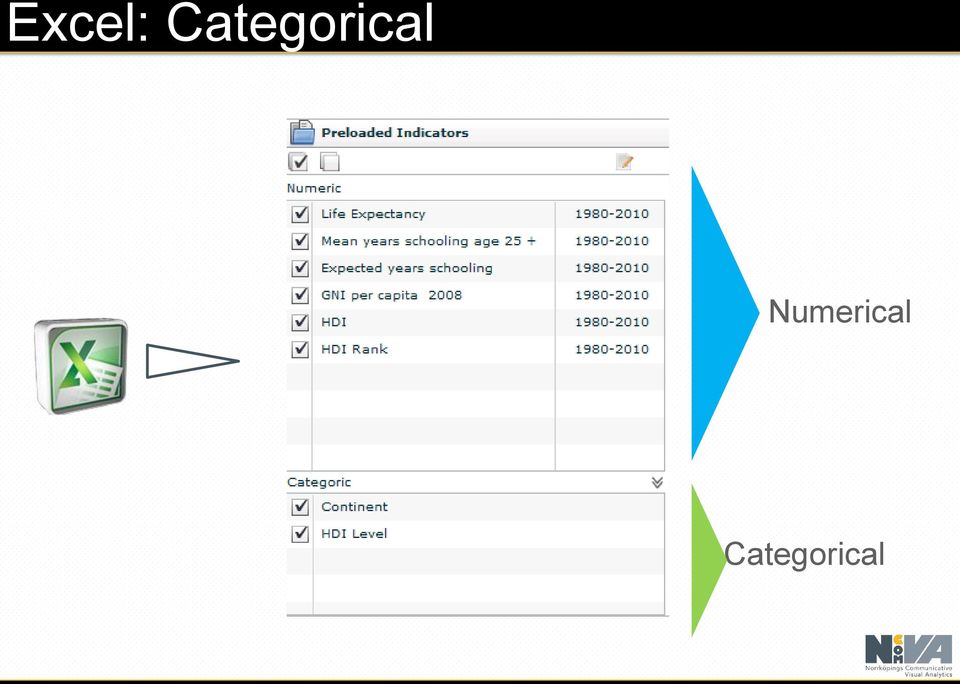
11 Generic Formats User are guided to use our structure Simpler to have special additions like categorical data and groupings Proper error management and feedback goes a long way Make sure the user knows what is wrong Limits the user to supported structures Their export format either needs specific support OR they need to edit their files Problematic to keep track of and update data


12 Excel: Categorical Example Categorical Numerical

13 Excel: Categorical Numerical Categorical

14 Excel: Categorical Treemap Numerical Categorical


15 Excel: Categorical Color Map Numerical Categorical

16 Statistics Formats Strictly structured Has identifiable properties that can be used by our tools Dimensions Values Time Meta data

17 Statistics Formats Exported data can directly be used in tools which support the format No need for editing or changing data bases as long as they support proper export mechanisms Potentially much simpler to update and manage the tools data.

18 Common issues - Notation Contents Spatial Countries, Regions Extra important if the tool uses a map Identified in different ways depending on the publisher, language and data set. region, country, geo, cou, location etc. Usage of codes and/or names differs as well ISO 2/3, local code systems, only names


19 Common issues - Notation Contents Spatial Need to prompt the user to identify the spatial dimension PC-Axis prompt in Statistics explorer, Reading a Finnish language PC-Axis file SDMX Load interface in Statistics explorer, Loading fields for both files, along with location identifier


20 Common issues - Notation Contents Spatial Problem do exist for other formats as well, but there are fewer options Prompt when reading an Excel file with data on both sheets and columns, where they couldn t be correctly identified.

21 Common issues - Notation Contents Time Q Q2 January, February Etc.. Our tools currently don t care, they only assume it can be sorted alphabetically. Plans on using proper Date standards exist, but there are many localization issues.
22 Common issues - Notation Contents Dimensions Any number of value dimensions Gender: Men, Women Population: Age 0-14, Age 15-64, Age 65+ Title and Description fields How should these be combined in the application?

23 Common issues - Notation
24 Common issues Notation - Example How the structure of PC-Axis is used in explorer: TITLE: Title of the file CONTENTS: Contents of the file STUB: dimensions HEADING: dimensions VALUES: Contains the content of dimensions DESCRIPTION: Description of the file
25 Common issues Notation - Example Example TITLE: Population numbers by gender CONTENTS: Population STUB: regions HEADING: gender, time VALUES( gender )= Men, Women VALUES( time )= 2000, 2001, 2002 VALUES( region )= Norrköping, Linköping Name of the indicators would be: Population, Men and Population, Women
26 Common issues - Notation- Example Example from SCB TITLE: Statistics focused on sick leave numbers by region, time and value CONTENTS: Statistics focused on sick leave STUB: regions, variables HEADING: time, indicators VALUES( variables )= Total, Men, Women VALUES( indicators )= Sick leave, days, Percentage who contributes to sick leave, per cent" Name of the indicators would be: Total, Sick leave, days, Statistics focused on sick leave
27 Common issues - Notation- Example Leaves work for the user, to make sure their file has a structure that fits what we do. Being more flexible in the tool could help, but make it more complex to read data.
28 Common issues Usage of special characters () ; All cases has to be correctly identified Quite possible and simple, but time consuming
29 SDMX Our tools can read: SDMX-ML: XML based format It needs two files: DSD: Data structure definition Data Location/regional dimension has to be identified We use an Open Source project: flex-cb, previously developed by ECB.

30 SDMX OECD: DotStat integration explorer component viewer: Single view app. Integrated into the database Allows direct viewing of data in our graphs User select data Query URL OECD web service SDMX data
31 SDMX Testing with SCB and Eurostat Evaluating usage of SDMX For regular users? What kind of files are suitable Usually very large files, for database communication Finding bugs No SDMX implementation seems to be the same Both in our reader and the export functionality
32 SDMX Often completely irrelevant to the normal user Extremely powerful for technical users Hard to use, but better tools will solve this

33 Web services Best way of acquiring data for normal users Format is irrelevant, black-box approach Example: World databank
34 Web services Standards? World databank uses its own API and data format
35 Wrapping up Most common format is Excel Statisticians don t want a black box format Harder to detect errors in files PC-Axis used by a certain group of people They are usually experienced with PC-Axis editing. SDMX is only used by technical experts Used for data export and webservices Quite heavily promoted From our point of view it s hard to know the focus of it Mostly used for large files, transferred between databases
36 Wrapping up Need more structure? Not at all! A flexible system will always be better Guidelines are important Usage of codes and structures Know your audience Make sure they have options on data structure, and that it is clear how to reach it.
37
OECD.Stat Web Browser User Guide
 OECD.Stat Web Browser User Guide May 2013 May 2013 1 p.10 Search by keyword across themes and datasets p.31 View and save combined queries p.11 Customise dimensions: select variables, change table layout;
Improving the visualisation of statistics: The use of SDMX as input for dynamic charts on the ECB website
 Improving the visualisation of statistics: The use of SDMX as input for dynamic charts on the ECB website Xavier Sosnovsky, Gérard Salou European Central Bank Abstract The ECB has introduced a number of
itunes Store Publisher User Guide Version 1.1
 itunes Store Publisher User Guide Version 1.1 Version Date Author 1.1 10/09/13 William Goff Table of Contents Table of Contents... 2 Introduction... 3 itunes Console Advantages... 3 Getting Started...
The ECB Statistical Data Warehouse: improving data accessibility for all users
 The ECB Statistical Data Warehouse: improving data accessibility for all users Gérard Salou 1 Introduction The Directorate General Statistics of the European Central Bank (ECB) is responsible for the efficient
Designing Mobile Applications for Official Statistics
 Designing Mobile Applications for Official Statistics Antonino Virgillito 1 1 Istat Istituto Nazionale di Statistica, e-mail: [email protected] Abstract In this paper we discuss the problems in the design
Data Visualization on Istat's Web site. Giulia Mottura Vincenzo Patruno
 on Istat's Web site Giulia Mottura Vincenzo Patruno Istat - Aula Magna 26 Aprile 2010 Value of Data Visualization Latest web technologies and the expectations they create amongst the user community are
How is it helping? PragmatiQa XOData : Overview with an Example. P a g e 1 12. Doc Version : 1.3
 XOData is a light-weight, practical, easily accessible and generic OData API visualizer / data explorer that is useful to developers as well as business users, business-process-experts, Architects etc.
Creating an Enterprise Reporting Bus with SAP BusinessObjects
 September 10-13, 2012 Orlando, Florida Creating an Enterprise Reporting Bus with SAP BusinessObjects Kevin McManus LaunchWorks Session : 0313 Learning Points By consolidating people, process, data and
<Insert Picture Here> Introducing Data Modeling and Design with Oracle SQL Developer Data Modeler
 Introducing Data Modeling and Design with Oracle SQL Developer Data Modeler Sue Harper Senior Principle Product Manager 1 The following is intended to outline our general product
Magento module Documentation
 Table of contents 1 General... 4 1.1 Languages... 4 2 Installation... 4 2.1 Search module... 4 2.2 Installation in Magento... 6 2.3 Installation as a local package... 7 2.4 Uninstalling the module... 8
A Tutorial on dynamic networks. By Clement Levallois, Erasmus University Rotterdam
 A Tutorial on dynamic networks By, Erasmus University Rotterdam V 1.0-2013 Bio notes Education in economics, management, history of science (Ph.D.) Since 2008, turned to digital methods for research. data
There are various ways to find data using the Hennepin County GIS Open Data site:
 Finding Data There are various ways to find data using the Hennepin County GIS Open Data site: Type in a subject or keyword in the search bar at the top of the page and press the Enter key or click the
Module 9 Ad Hoc Queries
 Module 9 Ad Hoc Queries Objectives Familiarize the User with basic steps necessary to create ad hoc queries using the Data Browser. Topics Ad Hoc Queries Create a Data Browser query Filter data Save a
Conference on Data Quality for International Organizations
 Committee for the Coordination of Statistical Activities Conference on Data Quality for International Organizations Newport, Wales, United Kingdom, 27-28 April 2006 Session 5: Tools and practices for collecting
SDMX Connectors: using SDMX data in statistical packages and tools (EXCEL, R, Matlab, SAS)
") SDMX Connectors: using SDMX data in statistical packages and tools (EXCEL, R, Matlab, SAS) Bank of Italy IT Support Unit for Economic Research Department Gianpaolo Lopez Attilio Mattiocco Diana Nicoletti
SDMX Connectors: using SDMX data in statistical packages and tools (EXCEL, R, Matlab, SAS) Bank of Italy IT Support Unit for Economic Research Department Gianpaolo Lopez Attilio Mattiocco Diana Nicoletti
Using HP ArcSight API for data visualization
 Using HP ArcSight API for data visualization Eugene Afonin, Senior Sales Engineer #HPProtect Some SIEMs have Google maps integrations could we do better? Do you have an app for that? Visualize data on
TOP New Features of Oracle Business Intelligence 11g
 10 TOP New Features of Oracle Business Intelligence 11g TABLE OF CONTENTS Feature 1 New Chart Choices Funnel Chart 2 Trellis Chart 3 Waterfall 4 Tile Diagram 5 Feature 2 Recommended Visualization 6 Feature
DKAN. Data Warehousing, Visualization, and Mapping
 DKAN Data Warehousing, Visualization, and Mapping Acknowledgements We d like to acknowledge the NuCivic team, led by Andrew Hoppin, which has done amazing work creating open source tools to make data available
ArcGIS Pro. James Tedrick, Esri
 ArcGIS Pro James Tedrick, Esri What you already know Why ArcGIS PRO? Vision The next generation ArcGIS desktop application for the GIS community who need a clean and comprehensive user experience which
ZOINED RETAIL ANALYTICS. User Guide
 ZOINED RETAIL ANALYTICS User Guide Contents Using the portal New user Profile Email reports Portal use Dashboard Drilling down into the data Filter options Analytics Managing analysis Saving the analysis
Portal Version 1 - User Manual
 Portal Version 1 - User Manual V1.0 March 2016 Portal Version 1 User Manual V1.0 07. March 2016 Table of Contents 1 Introduction... 4 1.1 Purpose of the Document... 4 1.2 Reference Documents... 4 1.3 Terminology...
Bulk Upload Tool (Beta) - Quick Start Guide 1. Facebook Ads. Bulk Upload Quick Start Guide
 - Quick Start Guide 1. Facebook Ads. Bulk Upload Quick Start Guide") Bulk Upload Tool (Beta) - Quick Start Guide 1 Facebook Ads Bulk Upload Quick Start Guide Last updated: February 19, 2010 Bulk Upload Tool (Beta) - Quick Start Guide 2 Introduction The Facebook Ads Bulk
Bulk Upload Tool (Beta) - Quick Start Guide 1 Facebook Ads Bulk Upload Quick Start Guide Last updated: February 19, 2010 Bulk Upload Tool (Beta) - Quick Start Guide 2 Introduction The Facebook Ads Bulk
Geospatial Information in the Statistical Business Cycle 1
 UNITED NATIONS SECRETARIAT ESA/STAT/AC.279/P15 Department of Economic and Social Affairs October 2013 Statistics Division English only United Nations Expert Group on the Integration of Statistical and
Welcome to the Data Visualisation & Reporting Stream
 Welcome to the Data Visualisation & Reporting Stream November, 2013 Birmingham Creating a Pervasive BI Platform with SAP BusinessObjects Speaker: Kevin McManus Founder, LaunchWorks Learning Points By consolidating
Designing Reports in Access
 Designing Reports in Access This document provides basic techniques for designing reports in Microsoft Access. Opening Comments about Reports Reports are a great way to organize and present data from your
Google Apps for Sharing Folders and Collecting Assignments
 Google Apps for Sharing Folders and Collecting Assignments The Google Drive is cloud (online) storage space, and it is also where you create and work with Google Docs, Sheets, Slides, etc. Create a Folder
123RF Corporate+ User s Guide
 123RF Corporate+ User s Guide Table of Contents Welcome Message Moving In Corporate+ Users Site Signing In User s Dashboard Searching for Content Viewing Search Results Advanced Search Bar Lightbox Downloading
Aspose.Cells Product Family
 time and effort by using our efficient and robust components instead of developing your own. lets you open, create, save and convert files from within your application without Microsoft Excel, confident
MIS Export via the FEM transfer software
 Content 1 Introduction How does the FEM transfer actually work and how do I transfer files to Fronter for a nightly import? How does the FEM transfer tool work? What does the XML/CSV files do and can I
Aerie Help Desk App. User Guide. Aerie Consulting, LLC 110 West Canal Street Winooski, VT 05404. September 14, 2015 Version 1.0.1
 Aerie Help Desk App User Guide Aerie Consulting, LLC 110 West Canal Street Winooski, VT 05404 September 14, 2015 Version 1.0.1 Table of Contents Introduction... 3 Scope & Purpose... 3 Process Overview...
August 2014 San Antonio Texas The Power of Embedded Analytics with SAP BusinessObjects
 August 2014 San Antonio Texas The Power of Embedded Analytics with SAP BusinessObjects Speaker: Kevin McManus Founder, LaunchWorks Learning Points Eliminate effort and delay of moving data to the cloud
Tool for Automated Provisioning System (TAPS) Version 1.2 (1027)
 Version 1.2 (1027)") Tool for Automated Provisioning System (TAPS) Version 1.2 (1027) 2015 VoIP Integration Rev. July 24, 2015 Table of Contents Product Overview... 3 Application Requirements... 3 Cisco Unified Communications
Tool for Automated Provisioning System (TAPS) Version 1.2 (1027) 2015 VoIP Integration Rev. July 24, 2015 Table of Contents Product Overview... 3 Application Requirements... 3 Cisco Unified Communications
FAQs for Open Payments Mobile for Physicians &
 1. NEW: Do the mobile apps store or capture patient data? Answer: No, the mobile apps do not capture or store patient data. They are solely available to help physicians, applicable manufacturers, and applicable
MODIFYING QUICKBOOKS REPORTS
 MODIFYING QUICKBOOKS REPORTS Included with the QuickBooks (QBs) software are standardized reports that have been configured with standard formatting, filters and selections. This procedure is being written
Release Notes 2016.2 Feature Release
 Release Notes 2016.2 Feature Release Table of Contents New Features Litmos Boost ecommerce for Learning Paths ecommerce for Learning Paths via Shopify Integration BambooHR Integration Bug Fixes & Minor
Project Plan 365 Collaboration with Microsoft Project Files (MPP) Shared on Network Folders
 Shared on Network Folders") Project Plan 365 Collaboration with Microsoft Project Files (MPP) Shared on Network Folders White Paper Housatonic Software - Project Plan 365 App 2014 Contents 1. Introduction... 3 2. Prerequisites...
Project Plan 365 Collaboration with Microsoft Project Files (MPP) Shared on Network Folders White Paper Housatonic Software - Project Plan 365 App 2014 Contents 1. Introduction... 3 2. Prerequisites...
The Reporting Console
 Chapter 1 The Reporting Console This chapter provides a tour of the WebTrends Reporting Console and describes how you can use it to view WebTrends reports. It also provides information about how to customize
Teacher Activities Page Directions
 Teacher Activities Page Directions The Teacher Activities Page provides teachers with access to student data that is protected by the federal Family Educational Rights and Privacy Act (FERPA). Teachers
Nonprofit Technology Collaboration. Web Analytics
 Web Analytics Contents What is Web Analytics?... 2 Why is Web Analytics Important?... 2 Google Analytics... 3 Using Major Metrics in Google Analytics... 6 Traffic Sources... 6 Visitor Loyalty... 9 Top
Sisense. Product Highlights. www.sisense.com
 Sisense Product Highlights Introduction Sisense is a business intelligence solution that simplifies analytics for complex data by offering an end-to-end platform that lets users easily prepare and analyze
QStar Network Migrator - Storage Reporter
 QStar Network Migrator - Storage Reporter About The QStar Storage Reporter (QSR) is a powerful tool based on QStar Network Migrator product. QSR helps organisations make more informed decisions for storage
Your No-Nonsense Guide to Facebook Ads
 Your No-Nonsense Guide to Facebook Ads If you are in business, Facebook can play an important role in your marketing your business. It helps you connect and build relationships through updated posts. In
Linked Statistical Data Analysis
 Linked Statistical Data Analysis Sarven Capadisli 1, Sören Auer 2, Reinhard Riedl 3 1 Universität Leipzig, Institut für Informatik, AKSW, Leipzig, Germany, 2 University of Bonn and Fraunhofer IAIS, Bonn,
Geovisual Analytics Exploring and analyzing large spatial and multivariate data. Prof Mikael Jern & Civ IngTobias Åström. http://ncva.itn.liu.
 Geovisual Analytics Exploring and analyzing large spatial and multivariate data Prof Mikael Jern & Civ IngTobias Åström http://ncva.itn.liu.se/ Agenda Introduction to a Geovisual Analytics Demo Explore
ProExtra eclaiming User Guide
 ProExtra eclaiming User Guide Welcome to ProExtra eclaiming. You can use this system to submit claims to ProCare, for the services you have provided to patients referred to you by their GPs. You will need
DESIGN THINKING FOR VISUALIZATION
 DESIGN THINKING FOR VISUALIZATION Steven Braun Informatics/Data Services Specialist University of Minnesota, Health Sciences Libraries DASHCamp 2014 OBJECTIVE Become more critical consumers and producers
1. Layout and Navigation
 Success online whether measured in visits, ad revenue or ecommerce transactions requires compelling content and intuitive design. It all starts with the fundamentals: the key building blocks to create
United States Department of Agriculture (USDA) Agricultural Marketing Service (AMS) Livestock and Grain Market News (LGMN)
 Agricultural Marketing Service (AMS) Livestock and Grain Market News (LGMN)") United States Department of Agriculture (USDA) Agricultural Marketing Service (AMS) Livestock and Grain Market News (LGMN) Livestock Mandatory Reporting (LMR) Dashboard Users Guide Version 3.0 / 11 May
United States Department of Agriculture (USDA) Agricultural Marketing Service (AMS) Livestock and Grain Market News (LGMN) Livestock Mandatory Reporting (LMR) Dashboard Users Guide Version 3.0 / 11 May
Messaging Dashboard Quick Reference Guide
 Messaging Dashboard Quick Reference Guide This guide will show you how to log in and use the Messaging Dashboard application. The Messaging Dashboard application allows users to search for messages or
Your Virtual Workforce. On Demand. Worldwide. COMPANY PRESENTATION. clickworker GmbH 2015
 Your Virtual Workforce. On Demand. Worldwide. COMPANY PRESENTATION 2015 CLICKWORKER AT A GLANCE Segment: Paid Crowdsourcing / Microtasking Services: Text Creation (incl. SEO Texts), Internet Research,
Gardners ebooks frequently asked questions
 How does the web service work? The technical process is covered in our I24 ebook Ordering via Web Services.pdf which explains all the web service file layout and method. It is recommended that you read
Oracle BI 11g R1: Create Analyses and Dashboards
 Oracle University Contact Us: Local: 1800 103 4775 Intl: +91 80 67863102 Oracle BI 11g R1: Create Analyses and Dashboards Duration: 5 Days What you will learn This Oracle BI 11g R1: Create Analyses and
Wave Analytics Platform Setup Guide
 Wave Analytics Platform Setup Guide Salesforce, Winter 16 @salesforcedocs Last updated: December 15, 2015 Copyright 2000 2015 salesforce.com, inc. All rights reserved. Salesforce is a registered trademark
City Data Pipeline. A System for Making Open Data Useful for Cities. [email protected]
 City Data Pipeline A System for Making Open Data Useful for Cities Stefan Bischof 1,2, Axel Polleres 1, and Simon Sperl 1 1 Siemens AG Österreich, Siemensstraße 90, 1211 Vienna, Austria {bischof.stefan,axel.polleres,simon.sperl}@siemens.com
Data Driven Success. Comparing Log Analytics Tools: Flowerfire s Sawmill vs. Google Analytics (GA)
") Data Driven Success Comparing Log Analytics Tools: Flowerfire s Sawmill vs. Google Analytics (GA) In business, data is everything. Regardless of the products or services you sell or the systems you support,
Data Driven Success Comparing Log Analytics Tools: Flowerfire s Sawmill vs. Google Analytics (GA) In business, data is everything. Regardless of the products or services you sell or the systems you support,
Canadian Association for Research Libraries Toronto, Ontario 14 October 2015
 Canadian Association for Research Libraries Toronto, Ontario 14 October 2015 Introductions Help & Learning Standard Reports Audience Traffic Sources Content Behaviour Measuring Value Basic Filtering &
Analyze Your Data. Salesforce, Winter 16. @salesforcedocs
 Analyze Your Data Salesforce, Winter 16 @salesforcedocs Last updated: December 17, 2015 Copyright 2000 2015 salesforce.com, inc. All rights reserved. Salesforce is a registered trademark of salesforce.com,
Data Sheet: Work Examiner Professional and Standard
 Data Sheet: Work Examiner Professional and Standard Editions Overview One of the main problems in any business is control over the efficiency of employees. Nowadays it is impossible to imagine an organization
Helpdesk manual. Version: 1.1
 Version: 1.1 Date: 06-May-2014 Introduction Once a new system has been delivered, or an update has taken place, issues could occur, questions raised and new functionality needed. You can register these
Package pdfetch. R topics documented: July 19, 2015
 Package pdfetch July 19, 2015 Imports httr, zoo, xts, XML, lubridate, jsonlite, reshape2 Type Package Title Fetch Economic and Financial Time Series Data from Public Sources Version 0.1.7 Date 2015-07-15
ithenticate User Manual
 ithenticate User Manual Updated November 20, 2009 Contents Introduction 4 New Users 4 Logging In 4 Resetting Your Password 5 Changing Your Password or Username 6 The ithenticate Account Homepage 7 Main
World Trade Analysis
 World Trade Analysis Brendan Fruin [email protected] Introduction With the vast amount of data being collected and made publicly available, individuals from all walks of life have been able to provide
The 8 Key Metrics That Define Your AdWords Performance. A WordStream Guide
 The 8 Key Metrics That Define Your AdWords Performance A WordStream Guide The 8 Key Metrics That Define Your Adwords Performance WordStream Customer Success As anyone who has ever managed a Google AdWords
Statistical Data Quality in the UNECE
 Statistical Data Quality in the UNECE 2010 Version Steven Vale, Quality Manager, Statistical Division Contents: 1. The UNECE Data Quality Model page 2 2. Quality Framework page 3 3. Quality Improvement
Team Members: Christopher Copper Philip Eittreim Jeremiah Jekich Andrew Reisdorph. Client: Brian Krzys
 Team Members: Christopher Copper Philip Eittreim Jeremiah Jekich Andrew Reisdorph Client: Brian Krzys June 17, 2014 Introduction Newmont Mining is a resource extraction company with a research and development
HOW TO USE DATA VISUALIZATION TO WIN OVER YOUR AUDIENCE
 HOW TO USE DATA VISUALIZATION TO WIN OVER YOUR AUDIENCE + TABLE OF CONTENTS HOW DATA SUPPORTS YOUR MESSAGE 1 Benefits of Data Visualization WHEN TO USE DATA VISUALIZATION HOW TO FIND THE STORY IN YOUR
TIBCO Spotfire Business Author Essentials Quick Reference Guide. Table of contents:
 Table of contents: Access Data for Analysis Data file types Format assumptions Data from Excel Information links Add multiple data tables Create & Interpret Visualizations Table Pie Chart Cross Table Treemap
Upon Installation, Soda
 Upon Installation, Soda Prompts you to create your user profile to register for a new profile Note: Asks your for your particulars Prompts you to select a password. You would need to provide this password
COGNOS 8 Business Intelligence
 COGNOS 8 Business Intelligence QUERY STUDIO USER GUIDE Query Studio is the reporting tool for creating simple queries and reports in Cognos 8, the Web-based reporting solution. In Query Studio, you can
SonicWALL GMS Custom Reports
 SonicWALL GMS Custom Reports Document Scope This document describes how to configure and use the SonicWALL GMS 6.0 Custom Reports feature. This document contains the following sections: Feature Overview
De La Salle University Information Technology Center. Microsoft Windows SharePoint Services and SharePoint Portal Server 2003 READER / CONTRIBUTOR
 De La Salle University Information Technology Center Microsoft Windows SharePoint Services and SharePoint Portal Server 2003 READER / CONTRIBUTOR User s Guide Microsoft Windows SharePoint Services and
Netezza Workbench Documentation
 Netezza Workbench Documentation Table of Contents Tour of the Work Bench... 2 Database Object Browser... 2 Edit Comments... 3 Script Database:... 3 Data Review Show Top 100... 4 Data Review Find Duplicates...
EA104 World Premiere of SAP BusinessObjects Design Studio. Eric Schemer, Senior Director Product Management, BI Clients, SAP AG October, 2013
 EA104 World Premiere of SAP BusinessObjects Design Studio Eric Schemer, Senior Director Product Management, BI Clients, SAP AG October, 2013 Disclaimer This presentation outlines our general product direction
GMC Inspire Cloud Services
 GMC Inspire Cloud Services Version 9.0 CLASSIFICATION: PUBLIC GMC Software AG 2013 GMC Software AG. All rights reserved. http://www.gmc.net/documentation GMC Inspire Cloud Services Product version 9.0
ithenticate User Manual
 ithenticate User Manual Version: 2.0.2 Updated March 16, 2012 Contents Introduction 4 New Users 4 Logging In 4 Resetting Your Password 5 Changing Your Password or Username 6 The ithenticate Account Homepage
CRGroup Whitepaper: Digging through the Data. www.crgroup.com. Reporting Options in Microsoft Dynamics GP
 CRGroup Whitepaper: Digging through the Data Reporting Options in Microsoft Dynamics GP The objective of this paper is to provide greater insight on each of the reporting options available to you within
Comparative Analysis Report:
 Comparative Analysis Report: Visualization Tools & Platforms By Annabel Weiner, Erol Basusta, Leah Wilkinson, and Quenton Oakes Table of Contents Executive Summary Introduction Assessment Criteria Publishability
Collections MAX Screen Pop Web Service
 Collections MAX Screen Pop Web Service User guide 2014 Table of Contents Collections MAX Screen Pop Web Service...3 About...4 Activation...5 Dialer Url...9 T-Max Dialer Configuration...10 Usage...13 Collections
with its unique General Ledger Drill Down feature, for any accounting software.
 with its unique General Ledger Drill Down feature, for any accounting software. Get the detail of an account balance, and the detail of a transaction, from the financial statements built with Excel FSM.
SAP BO Course Details
 SAP BO Course Details By Besant Technologies Course Name Category Venue SAP BO SAP Besant Technologies No.24, Nagendra Nagar, Velachery Main Road, Address Velachery, Chennai 600 042 Landmark Opposite to
Storytelling with Maps: Workflows and Best Practices
 Storytelling with Maps: Workflows and Best Practices Introduction What is a story map? Story maps are interactive maps combined with text and other content to tell a story about the world. Typically story
MEDIAplus administration interface
 MEDIAplus administration interface 1. MEDIAplus administration interface... 5 2. Basics of MEDIAplus administration... 8 2.1. Domains and administrators... 8 2.2. Programmes, modules and topics... 10 2.3.
MicroStrategy Desktop
 MicroStrategy Desktop Quick Start Guide MicroStrategy Desktop is designed to enable business professionals like you to explore data, simply and without needing direct support from IT. 1 Import data from
TechTips. Connecting Xcelsius Dashboards to External Data Sources using: Web Services (Dynamic Web Query)
") TechTips Connecting Xcelsius Dashboards to External Data Sources using: Web Services (Dynamic Web Query) A step-by-step guide to connecting Xcelsius Enterprise XE dashboards to company databases using
TechTips Connecting Xcelsius Dashboards to External Data Sources using: Web Services (Dynamic Web Query) A step-by-step guide to connecting Xcelsius Enterprise XE dashboards to company databases using
Promoting Your Location Platform
 Promoting Your Location Platform A Change Management Kit www.esri.com/changekit Publication Date: November 23, 2015 Esri: Promoting Your Location Platform 1 What is the Change Management Kit? The launch
Business Objects XI/R3.1 Corporate Training
 Business Objects XI/R3.1 Corporate Training Introduction to Business Objects XI/R3.1 Reporting Platform Introduction to Business Objects Universe Business Objects Universe Design and Development Business
COGNOS (R) 8 Business Intelligence
 8 Business Intelligence") COGNOS (R) 8 Business Intelligence QUERY STUDIO USER GUIDE Query Studio Quick Tour Cognos(R) 8 Business Intelligence Readme Query Studio User Guide USER GUIDE THE NEXT LEVEL OF PERFORMANCE TM Product Information
COGNOS (R) 8 Business Intelligence QUERY STUDIO USER GUIDE Query Studio Quick Tour Cognos(R) 8 Business Intelligence Readme Query Studio User Guide USER GUIDE THE NEXT LEVEL OF PERFORMANCE TM Product Information
Internal User Guide. AECsoft USA, Inc 1776 Yorktown Ste 435 Houston, TX 77056 1-800-233-1121
 AECsoft USA, Inc 1776 Yorktown Ste 435 Houston, TX 77056 1-800-233-1121 Table of Contents Internal User Guide Outlook... 3 Supplier... 4 Search Supplier... 4 Simple Search... 4 Advanced Search... 4 Dynamic