Data Visualization on Istat's Web site. Giulia Mottura Vincenzo Patruno
|
|
|
- Robert Wade
- 10 years ago
- Views:
Transcription
1 on Istat's Web site Giulia Mottura Vincenzo Patruno Istat - Aula Magna 26 Aprile 2010

2 Value of Data Visualization Latest web technologies and the expectations they create amongst the user community are changing the way Statistical organizations communicate statistics. When planning statistical communication strategy, it s necessary to pay attention to trends in online media. The Web is changing: the message has to be presented in an even more interesting way to capture the interest of a larger audience. To make the best use of the Internet, we must use the most appropriate language and presentation tools. In this way, systems for dynamic graphics make statistics alive and easier to understand even for non-experts: data visualization is key to extracting instant meaning from large amounts of information.

3 Presenting statistics To reach large audiences, the information should be presented in a structured and well organized way. Providing metadata to help users understand the statistics Providing data in a range of formats, including new devices such as mobile phones or others Ensuring accessibility to information for everybody, in compliance with legal requirements. Equal access to basic statistical information is a fundamental principle even though it requires extra work and extra resources. With the growth of Web 2.0 technologies, users can interact with data and create their own visualizations. Many statistical institutions provide access to their databases through their websites, allowing users to query and download statistical information by themselves. This functionality is even more complemented by visualization tools that allow users to create charts or maps online. Giving this level of control to users imply some risks; indeed, problems can be minimized by providing metadata, offering support and monitoring any misuse (1). (1). cfr Making Data Meanigful: a guide to presenting statistics. Unece, 2009

4 To better communicate statistics Graphical representations, useful to better communicate statistics, may have a dual function: describing the results and allowing a synthetic presentation of the observed phenomena and trends. Visual approach to statistics involves a graphical component (encoding information in digital images) and a perceptual component that decodes the information included in the graph(2). Preparation of charts have to take statistical issues into account, but also those related to perceptual and cognitive psychology and its communicative value. The communicative effectiveness of a graph depends on the clarity of the message conveyed. Data may contain several messages we may want to highlight using a chart. The effectiveness of data visualization is the result of a collaborative effort of three expertises: communication, statistical know-how and software solutions. (2). cfr. Presentare e comunicare le statistiche: principi, componenti e valutazione della loro qualità. Maggino/Trapani, SIS Magazine, 2009

5 Common data models To communicate the key-aspects of a complex data set in a more intuitive way, graphic form and functionality need to go hand in hand. Evolution of statistical graphs depends on the interaction of specific factors: new study on human perception of quantitative information presentation software for complex graphics applications. The development of sophisticated websites allowing data extraction through visualisation tools is fundamental not only to ensure the understanding of statistical information and its widest dissemination, but also to allow reusability of our information. The use of common data models, such as SDMX, provide effective support for users to combine data from multiple sources (mashup) and to access them with clever visualisation tools. A good example of an SDMX-based visualisation tool is the ECB Inflation Dashboard.

6 An aggregator We are developing the next Istat's web site as an aggregator able to pick up contents from other systems and adapt them, creating added-value information.

7 A site for Everybody The aggregator provide a public access to communicate a standard set of information and metainformation: Economic data, population in Italian municipalities, migration charts, etc. Search, link to DW, News, Press Releases, Events, Tools, selected Widgets with syntetic data, special Areas (Educational, Gender, Regions,...) A site for Everybody

8 A site for Everyone and a custom-made access for authenticated users: a content aggregator where user can build his own site selecting data from a list of widgets Economic data, population in italian municipalities, migration charts, etc. A site for Everyone

9 Visual component Selected contents of the site come from: Datawarehouse I.Stat (for figures) Wiki Publishing System (statistics explained) Other sources by RSS feed and webservices The visual component of the web site will consider two kind of visualization tools: access to a complex tool for expert users (like Istat explore), thanks to the interaction with the dwh I.Stat thematical widgets that respond to specific communication issues (a good example is the interactive room on CBS website).
, thanks to the interaction with the dwh I.")
10 Widgets What's a Widget and Why do we Need it? A widget is a portable chunk of code that can be installed and executed within any separate HTMLbased web page by an end user without requiring additional compilation

11 Widgets

12 Widgets Data producer Data consumer

13 Widgets A widget is an application that can be embedded into third party sites by any user on a page where they have rights of authorship (eg. a webpage, blog, or profile on a social media site)

14 Widgets

15 Widgets and API Embed code <script type="text/javascript" src=" </script>

16 Widgets and API Embed code <script type="text/javascript" src=" </script>

17 Widgets and API Embed code <script type="text/javascript" src=" </script>

18 Widgets Working with widgets is similar to work with LEGO stones

19 Widgets

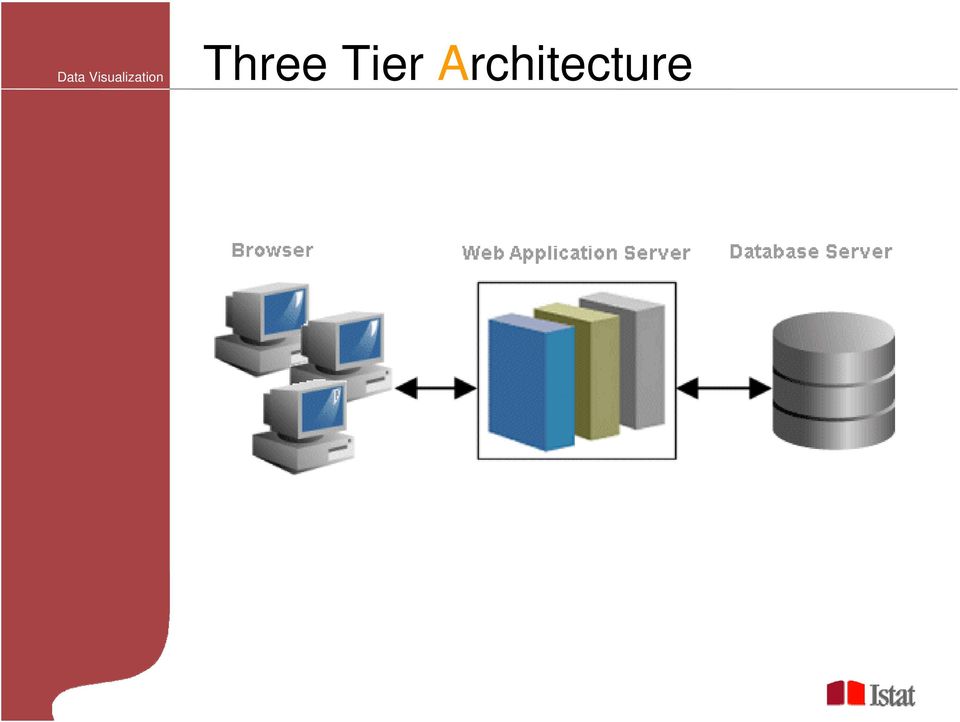
20 Three Tier Architecture
21 API Web Services Regional Statistics
22 mobile.istat.it
23 Mobile Future is Mobile
24 The Blogosphere Web Services
25 The New Web User The user isn t a reader of the Web. The New Web User is now a protagonist of the Web. The New Web User plays an active role to disseminate, to share, to discuss, to promote and to improve information.
26 Data Sharing
Improving the visualisation of statistics: The use of SDMX as input for dynamic charts on the ECB website
 Improving the visualisation of statistics: The use of SDMX as input for dynamic charts on the ECB website Xavier Sosnovsky, Gérard Salou European Central Bank Abstract The ECB has introduced a number of
JamiQ Social Media Monitoring Software
 JamiQ Social Media Monitoring Software JamiQ's multilingual social media monitoring software helps businesses listen, measure, and gain insights from conversations taking place online. JamiQ makes cutting-edge
Using Statistical data formats in visualization
 Using Statistical data formats in visualization Background Statistics explorer: Generic statistics visualization Background Focus is on visualization, but that is useless without data and data is useless
Introduction to Demand Generation Systems David M. Raab Raab Associates Inc.
 Introduction to Demand Generation Systems David M. Raab Raab Associates Inc. What is a demand generation system? The short answer is, it s a system designed to help marketers acquire, nurture and distribute
itunes Store Publisher User Guide Version 1.1
 itunes Store Publisher User Guide Version 1.1 Version Date Author 1.1 10/09/13 William Goff Table of Contents Table of Contents... 2 Introduction... 3 itunes Console Advantages... 3 Getting Started...
AN INTEGRATION APPROACH FOR THE STATISTICAL INFORMATION SYSTEM OF ISTAT USING SDMX STANDARDS
 Distr. GENERAL Working Paper No.2 26 April 2007 ENGLISH ONLY UNITED NATIONS STATISTICAL COMMISSION and ECONOMIC COMMISSION FOR EUROPE CONFERENCE OF EUROPEAN STATISTICIANS EUROPEAN COMMISSION STATISTICAL
Spotfire and Tableau Positioning. Summary
 Licensed for distribution Summary Both TIBCO Spotfire and Tableau allow users of various skill levels to create attractive visualizations of data, displayed as charts, dashboards and other visual constructs.
INSPIRE Dashboard. Technical scenario
 INSPIRE Dashboard Technical scenario Technical scenarios #1 : GeoNetwork catalogue (include CSW harvester) + custom dashboard #2 : SOLR + Banana dashboard + CSW harvester #3 : EU GeoPortal +? #4 :? + EEA
Oracle Application Express Cloud Development. Jan Huyzentruyt - Stijn Van Raes
 Oracle Application Express Cloud Development Jan Huyzentruyt - Stijn Van Raes Join the buzz: Wifi available Twitter #oracleopenxperience @oopenxperience 2 Agenda What is? in the Database Cloud Q & A 3
The Socialtext Enterprise Collaboration Platform
 The Socialtext Enterprise Collaboration Platform Socialtext transforms business processes and organizational culture by bringing real-time collaboration to the enterprise. By unlocking knowledge, expertise,
HLG Initiatives and SDMX role in them
 United Nations Economic Commission for Europe Statistical Division National Institute of Statistics and Geography of Mexico HLG Initiatives and SDMX role in them Steven Vale UNECE [email protected]
Project Management System Services
 Project Management System Services Today's projects need to deal with increasing amounts of information that require better tools to help navigate through all the data produced by projects. Our services
Data Visualisation and Its Application in Official Statistics. Olivia Or Census and Statistics Department, Hong Kong, China [email protected].
 Data Visualisation and Its Application in Official Statistics Olivia Or Census and Statistics Department, Hong Kong, China [email protected] Abstract Data visualisation has been a growing topic of
PRONTO-Xi Business Intelligence
 Business Intelligence Copyright 2011 Pronto Software Pty Ltd. All rights reserved. PRONTO Xi Business Intelligence Overview Trademarks - PRONTO, PRONTO ENTERPRISE MANAGEMENT SYSTEM, PRONTO SOFTWARE (Logo)
SAP S/4HANA Embedded Analytics
 Frequently Asked Questions November 2015, Version 1 EXTERNAL SAP S/4HANA Embedded Analytics The purpose of this document is to provide an external audience with a selection of frequently asked questions
How Cisco IT Evolved Enterprise Social Software and Collaboration
 December 2011 How Cisco IT Evolved Enterprise Social Software and Collaboration Cisco gains more business value by migrating Web 2.0 tools to Cisco WebEx Social Cisco IT Case Study/Collaboration/Enterprise
Microsoft Visio 2010 Business Intelligence
 Microsoft Visio 2010 Business Intelligence St. Louis SharePoint User Group Candy Parisi Microsoft Visio Solution Specialist April 10, 2012 Agenda Microsoft Business Intelligence Overview Visio Business
Tentative Schedule for Webinar Version
 Drury University's Graduate Level Social Media Program http://socialmediacertificate.net/ For questions about the program, contact: Curt Gilstrap, Ph.D. Director, Social Media Certificate Drury University
OpenText Information Hub (ihub) 3.1 and 3.1.1
 3.1 and 3.1.1") OpenText Information Hub (ihub) 3.1 and 3.1.1 OpenText Information Hub (ihub) 3.1.1 meets the growing demand for analytics-powered applications that deliver data and empower employees and customers to
OpenText Information Hub (ihub) 3.1 and 3.1.1 OpenText Information Hub (ihub) 3.1.1 meets the growing demand for analytics-powered applications that deliver data and empower employees and customers to
Social Media Glossary of Terms
 Social Media Glossary of Terms A Adsense: Google's pay-per-click, context-relevant program available to blog and web publishers as a way to create revenue. Adwords: advertiser program that populates the
Reporting. Understanding Advanced Reporting Features for Managers
 Reporting Understanding Advanced Reporting Features for Managers Performance & Talent Management Performance & Talent Management combines tools and processes that allow employees to focus and integrate
The Clear Path to Business Intelligence
 SAP Solution in Detail SAP Solutions for Small Businesses and Midsize Companies SAP Crystal Solutions The Clear Path to Business Intelligence Table of Contents 3 Quick Facts 4 Optimize Decisions with SAP
SENSE/NET 6.0. Open Source ECMS for the.net platform. www.sensenet.com 1
 SENSE/NET 6.0 Open Source ECMS for the.net platform www.sensenet.com 1 ABOUT THE PRODUCT: SENSE/NET 6.0 About the product 2 KEY FEATURES Workspaces-based collaboration Document management Office integration
Dashboard Reporting Business Intelligence
 Dashboard Reporting Dashboards are One of 5 Styles of BI Applications Increasing Analytics & User Interactivity Advanced Analysis & Ad Hoc OLAP Analysis Reporting Ad Hoc Analysis Predictive Analysis Data
The Intelligence Engine.
 The Intelligence Engine. Simple Search Simple Search offers a straightforward approach to searching, allowing you to target by source or date for high-quality relevant results. Key Word Searching Use the
University Website Development Project
 Information Services Knowledge Strategy Committee 16 June 2009 University Website Development Project Brief description of the paper This paper provides an update to KSC on project progress for the University
Genius Mail: Hospitality. Unlock the marketing, sales and branding Potential of your most trusted and used business communication channel
 : Hospitality Unlock the marketing, sales and branding Potential of your most trusted and used business communication channel Everyday Business Email Unlock the marketing, sales and branding potential
Copyright EPiServer AB
 Table of Contents 3 Table of Contents ABOUT THIS DOCUMENTATION 4 HOW TO ACCESS EPISERVER HELP SYSTEM 4 EXPECTED KNOWLEDGE 4 ONLINE COMMUNITY ON EPISERVER WORLD 4 COPYRIGHT NOTICE 4 EPISERVER ONLINECENTER
How Social CRM is changing the sales landscape
 Guide to CRM 2.0 How Social CRM is changing the sales landscape Sabine Kirchem Dusan Saric ec4u expert consulting ag Contents 1 Introduction... 3 2 What is Web 2.0?... 3 3 About Sales 2.0 and CRM 2.0...
ORACLE APPLICATION EXPRESS 5.0
 ORACLE APPLICATION EXPRESS 5.0 Key Features Fully supported nocost feature of the Oracle Database Simple 2-Tier Architecture Develop desktop and mobile applications 100% Browserbased Development and Runtime
WordPress & RSS: What You Need to Know
 Revised June-2011 Cooperative Extension Technology Services : What You Need to Know Many websites, including Coop s WordPress sites, use RSS technology to continuously feed announcements of their latest
SHAREPOINT 2013 NO-CODE SOLUTIONS FOR POWER USERS. Jamie McAllister
 SHAREPOINT 2013 NO-CODE SOLUTIONS FOR POWER USERS Jamie McAllister Agenda Introduction What is a code-free Solution? The Importance of Governance (and Training!) Overview of the Different Solution Types
Using Social Networking Sites as a Platform for E-Learning
 Using Social Networking Sites as a Platform for E-Learning Mohammed Al-Zoube and Samir Abou El-Seoud Princess Sumaya University for Technology Key words: Social networks, Web-based learning, OpenSocial,
By Makesh Kannaiyan [email protected] 8/27/2011 1
 Integration between SAP BusinessObjects and Netweaver By Makesh Kannaiyan [email protected] 8/27/2011 1 Agenda Evolution of BO Business Intelligence suite Integration Integration after 4.0 release
Novell Collaboration Vibe OnPrem
 Novell Collaboration Vibe OnPrem Evergreen Preview Corne Groesbeek Open Horizons Tracy Smith Product Manager [email protected] Collaboration Solutions Collaboration solutions from Novell help enterprise
IT Insights. Using Microsoft SharePoint 2013 to build a robust support and training portal. A service of Microsoft IT Showcase
 IT Insights A service of Microsoft IT Showcase Using Microsoft SharePoint 2013 to build a robust support and training portal June 2015 The Microsoft IT team that is responsible for hosting customer and
Business Process Management In An Application Development Environment
 Business Process Management In An Application Development Environment Overview Today, many core business processes are embedded within applications, such that it s no longer possible to make changes to
Business Intelligence and Dashboards - The New Generation
 IBM Software White Paper Business Analytics Software Extending business intelligence with dashboards 2 Extending business intelligence with dashboards Overview Imagine being able to track the key performance
Using Tableau Software with Hortonworks Data Platform
 Using Tableau Software with Hortonworks Data Platform September 2013 2013 Hortonworks Inc. http:// Modern businesses need to manage vast amounts of data, and in many cases they have accumulated this data
How To Choose A Business Intelligence Toolkit
 Background Current Reporting Challenges: Difficulty extracting various levels of data from AgLearn Limited ability to translate data into presentable formats Complex reporting requires the technical staff
Solution Showcase Session. Enterprise 2.0 Computing Services
 Solution Showcase Session Enterprise 2.0 Computing Services IDEA Lab Competencies Business Solutions Competency Verification and Validation Competency Business Intelligence Competency Managed Services
Social Media Guidelines for Best Practice
 Social Media Guidelines for Best Practice September 2009 Contents: Listen and research the social media environment Page 3 & 4 Set the parameters before you start Page 4 Getting Started Page 5-6 In Summary
Competencies for Secondary Teachers: Computer Science, Grades 4-12
 1. Computational Thinking CSTA: Comp. Thinking 1.1 The ability to use the basic steps in algorithmic problemsolving to design solutions (e.g., problem statement and exploration, examination of sample instances,
The Practice of Social Research in the Digital Age:
 Doctoral Training Centre: Practice of Social Research The Practice of Social Research in the Digital Age: Technologies of Social Research and Sources of Secondary Data Analysis Dr. Eric Jensen [email protected]
Five Levels of Embedded BI From Static to Analytic Applications
 5 Five Levels of Embedded BI From Static to Analytic Applications Introduction The expanding role of data in business management promises smarter operational applications that manage and automate better
The adidas Group Social Media Guidelines
 The adidas Group Social Media Guidelines pagina 1 van 17 pagina 2 van 17 1. You have a voice! (...but please remember: only very few people are official spokesperson for the Group or its brands) 2. You
Winning with an Intuitive Business Intelligence Solution for Midsize Companies
 SAP Product Brief SAP s for Small Businesses and Midsize Companies SAP BusinessObjects Business Intelligence, Edge Edition Objectives Winning with an Intuitive Business Intelligence for Midsize Companies
Software Requirements Specification. For. Get Real Website. Version 0.2. Prepared by Ken Cone. OUS Industry Affairs <7/16/07> Page i of 10
 Software Requirements Specification For Get Real Website Version 0.2 Prepared by Ken Cone OUS Industry Affairs Page i of 10 Page 1 Table of Contents Table of Contents... 1 Revision History...
Advanced Training Reliance Communications, Inc.
 Reliance Communications, Inc. 603 Mission Street Santa Cruz, CA 95060 888-527-5225 www.schoolmessenger.com Contents Contents... 2 Before you Begin... 4 Advanced Lists... 4 List Builder... 4 Create a List...
Microsoft Visio 2010 Top 10 Benefits
 Microsoft Visio 2010 Top 10 Benefits The advanced diagramming tools of Microsoft Visio 2010 help you simplify complexity with dynamic, data-driven visuals and new ways to share on the Web in real-time.
Collaboration. Michael McCabe Information Architect [email protected]. black and white solutions for a grey world
 Collaboration Michael McCabe Information Architect [email protected] black and white solutions for a grey world Slide Deck & Webcast Recording links Questions and Answers We will answer questions at
Making confident decisions with the full spectrum of analysis capabilities
 IBM Software Business Analytics Analysis Making confident decisions with the full spectrum of analysis capabilities Making confident decisions with the full spectrum of analysis capabilities Contents 2
and BI Services Overview CONTACT W: www.qualia.hr E: [email protected] M: +385 (91) 2010 075 A: Lastovska 23, 10000 Zagreb, Croatia
 2010 075 A: Lastovska 23, 10000 Zagreb, Croatia") and BI Services Overview CONTACT W: www.qualia.hr E: [email protected] M: +385 (91) 2010 075 A: Lastovska 23, 10000 Zagreb, Croatia Reports *web business intelligence software Easy to use, easy to deploy.
and BI Services Overview CONTACT W: www.qualia.hr E: [email protected] M: +385 (91) 2010 075 A: Lastovska 23, 10000 Zagreb, Croatia Reports *web business intelligence software Easy to use, easy to deploy.
Unresolved issues with the course, grades, or instructor, should be taken to the point of contact.
 Graphics and Data Visualization CS1501 Fall 2013 Syllabus Course Description With the advent of powerful data-mining technologies, engineers in all disciplines are increasingly expected to be conscious
Ad Hoc Analysis of Big Data Visualization
 Ad Hoc Analysis of Big Data Visualization Dean Yao Director of Marketing Greg Harris Systems Engineer Follow us @Jinfonet #BigDataWebinar JReport Highlights Advanced, Embedded Data Visualization Platform:
Visual Analytics: Empower Your Organization through Interactive Data
 Visual Analytics: Empower Your Organization through Interactive Data Heather Campbell Suzanne Franzino Alison Sommers-Sayre Sponsored by Humans Wired for Pictures Recent Love Affair With Numbers Technology
A GENERAL TAXONOMY FOR VISUALIZATION OF PREDICTIVE SOCIAL MEDIA ANALYTICS
 A GENERAL TAXONOMY FOR VISUALIZATION OF PREDICTIVE SOCIAL MEDIA ANALYTICS Stacey Franklin Jones, D.Sc. ProTech Global Solutions Annapolis, MD Abstract The use of Social Media as a resource to characterize
ResearchGate. Scientific Profile. Professional network for scientists. ResearchGate is. Manage your online presence
 ResearchGate Professional network for scientists Social Network ResearchGate Manage your online presence Scientific Profile ResearchGate is the largest professional network for scientists; it enables researchers
Instructional Design Framework CSE: Unit 1 Lesson 1
 Instructional Design Framework Stage 1 Stage 2 Stage 3 If the desired end result is for learners to then you need evidence of the learners ability to then the learning events need to. Stage 1 Desired Results
Experimenting in the domain of RIA's and Web 2.0
 Experimenting in the domain of RIA's and Web 2.0 Seenivasan Gunabalan IMIT IV Edition, Scuola Suoperiore Sant'Anna,Pisa, Italy E-mail: [email protected] ABSTRACT This paper provides an overview
Essential New Media Terms
 Affiliate Marketing: A popular marketing technique that partners merchant with website in which the merchant compensates the website based on performance (e.g. referrals). Aggregator: Also referred to
Top 5 best practices for creating effective dashboards. and the 7 mistakes you don t want to make
 Top 5 best practices for creating effective dashboards and the 7 mistakes you don t want to make p2 Financial services professionals are buried in data that measure and track: relationships and processes,
Best Free Magento Extensions for Social Network By : M Connect Media
 Best Free Magento Extensions for Social Network By : M Connect Media About Social Shopping Social shopping and reference are one of the most excellent features added in ecommerce from last few years. Magento
Creating Effective Podcasts for Your Business
 Creating Effective Podcasts for Your Business Podcasting is an exciting new way to communicate with people both inside and outside your organization. Effective podcasts build a loyal audience that keeps
Housing Works. Content Management System Overview. Presented to: 12.16.13
 [! Content Management System Overview ]! Presented to: Housing Works 12.16.13 SAMPLES OF OUR DESIGN AND DEVELOPMENT WORK Juvenile Diabetes Research Foundation of Canada www.jdrf.ca Kroger Bringing Hope
SEO 101. Learning the basics of search engine optimization. Marketing & Web Services
 SEO 101 Learning the basics of search engine optimization Marketing & Web Services Table of Contents SEARCH ENGINE OPTIMIZATION BASICS WHAT IS SEO? WHY IS SEO IMPORTANT? WHERE ARE PEOPLE SEARCHING? HOW
Catalog Enhancements. VuFind
 Catalog Enhancements OPACs lack many of the features that students have come to expect from their interactive online information sources. As a gateway to a library s collection, the OPAC needs an upgrade.
Open Source Business Intelligence Intro
 Open Source Business Intelligence Intro Stefano Scamuzzo Senior Technical Manager Architecture & Consulting Research & Innovation Division Engineering Ingegneria Informatica The Open Source Question In
Source Type Definitions
 Source Type Definitions The Jobs2web Referral Engine sorts all of your visitor traffic into a Source Engine, and then categorizes it into a Source Type. Jobs2web has approximately 2,500 Source Engines
IM 2701 Multimedia Design and Web Development BSc in Business Information Systems. Chapter 01 Introduction to Multimedia Design
 IM 2701 Multimedia Design and Web Development BSc in Business Information Systems Chapter 01 Introduction to Multimedia Design Topics Definition of Multimedia Multimedia Elements Web Design Principles
Deploy. Friction-free self-service BI solutions for everyone Scalable analytics on a modern architecture
 Friction-free self-service BI solutions for everyone Scalable analytics on a modern architecture Apps and data source extensions with APIs Future white label, embed or integrate Power BI Deploy Intelligent
QUICK FEATURE GUIDE OF SNAPPII'S ULTRAFAST CODELESS PLATFORM
 QUICK FEATURE GUIDE OF SNAPPII'S ULTRAFAST CODELESS PLATFORM (* Click on the screenshots to enlarge) TABLE OF CONTENTS 1. Visually Develop Mobile Applications 2. Build Apps for Any Android or ios Device
CRGroup Whitepaper: Digging through the Data. www.crgroup.com. Reporting Options in Microsoft Dynamics GP
 CRGroup Whitepaper: Digging through the Data Reporting Options in Microsoft Dynamics GP The objective of this paper is to provide greater insight on each of the reporting options available to you within
INTERACTIVE CONTENT AND DYNAMIC PUBLISHING A VITAL PART OF AN NSO S OUTPUT AND COMMUNICATION STRATEGY
 INTERACTIVE CONTENT AND DYNAMIC PUBLISHING A VITAL PART OF AN NSO S OUTPUT AND COMMUNICATION STRATEGY BOROWIK, Jenine; BRANSON, Merry and WATSON, Debbie Australian Bureau of Statistics ABS House 45Benjamin
Ernesto Ongaro BI Consultant February 19, 2013. The 5 Levels of Embedded BI
 Ernesto Ongaro BI Consultant February 19, 2013 The 5 Levels of Embedded BI Saleforce.com CRM 2013 Jaspersoft Corporation. 2 Blogger 2013 Jaspersoft Corporation. 3 Linked In 2013 Jaspersoft Corporation.
Internet Marketing Workshop Web 2.0
 Internet Marketing Workshop Web 2.0 September 2007 Caribbean Regional Sustainable Tourism Development Programme European Commission Caribbean Tourism Organization Cariforum World Wide Web: Constant Innovation
Graphic Arts Course Outcome Summary Riverdale High School Information CourseTitle
 Graphic Arts Course Outcome Summary Riverdale High School Information CourseTitle Graphic Arts Credits 1 Contact Hours 71 Instructional Area Art Instructional Level Intermediate Organization Riverdale