Mapping the soil gas radon concentration and soil permeability and their relation to pedological and geological background
|
|
|
- Griselda Floyd
- 10 years ago
- Views:
Transcription

1 VII. Hungarian Radon Forum and Radon in Environment Satellite Workshop május , Veszprém, Hungary Mapping the soil gas radon concentration and soil permeability and their relation to pedological and geological background Katalin Zsuzsanna Szabó 1, Gyozo Jordan 2, Ákos Horváth 3, László Pásztor 2, Zsófia Bakacsi 2, Csaba Szabó 1 1 Lithosphere Fluid Research Lab, Department of Petrology and Geochemistry, Eötvös University, Budapest, Hungary ([email protected]) 2 Institute for Soil Sciences and Agricultural Chemistry, Centre for Agricultural Research, Hungarian Academy of Sciences 3 Department of Atomic Physics, Eötvös University, Budapest, Hungary

2 Aims Take the first steps towards Hungarian geogenic radon potential mapping Describe the geological formations from radon, permeability and radon potential point of view Understand the spatial variation of these variables Understand the relationship between these variables and geological/pedological features Compile a geogenic radon potential map for the studied area Selection of measurement sites Geological background Populated areas km 2 grid net

3 Study area and measurement sites Middle Hungary (~5400 km 2 ) Geological background Mesozoic sedimentary rocks (limestone,dolomite) Tertiary volcanic rocks (andezite, dacite) Tertiary sedimentary rocks (marl, clay, sandstone) Quaternary sediments (loess, sand, fluvial sediment)
 Quaternary sediments (loess, sand, fluvial")
4 Study area and measurement sites Middle Hungary (~5400 km 2 ) Geological background Mesozoic sedimentary rocks (limestone,dolomite) Tertiary volcanic rocks (andezite, dacite) Tertiary sedimentary rocks (marl, clay, sandstone) Quaternary sediments (loess, sand, fluvial sediment) Populated areas Budapest
 Quaternary sediments (loess, sand, fluvial sediment) Populated")
5 Study area and measurement sites Middle Hungary (~5400 km 2 ) Geological background Mesozoic sedimentary rocks (limestone,dolomite) Tertiary volcanic rocks (andezite, dacite) Tertiary sedimentary rocks (marl, clay, sandstone) Quaternary sediments (loess, sand, fluvial sediment) Populated areas Grid net km 2 Budapest
 Populated areas Grid net 10")
6 Study area and measurement sites Middle Hungary (~5400 km 2 ) Geological background Mesozoic sedimentary rocks (limestone,dolomite) Tertiary volcanic rocks (andezite, dacite) Tertiary sedimentary rocks (marl, clay, sandstone) Quaternary sediments (loess, sand, fluvial sediment) Populated areas Grid net km 2 Measurement sites average 3 sites per cell altogether 192 sites

7 Measurement methods Soil gas radon concentration and soil permeability RAD7 radon monitor (soild state semiconductor detecto, radon daughter detection) + soil gas probe GRAB protocol (30 min) 5 min pumping (1l/min) 5 min waiting for radioactive equilibrium 4 5 min counting ( 218 Po) RADON - JOK permeameter Sampling depth is generally 0.8 m RADON - JOK permeameter RAD7 + soil gas probe 15 cm

8 Calculation of geogenic radon potential Geogenic radon potential (GRP) Neznal et al. (2004) GRP log c 10 k 10 where c is the equilibrium soil gas radon concentration at a definite depth (0.8 m) (kbq m -3 ) k is the soil permeability (m 2 ) GRP<10 LOW GRP 10<GRP<35 MEDIUM GRP GRP>35 HIGH GRP

9 percentage cumulative probability frequency frequency Results Box-and-Whisker Plot Soil gas radon concentration (kbq m -3 ) Count 192 Average 14.1 Median 10.9 Standard deviation 10.2 Coeff. of variation 71.9 % MAD 5.7 Minimum 1.0 Maximum 47.1 Range 46.2 Lower quartile 6.8 Upper quartile 19.2 Interquartile range radon_1 Histogram for radon Histogram Distribution Lognormal Khi-squared and Kolmogorov-Smirnov tests data follow lognormal distribution radon radon Normal Quantile Probability probability Plot Plot plot radon Distribution Lognormal

10 Results Legend (kbq m -3 ) Soil gas radon concentration Outliers >36 kbq m -3 Tertiary sedimentary rock: clay Quaternary sediments Proluvial-deluvial sediments Fluvial sediment Sandy loess Loess

11 median median Soil gas radon concentration on different geological formations 41 geological formations median of the measured soil gas radon concentrations of the geological formations 3 groups 5 geological formations have >8 data Median Median Gr2 Gr Tozeg 1 Buda rsi Dolomit Formßci= 1 Fut=homok 9 Tinnyei Formßci= 3 Foly=vfzi nledtk (V. terasz) 2 Mtsziszap 2 Nagyalf ldi Tarkaagyag Formßci= (befogla 7 Dobog=koi Andezit Formßci= (B rzs ny-vis 2 Drift sand 9 Fluvioeolic sand 27 Gr3 Fodolomit Formßci= 1 Foly=vfzi agyag 1 Fluvioeolikus homok 27 Mßnyi Formßci= 1 Foly=vfzi homok 14 V r sagyag 3 Foly=vfzi-proluvißlis nledtk 1 Mßnyi Ts T r kbßlinti Formßci= ßtmenete 1 Zagyvai Formßci= 1 Szilßgyi Agyagmßrga Formßci= 1 Cs=dihegyi Dßcit Tagozat 1 Dorogi Ts Csolnok Formßci= sszevontan 2 Fluvial sand 14 L sz s homok 3 Kavics, lejtot rmeltk 2 Egyhßzasgergei Ts Garßbi Formßci= sszev 1 Homokos l sz 7 Homokos l sz, l sz s homok 2 L sz 30 Nagyalf ldi Tarkaagyag Formßci= 3 SzTpv lgyi MTszko F. 3 GEO_név geological formation Folyovizi aleurit 6 Foly=vfzi aleuritos homok 2 Hßrshegyi Homokko Formßci= 2 Loess 30 T r kbßlinti Homokko Formßci= 3 Hidroeolikus agyagos l sz 3 Fluvial sediment 27 Deluvißlis aleurit 2 Foly=vfzi nledtk 27 Egyhßzasgergei Formßci= 1 Dachsteini mtszko F. 1 Kiscelli Agyag Formßci= 2 Nagyv lgyi Dßcittufa Formßci= (B rzs ny- 4 Deluvißlis agyag, homok 1 Proluvißlis-deluvißlis nledtk 3

 1 2 3 Püspökhatvan 1 2 3 1 2 3 Galgagyörk Pilisszentlászló")
12 Soil gas radon concentration on different geological formations Legend Gr1 (>28 Bq m -3 ) Quaternary proluvial, deluvial sediments (3) Püspökhatvan Galgagyörk Pilisszentlászló Galgamácsa

13 Soil gas radon concentration on different geological formations Gr1 (med soilrn >28 Bq m -3 ) Quaternary proluvial, deluvial sediments (4) Gr2 (med soilrn : Bq m -3 ) Tertiary (Miocene) dacite (1) Tertiary sedimentary clay (4) Mesozoic limestone (2) Tertiary sandstone (1) Quaternary fluvial sediment (27) Gr3(med soilrn < 20 Bq m -3 ) Quaternary loess (30) Quaternary fluvial sand (14) Quaternary fluvioeolic sand (27) Quaternary drift sand (9) etc. n>8
 Quaternary loess (30) Quaternary fluvial sand (14) Quaternary fluvioeolic sand (27) Quaternary")
14 Soil gas radon concentration (kbq m-3) Soil gas radon concentration in case of different soil texture Median Sand 68 Rocky 5 Light loam 44 Loam 63 Heavy loam clay 4 soil texture

15 Soil gas radon concentration (kbq m-3) Soil gas radon concentration in case of different chemical behaviour median Rocky, gravelly 3 mainly acid, upper soil is unsaturated with chalk, lower soil contains carbonated chalk 29 mainly neutral or alkalescent, unsaturated with chalk 143 mostly acid, upper soil is unsaturated with chalk, lower soil do not contains carbonated chalk 9

16 frequency Eredmények Box-and-Whisker Plot Soil permeability Count 192 Average Median Standard deviation 1.8 Coeff. of variation -6.9% MAD 1.4 Minimum Maximum Range 9.2 Lower quartile Upper quartile Interquartile range log(permea) Histogram log(permea) ln(permea)= (=2.5E-12 m 2 )
 Histogram -31-29 -27-25 -23-21 -19 log(permea)")

17 Eredmények Soil permeability
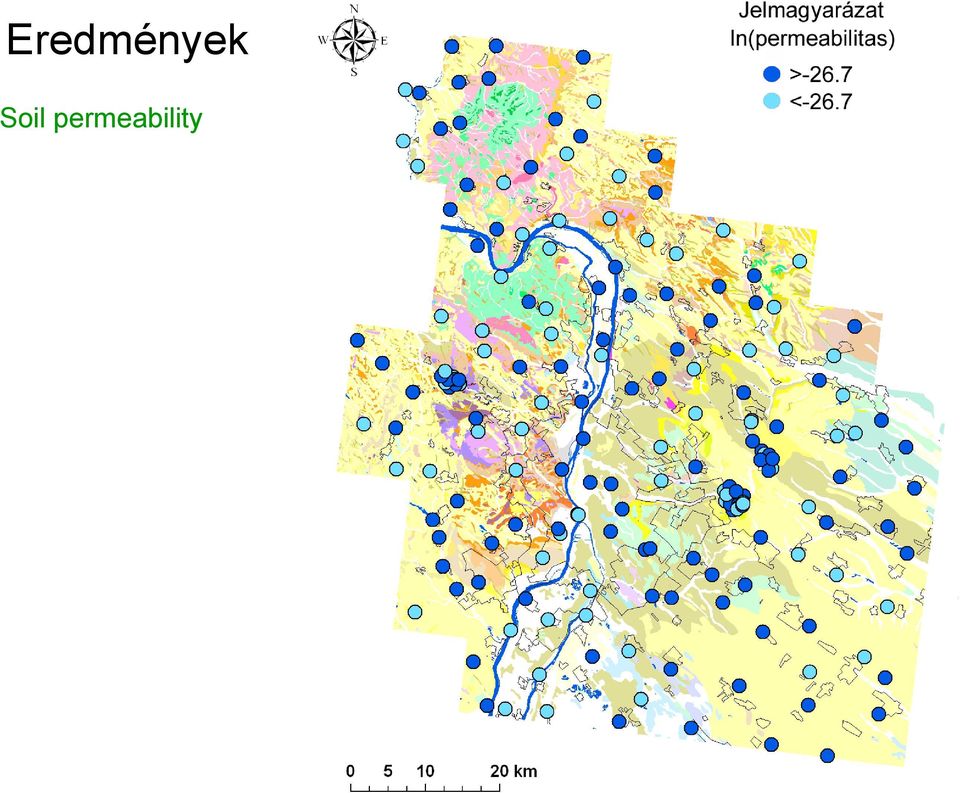
 high k medium k low k >4E-12 4E-12>k>4E-13 <4E-13")
18 Eredmények Soil permeability Categorization (Neznal et al., 2004) high k medium k low k >4E-12 4E-12>k>4E-13 <4E-13

19 med(log((permea)) med(log((permea)) Soil permeability on different geological formations med(permea) -27 Loess 30 Fluvial sand 14 Fluvial sediment 29 Fluvioeolic sand 31 Drift sand 9 geological formation geonev
 -27 Loess 30 Fluvial sand 14 Fluvial sediment 29")
20 Soil gas radon concentration and soil permeability on different geological formations R 2 = soil radon permea Drift sand 9 Fluvioeolic sand 31 Fluvial sand 14 Loess 30 Fluvial sediment 29 Geo_nev R 2 = -0.92

21 GRP (geogenic radon potential) Eredmények Count 192 Average 11.9 Median 8.7 Standard deviation 14.6 Coeff. of variation 121.9% MAD 4.7 Minimum Maximum 73.9 Range Lower quartile 4.7 Upper quartile 15.5 Interquartile range 10.7 GRP<10 low 10<GRP>35 medium GRP>35 high
 (kbq m -3 ) k is the soil permeability (m 2 ) Based on Czech data (Barnet and Pacherova, 2010) GRP Low (<10) Medium (10-35) High (>35) Indoor radon concentration <200 Bq m -3")
22 Results Geogenic radon potential (GRP) Neznal et al. (2004) c GRP log k where c is the equilibrium soil gas radon concentration at a definite depth (0.8 m) (kbq m -3 ) k is the soil permeability (m 2 ) Based on Czech data (Barnet and Pacherova, 2010) GRP Low (<10) Medium (10-35) High (>35) Indoor radon concentration <200 Bq m Bq m -3 >400 Bq m -3
23 Results GRP in case of different geological formations Folyóvízi-proluviális üledék 1 Mésziszap 2 Tozeg 1 Dobogókoi Andezit Formáció 2 Vörösagyag 3 Mányi és Törökbálinti Formáció átmenete 1 Nagyalföldi Tarkaagyag Formáció 7 Csódihegyi Dácit Tagozat 1 Folyóvízi homok 14 Futóhomok 9 Budaörsi Dolomit Formáció 1 Folyóvízi aleurit 7 Homokos lösz, löszös homok 2 Löszös homok 3 Fodolomit Formáció 1 Egyházasgergei és Garábi Formáció összev 1 Törökbálinti Homokko Formáció 3 Hidroeolikus agyagos lösz 3 Nagyalföldi Tarkaagyag Formáció 3 Mányi Formáció 1 Fluvioeolikus homok 28 Folyóvízi üledék (V. terasz) 2 Homokos lösz 7 Lösz 30 Folyóvízi aleuritos homok 3 Deluviális aleurit 2 Zagyvai Formáció 1 Folyóvízi üledék 27 Dachsteini mészko F. 1 Kavics, lejtotörmelék 2 Tinnyei Formáció 3 Kiscelli Agyag Formáció 2 Dorogi és Csolnok Formáció összevontan 2 Hárshegyi Homokko Formáció 2 Nagyvölgyi Dácittufa Formáció (Börzsöny- 4 Proluviális-deluviális üledék 3 Szilágyi Agyagmárga Formáció 2 Egyházasgergei Formáció 1 Szépvölgyi Mészko F. 2 Deluviális agyag, homok border of medium-high GRP border of low-medium GRP median of GRP values n>8

24 100% 0.03 Geogenic radon 90% potential 80% 0.28 map of the 70% study area 60% 50% 40% 30% 20% 10% 0% Based on our 192 data Percentage of low, medium and high GRP sites on the different GRP areaslegend LOW MEDIUM HIGH 1.0 GRP low medium high no data HIGH MEDIUM LOW GRP of the area Low (<10) Medium (10-35) High (>35) GRP of sites 69% low 28% medium 3% high 29% low 58% medium 13% high 0% low 0% medium 100% high
25 Summary Soil gas radon concentration data soil gas radon concentration data follow lognormal distribution it has spatial pattern and relationship to geological background, soil texture and soil chemical behaviour Soil permeability data there is no pattern in the soil permeability spatial distribution it has relationship to geological background there is negative linear correlation between soil gas radon concentration and soil permeability Geogenic radon potential it has relationship to geological background most of the study area has low and medium GRP medium GRP: Quaternary fluvial sediment high GRP in case of proluvial-deluvial sediments
26 Thank you very much for your attention! Acknowledgement Anna Dömök Tamás Gábner Zsuzsanna Szabó Roland Helf Hédi Nagy (ELTE TTK) Péter Völgyesi (ELTE TTK) Doctoral School for Environmental Sciences, Eötvös University The research was founded by the European Union and Hungary in the framework of the TÁMOP A/ National Excellence Program - National Program for elaboration and run a system for personal support for Hungarian students and researchers
Soil Gas Radon Concentration and Permeability at Valle della Caffarella Test Site (Roma, Italy).
.") Soil Gas Radon Concentration and Permeability at Valle della Caffarella Test Site (Roma, Italy). Evaluation of Gas Sampling Techniques and Radon Measurements Using Different Approaches Italian team Mauro
Soil Gas Radon Concentration and Permeability at Valle della Caffarella Test Site (Roma, Italy). Evaluation of Gas Sampling Techniques and Radon Measurements Using Different Approaches Italian team Mauro
Data Preparation and Statistical Displays
 Reservoir Modeling with GSLIB Data Preparation and Statistical Displays Data Cleaning / Quality Control Statistics as Parameters for Random Function Models Univariate Statistics Histograms and Probability
Shape of Data Distributions
 Lesson 13 Main Idea Describe a data distribution by its center, spread, and overall shape. Relate the choice of center and spread to the shape of the distribution. New Vocabulary distribution symmetric
Members of the Hungarian Section of The Combustion Institute 2011, before June
 Members of the Hungarian Section of The Combustion Institute 2011, before June Name: István Barótfi Spec.: bioenergetics, protection of environment Company/Affil.: Szent István University, Gödöllő Address:
Intro to Statistics 8 Curriculum
 Intro to Statistics 8 Curriculum Unit 1 Bar, Line and Circle Graphs Estimated time frame for unit Big Ideas 8 Days... Essential Question Concepts Competencies Lesson Plans and Suggested Resources Bar graphs
Development of an Online Soil Valuation Database
 Communications in Soil Science and Plant Analysis, 40: 1034 1040, 2009 Copyright # Taylor & Francis Group, LLC ISSN 0010-3624 print/1532-2416 online DOI: 10.1080/00103620802697954 Development of an Online
Abstract. Keywords: soil survey, rate of soil erosion, thickness of surface soil (A horizon), North Hungary, Energy Region Eger Research Model Area
, North Hungary, Energy Region Eger Research Model Area") THE RATE OF SURFACE EROSION AND THE THICKNESS OF SURFACE SOIL IN INVESTIGATED SOIL PROFILES SITUATED IN THE WESTERN PART OF THE ENERGY REGION EGER RESEARCH MODEL AREA, HUNGARY ANNA DOBOS 1 BALÁZS HEGYI
THE RATE OF SURFACE EROSION AND THE THICKNESS OF SURFACE SOIL IN INVESTIGATED SOIL PROFILES SITUATED IN THE WESTERN PART OF THE ENERGY REGION EGER RESEARCH MODEL AREA, HUNGARY ANNA DOBOS 1 BALÁZS HEGYI
Lecture 1: Review and Exploratory Data Analysis (EDA)
") Lecture 1: Review and Exploratory Data Analysis (EDA) Sandy Eckel [email protected] Department of Biostatistics, The Johns Hopkins University, Baltimore USA 21 April 2008 1 / 40 Course Information I Course
Lecture 1: Review and Exploratory Data Analysis (EDA) Sandy Eckel [email protected] Department of Biostatistics, The Johns Hopkins University, Baltimore USA 21 April 2008 1 / 40 Course Information I Course
WILLOCHRA BASIN GROUNDWATER STATUS REPORT 2009-10
 WILLOCHRA BASIN GROUNDWATER STATUS REPORT 2009-10 SUMMARY 2009-10 The Willochra Basin is situated in the southern Flinders Ranges in the Mid-North of South Australia, approximately 50 km east of Port Augusta
How To Map A Lake In The North Of The Holland (Fiji)
") 1. Hydrogelogical mapping Jiri Sima Aim of HG map Groundwater and rocks qualitative permeability and quantitative potential of rock units aquifers / aquitards / aquiclides Water points (spatial distribution
1. Hydrogelogical mapping Jiri Sima Aim of HG map Groundwater and rocks qualitative permeability and quantitative potential of rock units aquifers / aquitards / aquiclides Water points (spatial distribution
Vulnerability Assessment
 Vulnerability Assessment VULNERABILITY As used in this report, vulnerability refers to the sensitivity of groundwater to contamination, and is determined by intrinsic characteristics of the aquifer. It
RADON AND HEALTH. INFORMATION SHEET October 2002. What is radon and where does it come from?
 INFORMATION SHEET October 2 FINAL RADON AND HEALTH What is radon and where does it come from? Radon is a natural radioactive gas without odour, colour or taste. It cannot be detected without special equipment.
Carbonate Rock Formation
 Limestone, dolomite (or dolostone), and marble are often collectively referred to as carbonate rocks because the main mineral is calcite. The chemical name of calcite is calcium carbonate. Limestone, dolomite,
Geostatistics Exploratory Analysis
 Instituto Superior de Estatística e Gestão de Informação Universidade Nova de Lisboa Master of Science in Geospatial Technologies Geostatistics Exploratory Analysis Carlos Alberto Felgueiras [email protected]
3D stochastic modelling of litho-facies in The Netherlands
 3D stochastic modelling of litho-facies in The Netherlands Jan L. Gunnink, Jan Stafleu, Freek S. Busschers, Denise Maljers TNO Geological Survey of the Netherlands Contributions of: Armin Menkovic, Tamara
7.2.4 Seismic velocity, attenuation and rock properties
 7.2.4 Seismic velocity, attenuation and rock properties Rock properties that affect seismic velocity Porosity Lithification Pressure Fluid saturation Velocity in unconsolidated near surface soils (the
Review of Groundwater Vulnerability Assessment Methods Unsaturated Zone. Dept. of Earth Sciences University of the Western Cape
 Review of Groundwater Vulnerability Assessment Methods Unsaturated Zone Dept. of Earth Sciences University of the Western Cape Background Sililo et al. (2001) Groundwater contamination depends on: Intrinsic
Center: Finding the Median. Median. Spread: Home on the Range. Center: Finding the Median (cont.)
") Center: Finding the Median When we think of a typical value, we usually look for the center of the distribution. For a unimodal, symmetric distribution, it s easy to find the center it s just the center
Center: Finding the Median When we think of a typical value, we usually look for the center of the distribution. For a unimodal, symmetric distribution, it s easy to find the center it s just the center
REGULATIONS FOR THE POSTGRADUATE DIPLOMA IN EARTH SCIENCES (PGDES)
") REGULATIONS FOR THE POSTGRADUATE DIPLOMA IN EARTH SCIENCES (PGDES) (See also General Regulations) The Postgraduate Diploma in Earth Sciences is a postgraduate diploma awarded for the satisfactory completion
REGULATIONS FOR THE POSTGRADUATE DIPLOMA IN EARTH SCIENCES (PGDES) (See also General Regulations) The Postgraduate Diploma in Earth Sciences is a postgraduate diploma awarded for the satisfactory completion
BNG 202 Biomechanics Lab. Descriptive statistics and probability distributions I
 BNG 202 Biomechanics Lab Descriptive statistics and probability distributions I Overview The overall goal of this short course in statistics is to provide an introduction to descriptive and inferential
Master in Earth Sciences
 Master in Earth Sciences DERDW EARTH SCIENCES MASTER IN EARTH SCIENCES The Department of Earth Sciences at ETH Zurich has been repeatedly ranked as one of the world s leading Earth Science schools. The
STATS8: Introduction to Biostatistics. Data Exploration. Babak Shahbaba Department of Statistics, UCI
 STATS8: Introduction to Biostatistics Data Exploration Babak Shahbaba Department of Statistics, UCI Introduction After clearly defining the scientific problem, selecting a set of representative members
How To Manage Alfalfa
 MANAGING ALFALFA NUTRITION BY SOIL ANALYSIS IN THE DESERT SOUTHWESTERN UNITED STATES By Aron A. Quist and Michael J. Ottman 1 Introduction: High producing alfalfa responds well to phosphorus and potassium
Geoscientific spatial data
 SDIC European Sustainable Development related policies and legislation INSPIRE and geoscientific data P. Christmann, K. Asch, Rafaelle Pignone, I. Jackson, F. Robida, P. Ryghaug, R. Tomas, L. Persson,
ANALYSIS OF THUNDERSTORM CLIMATOLOGY AND CONVECTIVE SYSTEMS, PERIODS WITH LARGE PRECIPITATION IN HUNGARY. Theses of the PhD dissertation
 ANALYSIS OF THUNDERSTORM CLIMATOLOGY AND CONVECTIVE SYSTEMS, PERIODS WITH LARGE PRECIPITATION IN HUNGARY Theses of the PhD dissertation ANDRÁS TAMÁS SERES EÖTVÖS LORÁND UNIVERSITY FACULTY OF SCIENCE PhD
Proposed Geology Course Offering Fall 2015 Summer 2017 Courses in Red are Broadcast (IVC) or Online Courses (Revised 5-29-2015)
 or Online Courses (Revised 5-29-2015)") GEO 1110 - Physical Geology (3) - Lachmar Proposed Geology Course Offering Fall 2015 Summer 2017 Courses in Red are Broadcast (IVC) or Online Courses (Revised 5-29-2015) GEO 1115 - Physical Geology Lab
GEO 1110 - Physical Geology (3) - Lachmar Proposed Geology Course Offering Fall 2015 Summer 2017 Courses in Red are Broadcast (IVC) or Online Courses (Revised 5-29-2015) GEO 1115 - Physical Geology Lab
WM2012 Conference, February 26 March 1, 2012, Phoenix, Arizona, USA
 ABSTRACT Comparison of Activity Determination of Radium 226 in FUSRAP Soil using Various Energy Lines - 12299 Brian Tucker*, Jough Donakowski**, David Hays*** *Shaw Environmental & Infrastructure, Stoughton,
Reservoir Characterization and Initialization at Little Mitchell Creek
 Reservoir Characterization and Initialization at Little Mitchell Creek Shuiquan Li L A R A M I E, W Y, J U LY 2 4 T H, 2 0 1 3 Outline Objectives of the project Geological and geophysical results Progress
Anthropogenic geomorphology of quarrying and mining at the Eger Model Region
 Anthropogenic geomorphology of quarrying and mining at the Eger Model Region Árpád Dávid Eszterházy Károly College, Department of Physical Geography and Geoinformatics; H-3300 Eger, Leányka u. 6. Abstract
KÁROLY RÓBERT COLLEGE GYÖNGYÖS. Challenges and Prospects for Innovation between 2014-2020
 KÁROLY RÓBERT COLLEGE GYÖNGYÖS Challenges and Prospects for Innovation between 2014-2020 15th International Scientific Days 30 31 March, 2016 2nd Call 1 SCIENTIFIC COMMITTEE Chair Dinya László CSc, Professor,
Institute of Actuaries of India Subject CT3 Probability and Mathematical Statistics
 Institute of Actuaries of India Subject CT3 Probability and Mathematical Statistics For 2015 Examinations Aim The aim of the Probability and Mathematical Statistics subject is to provide a grounding in
430 Statistics and Financial Mathematics for Business
 Prescription: 430 Statistics and Financial Mathematics for Business Elective prescription Level 4 Credit 20 Version 2 Aim Students will be able to summarise, analyse, interpret and present data, make predictions
Ch6&7 Test. Multiple Choice Identify the choice that best completes the statement or answers the question.
 Ch6&7 Test Multiple Choice Identify the choice that best completes the statement or answers the question. 1. Which of the following does NOT change the form of existing rock? a. tremendous pressure c.
UNIVERSITY OF MISKOLC AAPG MISKOLC STUDENT CHAPTER SPRING/SUMMER REPORT OF 2013
 UNIVERSITY OF MISKOLC AAPG MISKOLC STUDENT CHAPTER SPRING/SUMMER REPORT OF 2013 MISKOLC, HUNGARY,, 28 SEPTEMBER 2013 INTRODUCTION The three years ago founded AAPG Miskolc Student Chapter can be proud of
A GIS BASED GROUNDWATER MANAGEMENT TOOL FOR LONG TERM MINERAL PLANNING
 A GIS BASED GROUNDWATER MANAGEMENT TOOL FOR LONG TERM MINERAL PLANNING Mauro Prado, Hydrogeologist - SRK Consulting, Perth, Australia Richard Connelly, Principal Hydrogeologist - SRK UK Ltd, Cardiff, United
VULNERABILITY ASSESSMENT OF GROUNDWATER RESOURCES IN THE LAMPANG BASIN OF NORTHERN THAILAND. Bangkok, Thailand, 10300. Chiang Mai, Thailand, 50200.
 VULNERABILITY ASSESSMENT OF GROUNDWATER RESOURCES IN THE LAMPANG BASIN OF NORTHERN THAILAND K. Kwansiririkul 1, F. S. Singharajwarapan 2, T. Ramingwong 2, and P. Wongpornchai 2 1 Office of Engineering
The CO2 Geological Storage: how it works
 The CO2 Geological Storage: how it works Salvatore Lombardi Carbonia, Centro Ricerche Sotacarbo, 27 novembre 2014 Contents of the presentation Notes on CO2 Geological Storage (CGS) How it works How we
Exploratory data analysis (Chapter 2) Fall 2011
 Fall 2011") Exploratory data analysis (Chapter 2) Fall 2011 Data Examples Example 1: Survey Data 1 Data collected from a Stat 371 class in Fall 2005 2 They answered questions about their: gender, major, year in school,
Exploratory data analysis (Chapter 2) Fall 2011 Data Examples Example 1: Survey Data 1 Data collected from a Stat 371 class in Fall 2005 2 They answered questions about their: gender, major, year in school,
ROMANIAN PANNONIAN BASIN Outstanding Opportunity
 ROMANIAN PANNONIAN BASIN Outstanding Opportunity Introduction East West Petroleum Corporation (EWP) is a Vancouver-based, public E&P company, focused on investing in emerging international E&P projects
CCS Risk Analysis. Vanessa Nuñez Lopez. CEPAC - CSLF Capacity Building Workshop Porto Alegre, Brazil July 30 Aug 3, 2012
 CCS Risk Analysis Vanessa Nuñez Lopez CEPAC - CSLF Capacity Building Workshop Porto Alegre, Brazil July 30 Aug 3, 2012 Leucadia Lake Charles Hastings Field Air Products Port Arthur West Hastings MVA area
Geologic Time Scale Newcomer Academy Visualization Three
 Geologic Time Newcomer Academy Visualization Three Chapter Subtopic/Media Key Points of Discussion Notes/Vocabulary Introduction Title NA NA Various Pictures of Geologic Time It s About Time Personal Timeline
Well-logging Correlation Analysis and correlation of well logs in Rio Grande do Norte basin wells
 Well-logging Correlation Analysis and correlation of well logs in Rio Grande do Norte basin wells Ricardo Afonso Salvador Pernes (March, 2013) [email protected] Master thesis Abstract During drilling
REGIONAL CLIMATE AND DOWNSCALING
 REGIONAL CLIMATE AND DOWNSCALING Regional Climate Modelling at the Hungarian Meteorological Service ANDRÁS HORÁNYI (horanyi( [email protected]@met.hu) Special thanks: : Gabriella Csima,, Péter Szabó, Gabriella
Chesapeake Bay Governor School for Marine and Environmental Science
 Choose the best answer and write on the answer sheet provided. 1. Which of the following is LEAST likely to be an effect of global warming? (a) Loss of fertile delta regions for agriculture (b) Change
The CO2 Geological Storage: how it works Salvatore Lombardi
 The CO2 Geological Storage: how it works Salvatore Lombardi Carbonia, Centro Ricerche Sotacarbo, 27 novembre 2014 Contents of the presentation Notes on CO2 Geological Storage (CGS) How it works How we
NOTES on the CONE PENETROMETER TEST
 GE 441 Advanced Engineering Geology & Geotechnics Spring 2004 Introduction NOTES on the CONE PENETROMETER TEST The standardized cone-penetrometer test (CPT) involves pushing a 1.41-inch diameter 55 o to
163 ANALYSIS OF THE URBAN HEAT ISLAND EFFECT COMPARISON OF GROUND-BASED AND REMOTELY SENSED TEMPERATURE OBSERVATIONS
 ANALYSIS OF THE URBAN HEAT ISLAND EFFECT COMPARISON OF GROUND-BASED AND REMOTELY SENSED TEMPERATURE OBSERVATIONS Rita Pongrácz *, Judit Bartholy, Enikő Lelovics, Zsuzsanna Dezső Eötvös Loránd University,
Week 1. Exploratory Data Analysis
 Week 1 Exploratory Data Analysis Practicalities This course ST903 has students from both the MSc in Financial Mathematics and the MSc in Statistics. Two lectures and one seminar/tutorial per week. Exam
CPT interpretation in marine soils less than 5m depth examples from the North Sea
 CPT interpretation in marine soils less than 5m depth examples from the North Sea R. Mitchell SEtech (Geotechnical Engineers) Limited, Great Yarmouth, England S. Wootton & R. Comrie SEtech (Geotechnical
Introducing the EIT ICT Labs Budapest Associate Partner Group
 Introducing the EIT ICT Labs Budapest Associate Partner Group Prof. Dr. Zoltán Horváth EIT ICT Labs Conference, Budapest 05 March, 2013 Contents The partners and the Co-location Centre National Development
ENERGY ARBITRATION COURT ROLL OF ARBITRATORS
 ENERGY ARBITRATION COURT ROLL OF ARBITRATORS PRESIDENT: MEMBERS OF THE BOARD: Dr. Faludi Zoltán Dr. Berzeviczi Attila Dr. Grmela Zoltán Dr. Lajer Zsolt Dr. Szentkereszty Ákos ARBITRATORS: 1. Dr. Balog
Unconventional Gas in Italy: the Ribolla Basin*
 Unconventional Gas in Italy: the Ribolla Basin* Roberto Bencini 1, Elio Bianchi 2, Roberto De Mattia 2, Alberto Martinuzzi 2, Simone Rodorigo 2, and Giuseppe Vico 2 Search and Discovery Article #80203
OPPORTUNITIES IN THE UPSTREAM SECTOR OF MONTENEGRO. Vladan Dubljević Tamara Pavličić
 OPPORTUNITIES IN THE UPSTREAM SECTOR OF MONTENEGRO Vladan Dubljević Tamara Pavličić Discussion Topics Business Environment Legal and fiscal regime Petroleum policy and resource management Fiscal system
APPENDIX B CHARACTERIZATION OF SOILS AT TEST SITES
 APPENDIX B HARATERIZATION OF SOILS AT TEST SITES A.1 LAMBTON FAILITY 2015 ANNUAL LANDFILL REPORT BIOMONITORING PROGRAM pendix B haracterization of Soils at Test Sites pendix B HARATERIZATION OF SOILS
College of Science and Health ENVIRONMENTAL SCIENCE & GEOGRAPHY Course Outline
 College of Science and Health ENVIRONMENTAL SCIENCE & GEOGRAPHY Course Outline 1. TITLE OF COURSE AND COURSE NUMBER: General Geology ENV 115, 4 credits 2. DESCRIPTION OF THE COURSE: Includes the study
What is Soil Survey?
 What is Soil Survey? Soil Survey is a systematic examination, description, classification, and mapping of the soils in a given area. Brady and Weil. 1996 Who Produces Soil Survey Cooperative effort between
First Midterm Exam (MATH1070 Spring 2012)
") First Midterm Exam (MATH1070 Spring 2012) Instructions: This is a one hour exam. You can use a notecard. Calculators are allowed, but other electronics are prohibited. 1. [40pts] Multiple Choice Problems
First Midterm Exam (MATH1070 Spring 2012) Instructions: This is a one hour exam. You can use a notecard. Calculators are allowed, but other electronics are prohibited. 1. [40pts] Multiple Choice Problems
Chapter 3. The Normal Distribution
 Chapter 3. The Normal Distribution Topics covered in this chapter: Z-scores Normal Probabilities Normal Percentiles Z-scores Example 3.6: The standard normal table The Problem: What proportion of observations
Geology 200 Getting Started...
 Geology 200 Getting Started... Name This handout should be completed and become a part of your Notebook for this course. This handout is intended to be a review of some important ideas from your introductory
Italy - Porto Tolle: storage in offshore saline aquifer
 Italy - Porto Tolle: storage in offshore saline aquifer Monia Politi Enel - Engineering & Innovation Division - Research CO2GeoNet Open Forum 9-11 May 2011, San Servolo Island, Venice High level overview
Ingeniería y Georiesgos Ingeniería Geotécnica Car 19 a Nº 84-14 of 204 ; TEL : 6916043 E-mail: [email protected]
 The plot below presents the cross correlation coeficient between the raw qc and fs values (as measured on the field). X axes presents the lag distance (one lag is the distance between two sucessive CPT
RESERVOIR GEOSCIENCE AND ENGINEERING
 RESERVOIR GEOSCIENCE AND ENGINEERING APPLIED GRADUATE STUDIES at IFP School from September to December RGE01 Fundamentals of Geoscience I Introduction to Petroleum Geosciences, Sedimentology RGE02 Fundamentals
GRADISTAT: A GRAIN SIZE DISTRIBUTION AND STATISTICS PACKAGE FOR THE ANALYSIS OF UNCONSOLIDATED SEDIMENTS
 Earth Surface Processes and Landforms Earth Surf. Process. Landforms 26, 1237 1248 (2001) DOI: 10.2/esp.261 TECHNICAL COMMUNICATION GRADISTAT: A GRAIN SIZE DISTRIBUTION AND STATISTICS PACKAGE FOR THE ANALYSIS
Eurocode 7 - Geotechnical design - Part 2 Ground investigation and testing
 Brussels, 18-20 February 2008 Dissemination of information workshop 1 Eurocode 7 - Geotechnical design - Part 2 Ground investigation and testing Dr.-Ing. Bernd Schuppener, Federal Waterways Engineering
Offshore monitoring for geological storage
 Offshore monitoring for geological storage Dr Douglas Connelly National Oceanography Centre University of Southampton Waterfront Campus Southampton [email protected] IEAGHG Taking stock of progress and
4 Other useful features on the course web page. 5 Accessing SAS
 1 Using SAS outside of ITCs Statistical Methods and Computing, 22S:30/105 Instructor: Cowles Lab 1 Jan 31, 2014 You can access SAS from off campus by using the ITC Virtual Desktop Go to https://virtualdesktopuiowaedu
Deep Geothermal energy and groundwater in
 Deep Geothermal energy and groundwater in the UK Jon Busby Deep Geothermal energy and groundwater in the UK Outline 1. UK geothermal 2. Deep saline aquifers 3. Engineered geothermal systems 4. Fractured
RADON - 1 73- Although radon is agas, its decay products are not, and they occur either as unattached
 RADON 1. ehemical and Physical Data 1.1 Introduction Radon is a noble gas that occurs in several isotopic forms. Only two of these are found in significant concentrations in the human environment: radon-222,
Exploratory Data Analysis
 Exploratory Data Analysis Johannes Schauer [email protected] Institute of Statistics Graz University of Technology Steyrergasse 17/IV, 8010 Graz www.statistics.tugraz.at February 12, 2008 Introduction
Engineering Problem Solving and Excel. EGN 1006 Introduction to Engineering
 Engineering Problem Solving and Excel EGN 1006 Introduction to Engineering Mathematical Solution Procedures Commonly Used in Engineering Analysis Data Analysis Techniques (Statistics) Curve Fitting techniques
GEOCHEMISTRY IN GEOTHERMAL EXPLORATION
 GEOCHEMISTRY IN GEOTHERMAL EXPLORATION Argeo-C2 Conference 24 th -28 th November 2008 Entebbe, Uganda James Wambugu KenGen Role of Geochemistry in Geothermal Exploration Mapping, sampling & chemical analysis
MCLAREN VALE PWA GROUNDWATER LEVEL AND SALINITY STATUS REPORT 2009 10
 MCLAREN VALE PWA GROUNDWATER LEVEL AND SALINITY STATUS REPORT 2009 10 SUMMARY 2009 10 The McLaren Vale PWA is located approximately 35 km south of Adelaide. It is a regional-scale resource for which groundwater
A Correlation of. to the. South Carolina Data Analysis and Probability Standards
 A Correlation of to the South Carolina Data Analysis and Probability Standards INTRODUCTION This document demonstrates how Stats in Your World 2012 meets the indicators of the South Carolina Academic Standards
Ride the Rock Cycle. Suggested Goals: Students will gain an understanding of how a rock can move through the different stages of the rock cycle.
 Illinois State Museum Geology Online http://geologyonline.museum.state.il.us Ride the Rock Cycle Grade Level: 5 6 Purpose: To teach students that the rock cycle, like the water cycle, has various stages
Geothermal resources. Grado-1 borehole Future plans. Dep. of Civil and Environmental Engineering University of Trieste
 VII FIST - GEOITALIA Rimini 9-11 Settembre 2009 Geothermal potential of the carbonatic platform buried beneath the Veneto and Friuli coastal areas: results from the Grado-1 Borehole Geothermal resources
Anthropogenic Geomorphology
 Anthropogenic Geomorphology József Szabó Lóránt Dávid Dénes Lóczy Editors Anthropogenic Geomorphology A Guide to Man-Made Landforms 123 Editors József Szabó Department of Physical Geography and Geoinformatics
DesCartes (Combined) Subject: Mathematics Goal: Statistics and Probability
 Subject: Mathematics Goal: Statistics and Probability") DesCartes (Combined) Subject: Mathematics Goal: Statistics and Probability RIT Score Range: Below 171 Below 171 Data Analysis and Statistics Solves simple problems based on data from tables* Compares
DesCartes (Combined) Subject: Mathematics Goal: Statistics and Probability RIT Score Range: Below 171 Below 171 Data Analysis and Statistics Solves simple problems based on data from tables* Compares
SEDIMENTARY GEOLOGY STABLE ISOTOPES. SEPM Short Course No. 10. Dallas 1983. MICHAEL A. ARTHUR, Organizer THOMAS F. ANDERSON JAN VEIZER LYNTON S.
 STABLE ISOTOPES IN SEDIMENTARY GEOLOGY SEPM Short Course No. 10 Dallas 1983 by MICHAEL A. ARTHUR, Organizer THOMAS F. ANDERSON ISAAC R. KAPLAN JAN VEIZER and LYNTON S. LAND Printed in U.S.A. Additional
Neutrons as a multifunctional tool for geophysicists
 Neutrons as a multifunctional tool for geophysicists Urszula Woźnicka Tomasz Zorski H. Niewodniczanski Institute AGH University of Science of Nuclear Physics, PAN and Technology Kraków, Poland Kraków,
Santuario Block, Mature Fields South Region. Executive Summary. Block. Santuario
 Santuario Block, Mature Fields South Region Executive Summary Block Santuario South Region 1 Santuario Block, Mature Fields South Region Table of Contents Page 1. General Description of the Block 3 1.1
Geothermal. . To reduce the CO 2 emissions a lot of effort is put in the development of large scale application of sustainable energy.
 Geothermal Energy With increasing fossil fuel prices, geothermal energy is an attractive alternative energy source for district heating and industrial heating. In recent years the use of geothermal energy
Topic: Rocks, Minerals and Soil Duration: Grade Level: 6 9 days
 6 th Grade Science Unit: Sedimentary Rocks Unit Snapshot Topic: Rocks, Minerals and Soil Duration: Grade Level: 6 9 days Summary The following activities allow students to focus on the study of rocks.
MTH 140 Statistics Videos
 MTH 140 Statistics Videos Chapter 1 Picturing Distributions with Graphs Individuals and Variables Categorical Variables: Pie Charts and Bar Graphs Categorical Variables: Pie Charts and Bar Graphs Quantitative
Copyright Advanced Viticulture, Inc. www.advancedvit.com
 Pressure bomb Real-time Soil Moisture + PB + Porometer P. Bomb + ET Soil Moisture +PB + Porometer P. Bomb + Porometer Determine Site Characteristics Rooting Depth Soil Type Install Soil Moisture Sensors
Groundwater Training Course SOPAC, April 2005. Electromagnetic (EM) Induction method for Groundwater Investigations
 Induction method for Groundwater Investigations") Groundwater Training Course SOPAC, April 2005 Electromagnetic (EM) Induction method for Groundwater Investigations Electromagnetic (EM) Induction Method Basic principle: An AC electric current is applied
Groundwater Training Course SOPAC, April 2005 Electromagnetic (EM) Induction method for Groundwater Investigations Electromagnetic (EM) Induction Method Basic principle: An AC electric current is applied
STAT355 - Probability & Statistics
 STAT355 - Probability & Statistics Instructor: Kofi Placid Adragni Fall 2011 Chap 1 - Overview and Descriptive Statistics 1.1 Populations, Samples, and Processes 1.2 Pictorial and Tabular Methods in Descriptive
We appreciate your feedback
 Publishing date: 23/07/2015 Document title: We appreciate your feedback Please click on the icon to take a 5 online survey and provide your feedback about this document REPORT ON UNIT INVESTMENT COST INDICATORS
International Intercomparison Exercise on Natural Radiation Measurements under Field Conditions
 International Intercomparison Exercise on Natural Radiation Measurements under Field Conditions Saelices el Chico (Spain), May 2011 José Luis Gutiérrez-Villanueva, Carlos Sainz Fernández, Ismael Fuente
Prentice Hall Interactive Science Series 2011 Correlated to: Arizona Science Standards, Strands 1-6 (Grade 7)
") Strand 1: Inquiry Process Inquiry Process establishes the basis for students learning in science. Students use scientific processes: questioning, planning and conducting investigations, using appropriate
Strand 1: Inquiry Process Inquiry Process establishes the basis for students learning in science. Students use scientific processes: questioning, planning and conducting investigations, using appropriate
ph is an expression of the concentration of hydrogen ions in solution
 What is Acidity? An acid is a substance that gives off hydrogen ions ( H + ). A base is a substance that gives off hydroxyl ions. ( OH - ). ph is an expression of the concentration of hydrogen ions in
Interpret Box-and-Whisker Plots. Make a box-and-whisker plot
 13.8 Interpret Box-and-Whisker Plots Before You made stem-and-leaf plots and histograms. Now You will make and interpret box-and-whisker plots. Why? So you can compare sets of scientific data, as in Ex.