|
|
|
- Kristina Sharp
- 8 years ago
- Views:
Transcription
1
2

3
4

5

6
7

8
9
10

11
12

13

14

15

16

17
18

19
20

21
22
23
24
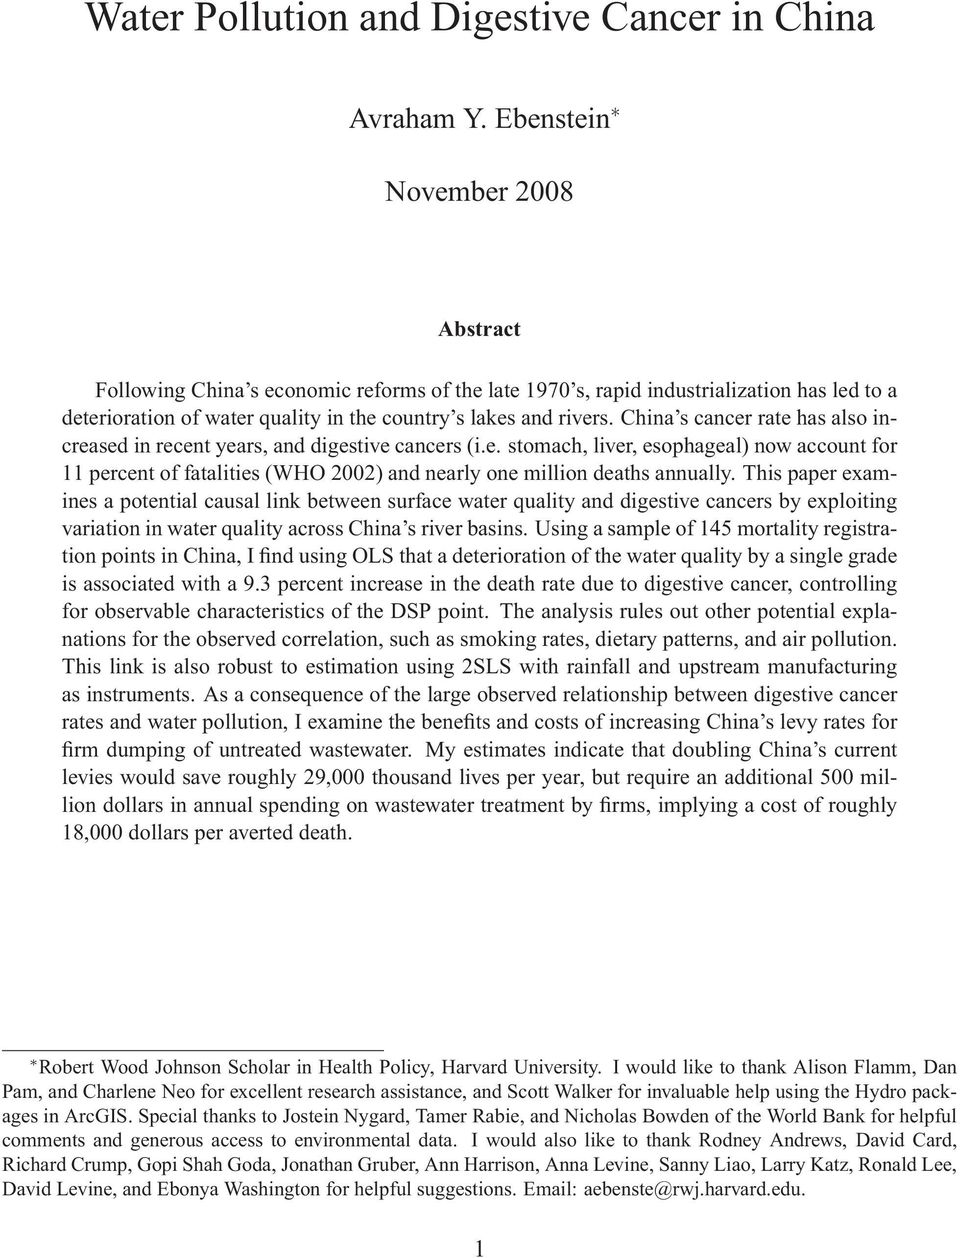
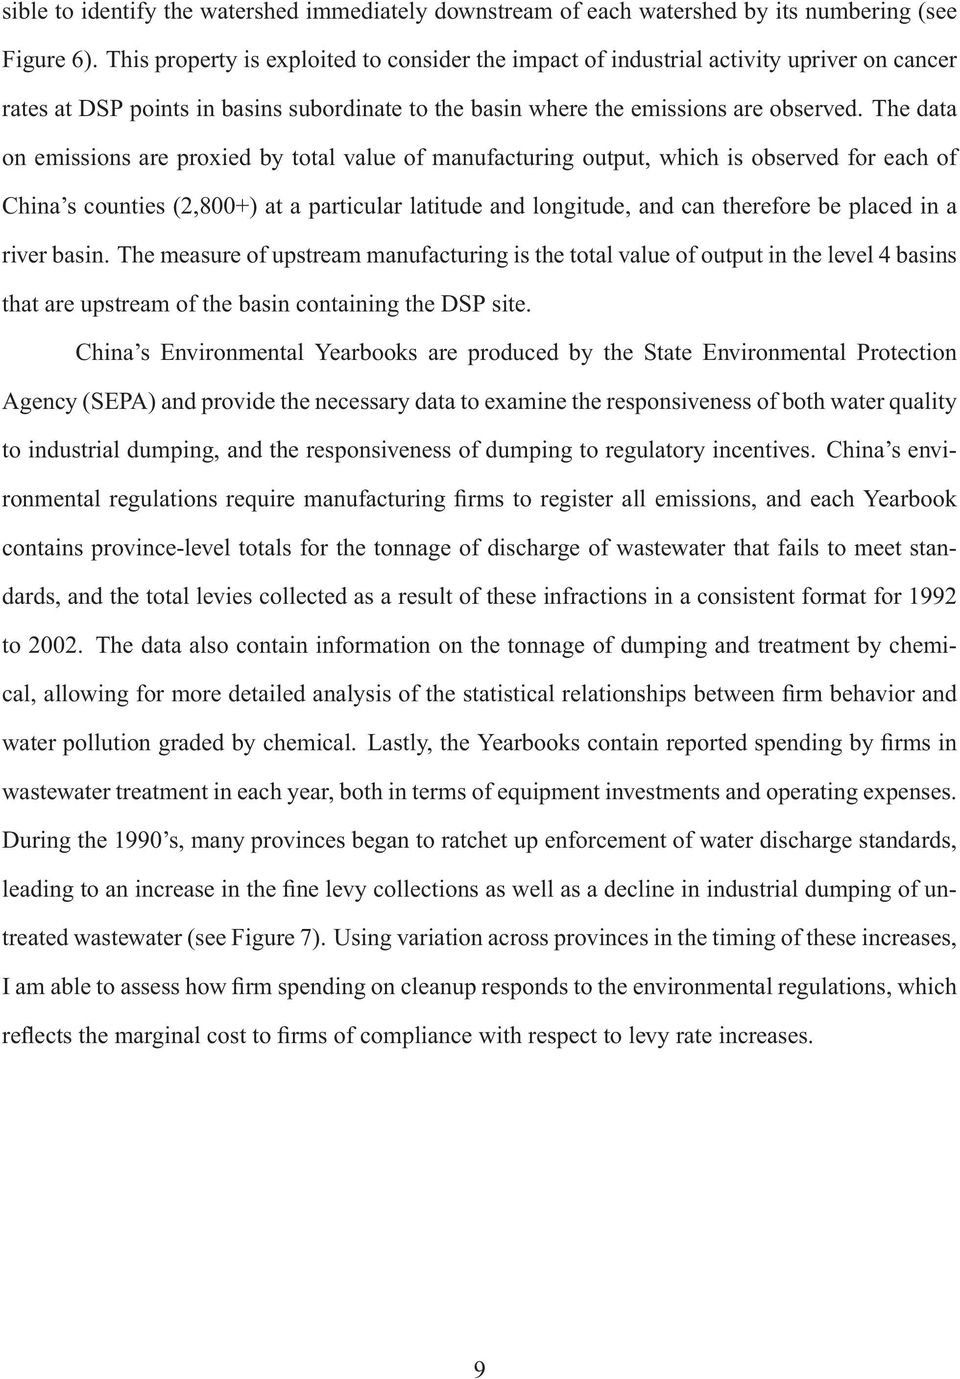
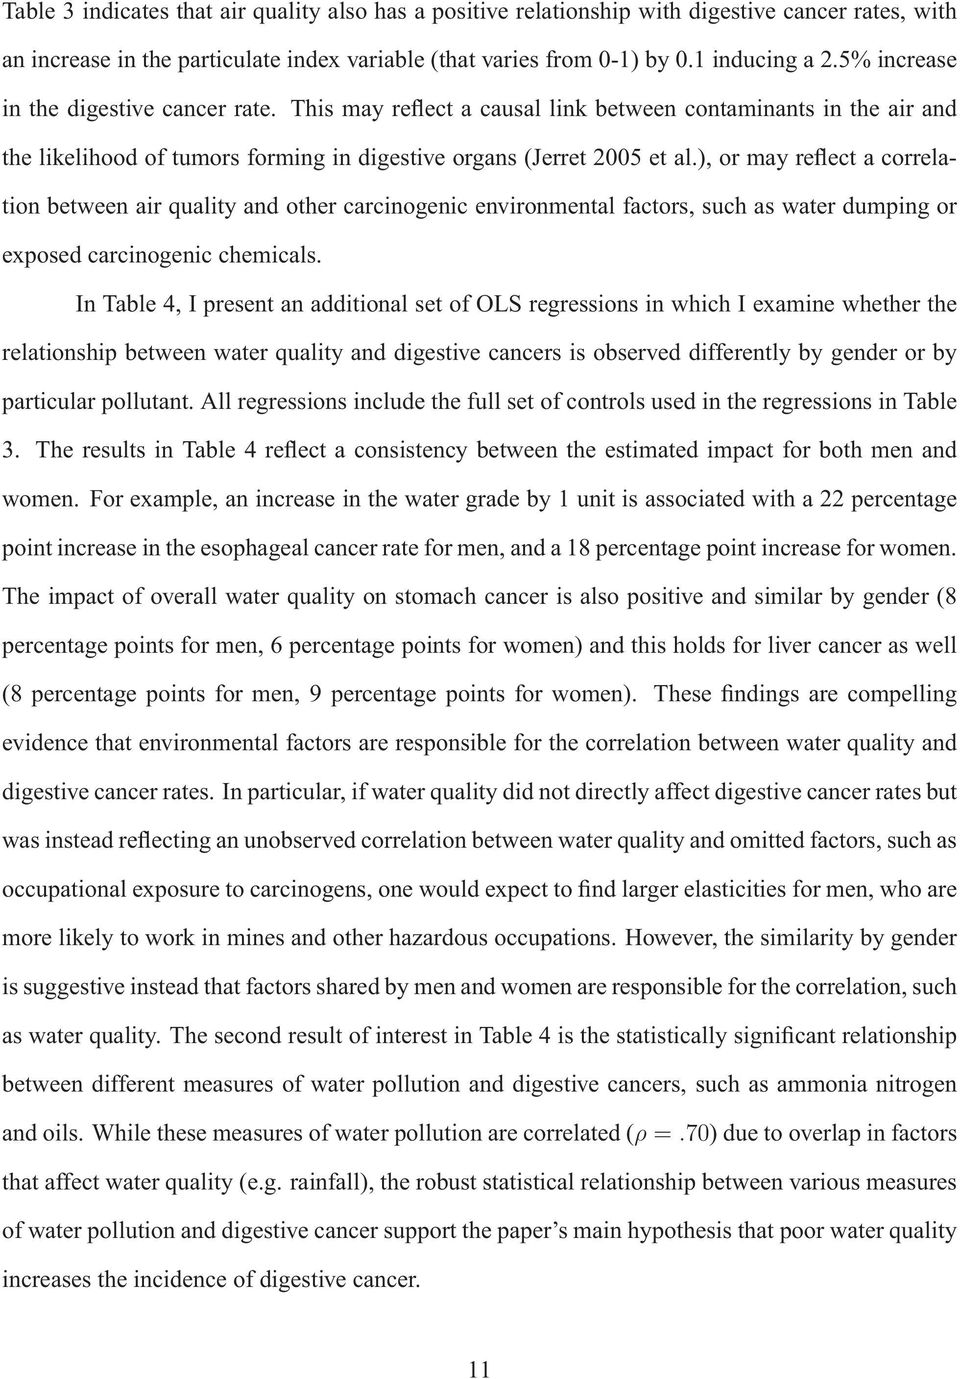
25 7 Figures and Tables` Death Rate Figure 1: Trends in Cancer Rates in China Year Cancer Rate, Rural Cancer Rate, Urban Source: China DSP. Graphs displayed are created using STATA lowess smoother. Death rates are per 100,000 persons. Figure 2: Water Quality and Digestive Cancer Rates in Select Locations, Water Qualtiy N/A 1 (Best) (Worst) Digestive Cancer Rate N/A < Source: China Center for Disease Control. Disease Surveillance Points (DSP) comprise a nationally representative sample of mortality for China. Rates reported per 100,000 and are age and sex adjusted using the 2000 census population structure. 1
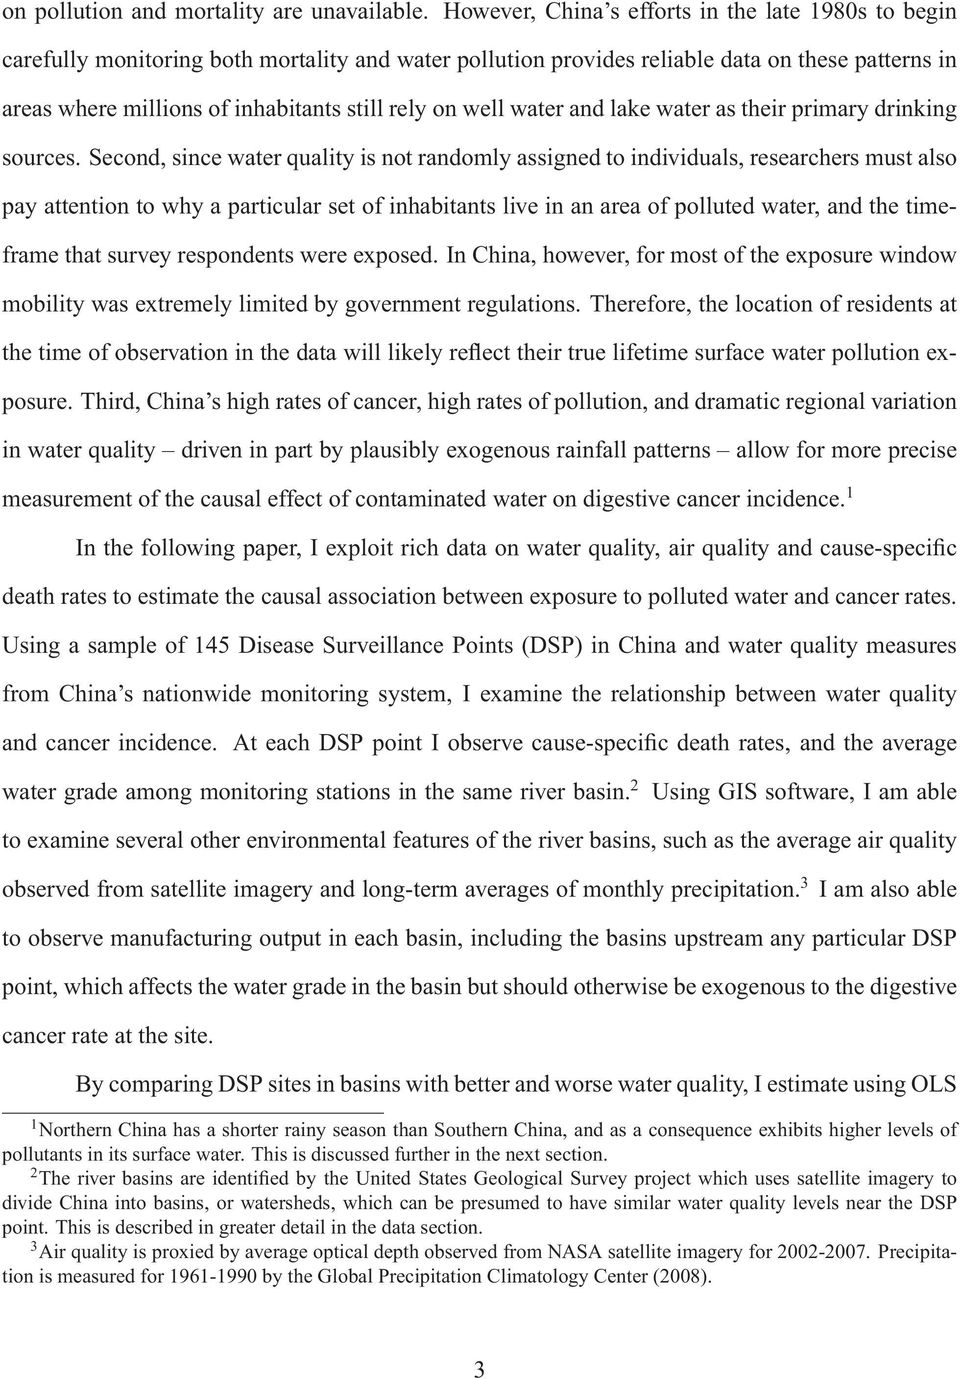
26 Figure 3: Air quality patterns in China Source: NASA satellite imagery. Figure 4: Monthly Precipitation Patterns in China, Source: Global Precipitation Climatology Center. 2
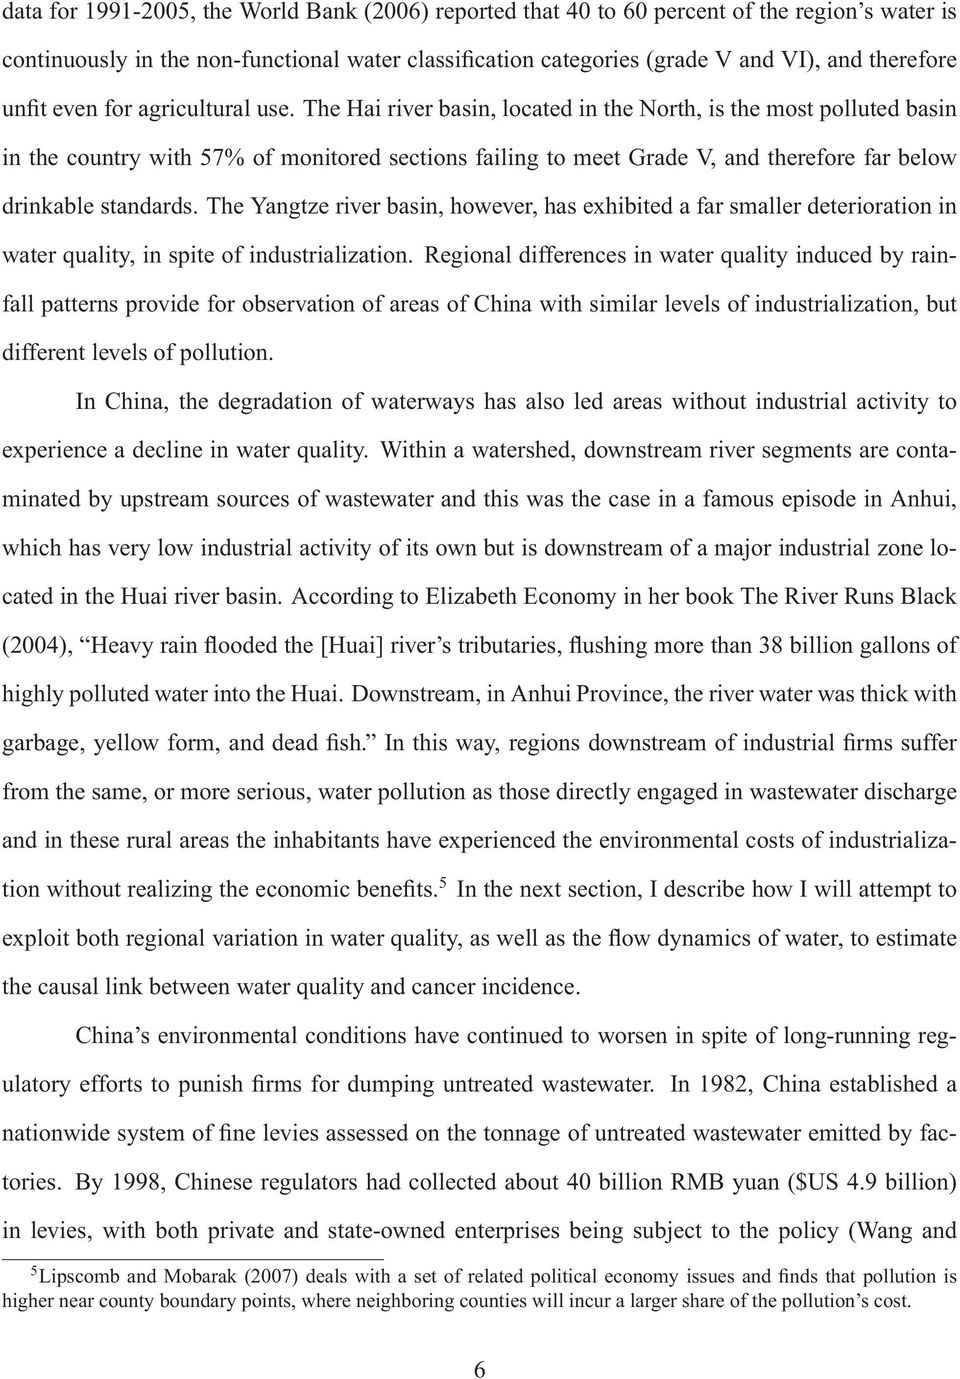
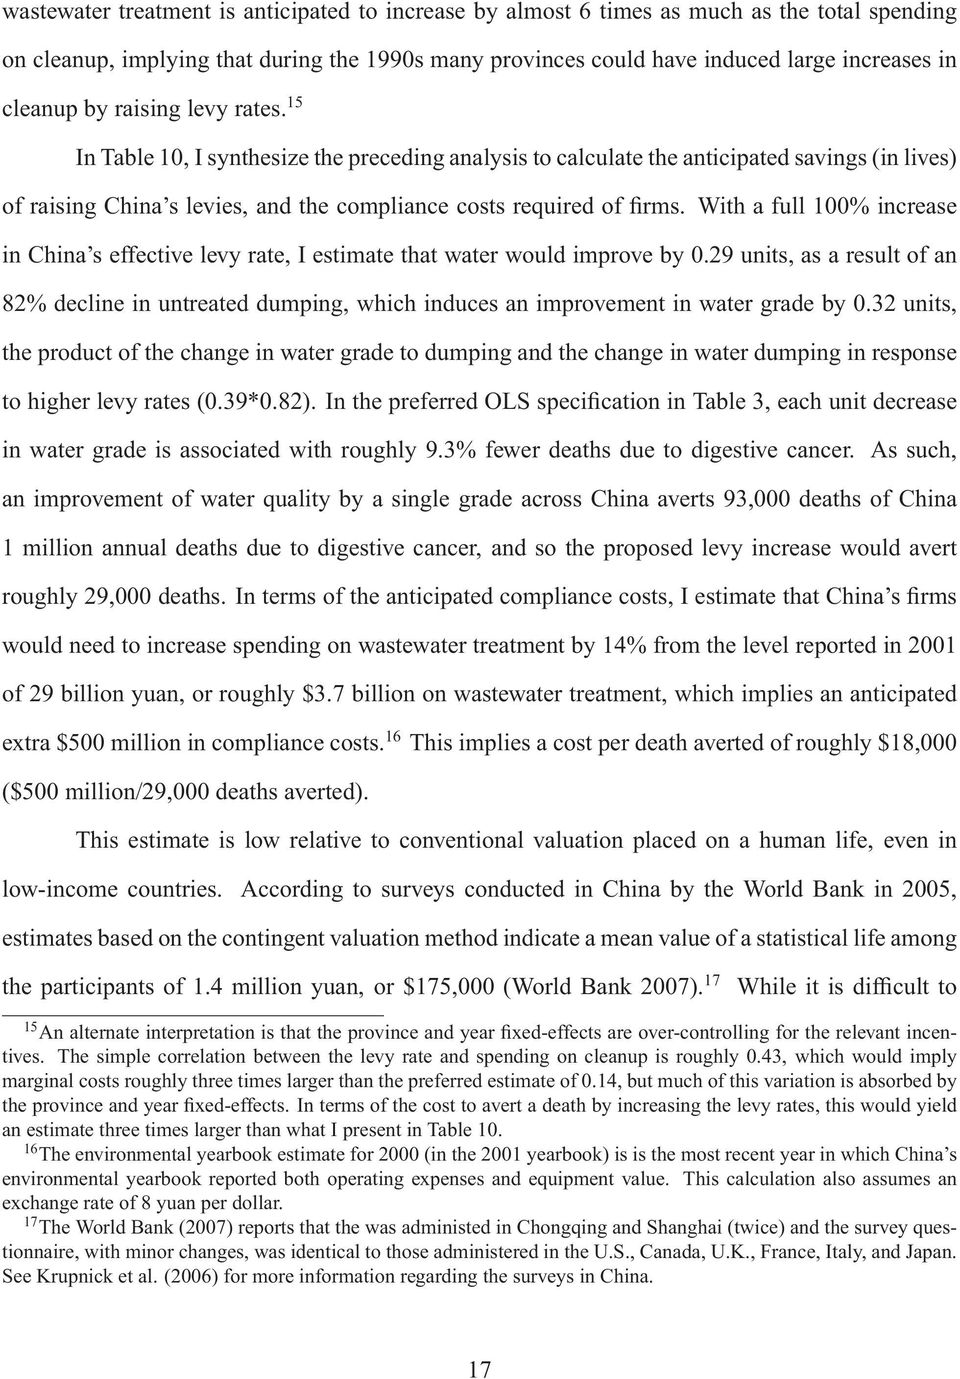
27 Figure 5: Main river basins in China Source: Hydro 1k Project. The above figure reflects the principal 2-digit basins (or watersheds) that comprise the hydrological surface of China. The dark lines reflect the breakdown of the 2- digit basins, and the lighter outline is the breakdown of China into 989 lower-level basins. Figure 6: Example of a River Basin Source: China Hydro 1k. 3
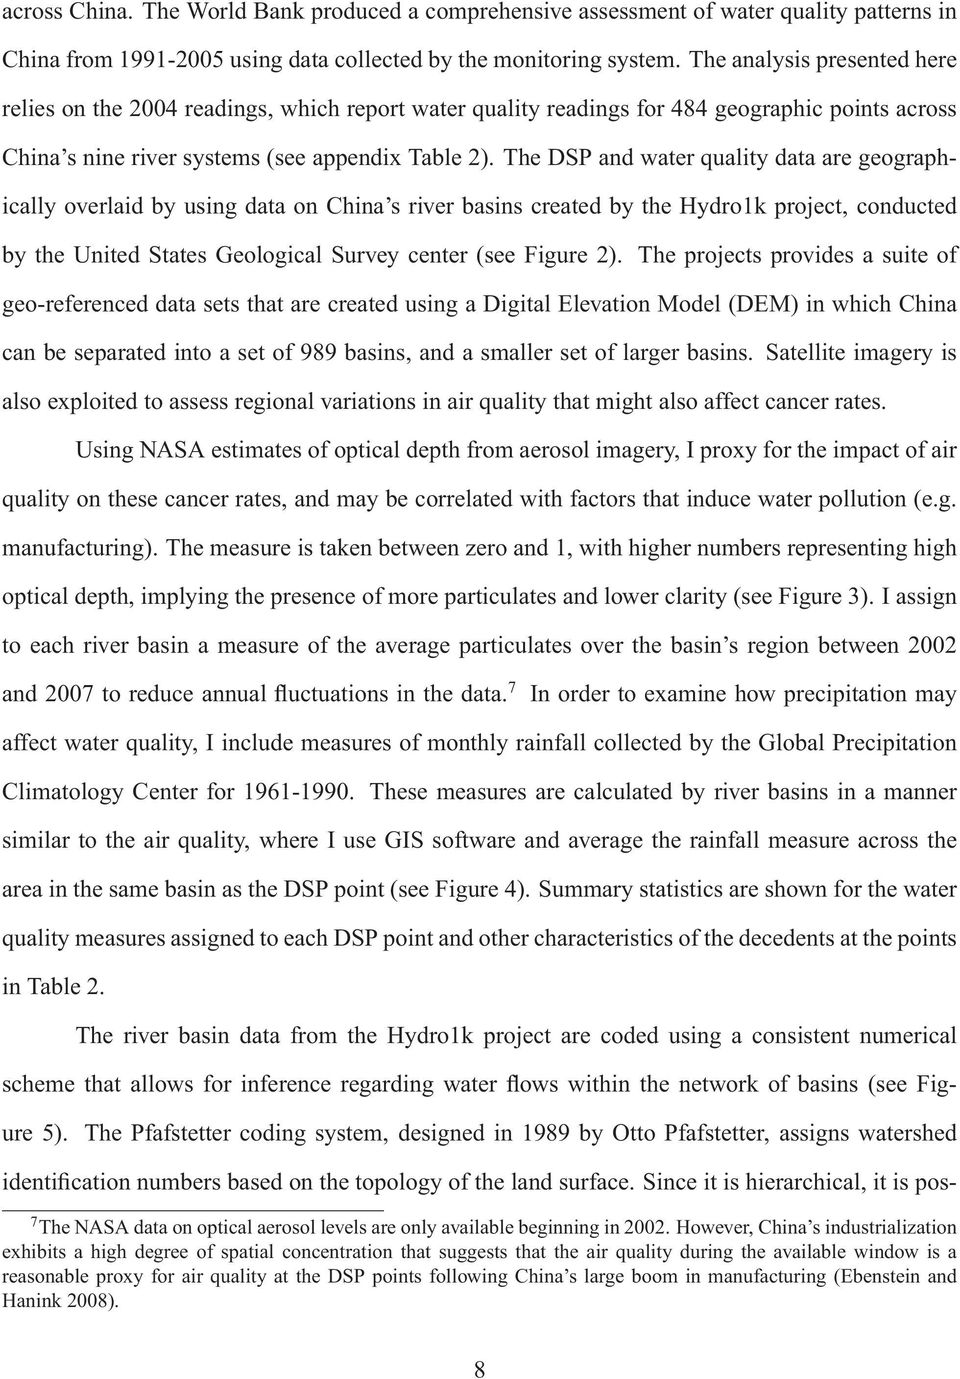
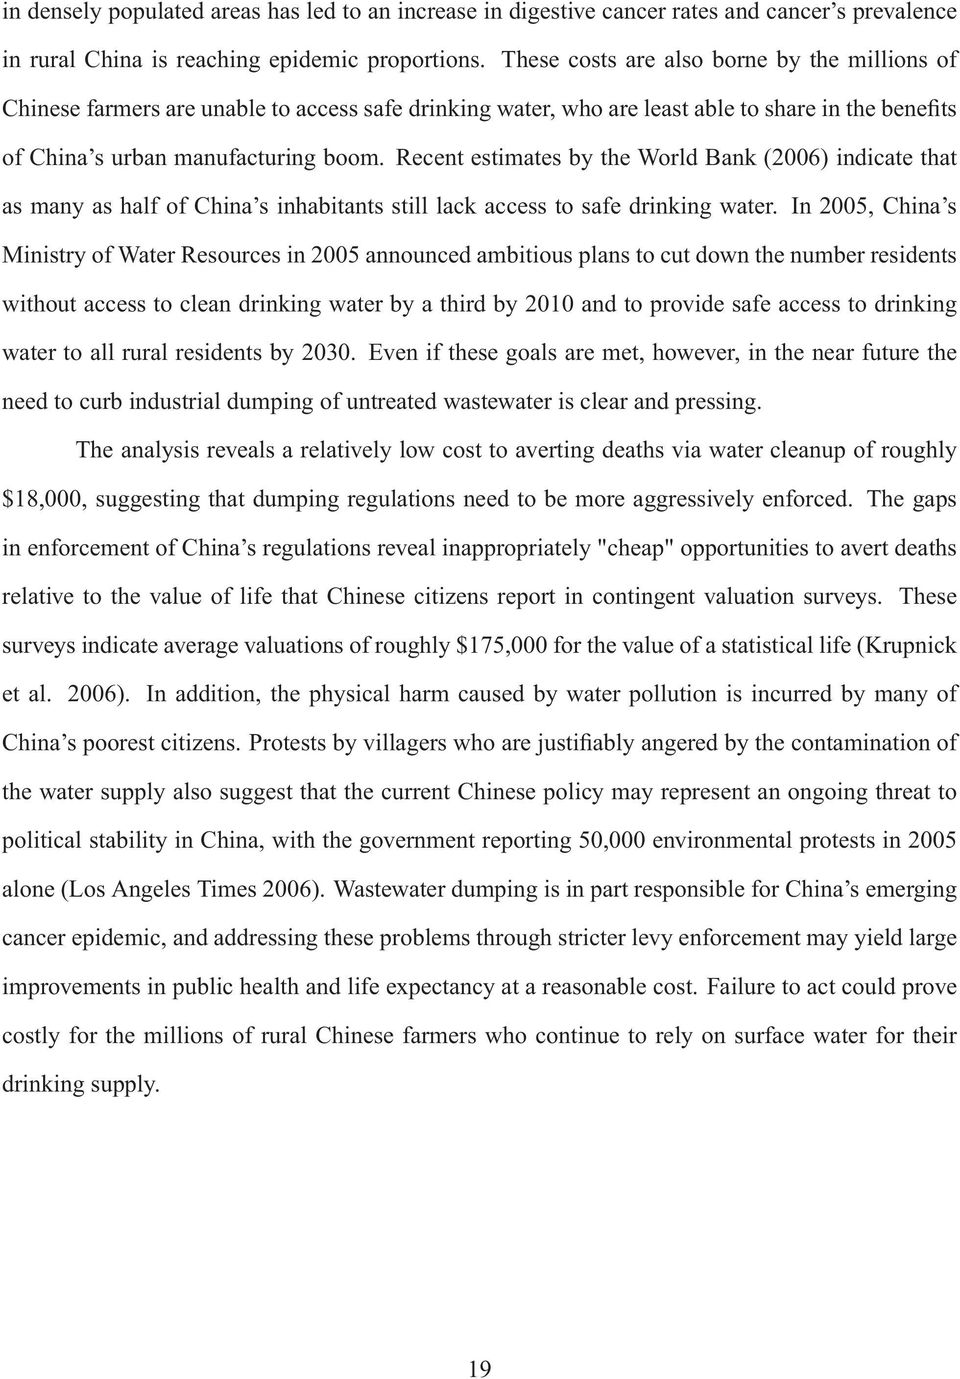
28 Figure 7: Pollution Intensity and the Effective Price Charged for Dumping Pollution Intensity (logs) Effective Price Charged for Dumping (logs) Year Pollution Intensity Effective Price per Ton Soure: China Environmental Yearbook ( ). Note: Pollution intensity is the ratio of dumping in tons to 10,000 yuan of industrial output. The effective price is the value of collected yuan per hundred tons not meeting wastewater discharge standards Figure 8: Age Distribution of Digestive Cancer and Stroke Incidence Share of Deaths Age Digestive Cancer Stroke Source: China DSP. 4
29 Table 1 Age-adjusted Death Rates (per 100,000) by Cause in China, Panel 1: Death Rates by General Cause Males Rural Urban Rural Urban (1) (2) (3) (4) All Causes Cancer Digestive Cancers Lung Cancers Other Cancer Heart Stroke Respiratory Illnesses Accidents / Violence Other Panel 2: Death Rates for Types of Digestive Cancer Females Esophageal Cancer Stomach Cancer Liver Cancer Other Digestive Cancers Source : Chinese Disease Surveillance Points Mortality Registration System (DSP). Note : N=145. Age adjustment is performed by calculating age-specific death rates and creating weighted averages using the population structure in China's 2000 census. Other digestive cancers includes colon cancer, intestinal cancer, and pancreatic cancer. The reported death rates are the average rates for the 145 sites, weighted by the population at each site. These calculations exclude roughly three thousand deaths (of the 500,000 deaths) in the sample where I am missing information on the age or sex of the decedent.
30 Table 2 Sample Means for Disease Surveillance Points by Region Statistic North South Overall (1) (2) (3) Digestive Cancer Rate Overall Water Grade Ammonia Nitrogen Biological Oxygen Demand Oils Permanganate Volatile Phenol Average Years of Education Share in Farming Urban site (1=yes) Air Pollution Reading Monthly Rainfall (mm) Upstream Manufacturing (millions) # of Sites Source : Chinese Disease Surveillance Points Mortality Registration System (DSP), China National Monitoring Center (2004), Global Precipitation Climatology Center (2008) Note : Higher grades reflect lower water quality (1=best, 6=worst) and a greater concentration of the listed pollutants. The water grade measure at each DSP site reflects the average water grade among monitoring sites in the same river basin. The air pollution reading is taken from satellite imagery and takes on values from 0-1, with higher values reflecting more particulates in the air, and is reported as the average reading in the river basin containing the DSP site. The rainfall measure is the average monthly rainfall in millileters in the river basin containing the DSP site from Upstream manufacturing is based on the total value of output in yuan of firms with greater than 500,000 yuan in sales. The sample means are the average values (e.g. average education) among decedents at each site restricted to deaths among persons age 20 and older. Sample means are reported weighted by the population at each site.
31 Table 3 Ordinary Least Squares (OLS) Regressions of Log of Digestive Cancer Rates on Water Grade Statistic No Controls Digestive (all) Esophageal Stomach Liver With Controls Digestive (all) Esophageal Stomach Liver (1) (2) (3) (4) (5) (6) (7) (8) Water Grade (1=best, 0.135** 0.349*** 0.141** 0.090* 0.093** 0.222** ** 6=worst) (0.053) (0.102) (0.065) (0.047) (0.044) (0.089) (0.058) (0.033) Average Education (0.041) (0.101) (0.063) (0.027) Share in Farming *** (0.255) (0.889) (0.391) (0.158) Urban (1=yes) * *** (0.176) (0.656) (0.256) (0.126) Air Pollution * * (0.147) (0.302) (0.176) (0.151) Region Controls No No No No Yes Yes Yes Yes R Squared * significant at 10% ** significant at 5%. *** significant at 1%. Source : China Disease Surveillance Points Mortality Registration (DSP), China National Monitoring Center (2004) Note : N=145. The first four columns represent OLS regressions of the logarithm of the death rate of a cause on the average water grade of the river basin in which the DSP site is located. I add covariates for columns (5)-(8), which are the average values (e.g. education) among decedents at each site restricted to deaths among persons age 20 and older. Standard errors are robust and clustered at the province level. The water grade measure at each DSP ite reflects the average water quality among monitoring sites in the same river basin. Regressions are weighted by the population at each DSP site.
32 Table 4 OLS Regressions of Log of Digestive Cancer Rates on Water Grade by Chemical Men Women Esophageal Stomach Liver Esophageal Stomach Liver Chemical (1) (2) (3) (4) (5) (6) Overall Grade Ammonia Nitrogen Biological Oxygen Demand Oils Permanganate Volatile Phenol 0.219** ** ** (0.10) (0.06) (0.03) (0.11) (0.06) (0.04) 0.214** ** 0.203** ** (0.10) (0.05) (0.03) (0.10) (0.05) (0.03) 0.229*** 0.090* 0.064* 0.170* 0.088* 0.080** (0.07) (0.05) (0.03) (0.10) (0.05) (0.03) 0.214** (0.09) (0.07) (0.04) (0.11) (0.07) (0.04) 0.228*** ** 0.183* *** (0.08) (0.06) (0.04) (0.11) (0.05) (0.04) 0.201** 0.137** * (0.09) (0.06) (0.05) (0.13) (0.07) (0.05) Source : China Disease Surveillance Points Mortality Registration (DSP), China National Monitoring Center (2004) Note : N=145. Each reported coefficient represents a separate regression. The regressions are estimated using the column variable as the dependent variable and the water grade measure in the row as the independent variable. Overall grade and chemical pollution are graded on a 6- point scale, with 1 being the highest quality and 6 being the most polluted. The dependent variable is the logarithm of the age and sex adjusted death rate by cause. The independent variable is a measure of water pollution, which is the amount of the chemical found in readings among water surveillance points in the river basin. All specifications include the control variables shown in Table 2. Standard errors are robust and clustered at the province level. Regressions are weighted by the population at each DSP site.
33 Table 5 Smoking and Dietary Habits by Water Grade in China Smoking Rates Dietary Patterns Water Grade Males Females Caloric Intake Carbohydrates % Fat % Protein Other (1) (2) (3) (4) (5) (6) (7) Level 1 (Best) , Level , Level , Level , Level , Level 6 (Worst) , Source : Smoking rates are taken from the China Household Income Survey (CHIS, 1995). The diet information is taken from the China Health and Nutrition Survey (CHNS, ). Note: The smoking rates are shown for the DSP sites which were in the 19 provinces included in the CHIS (1995), which includes 102 of the 145 DSP sites. Information on diet is shown for DSP sites located in the 9 provinces included in the CHNS, which includes 56 of the 145 sites.
34 Table 6 Two-stage Least Squares (2SLS) Regressions of Log of Digestive Cancer Rates on Water Grade using Annual Rainfall and Upstream Output as Instruments Statistic Monthly Rainfall First-Stage Water Grade Digestive (all) Esophageal Stomach Liver (1) (2) (3) (4) (5) ** (0.005) Upstream Output 0.001** Water Grade (1=best, 6=worst) Average Education Share in Farming Urban (1=yes) Air Pollution F Test of Instruments (0.0005) 0.303** 1.025*** 0.470** (0.131) (0.291) (0.175) (0.122) (0.111) (0.044) (0.097) (0.074) (0.027) *** (1.04) (0.31) (0.85) (0.59) (0.17) *** (0.852) (0.198) (0.548) (0.391) (0.156) 0.593* ** (0.332) (0.165) (0.341) (0.208) (0.172) 11.73*** * significant at 10% ** significant at 5%. *** significant at 1%. Two-stage Least Squares Source : China Disease Suveillance Points Mortality Registration (DSP), China National Monitoring Center (2004), Global Precipitation Climatology Center (2008) Note : N=145. The first column is the first-stage relationship between water grade at the DSP site, the covariates (e.g. urban), and two instrumental variables: the average monthly rainfall in millileters in the basin and output upstream of the basin containing the DSP site. The F statistic for the joint significance of the two instruments is reported (11.73), and the instruments also pass a Sargan-Hansen over-identification test, failing to reject the null hypothesis of their validity. The regressions in columns (2) through (5) represent 2SLS regressions where the dependent variable is the logarithm of the death rate of a cause on the predicted average water grade from colum (1) and the other covariates. Standard errors are robust and clustered at the province level. Regressions are weighted by the population at each DSP site.
35 Table 7 Impact of Water Pollution on Log of Death Rates by Cause in China, All Causes Cancer Heart Stroke Respiratory Violent/ Accidents Other Overall Grade (1=best, 6=worst) Ammonia Nitrogen Biological Oxygen Demand Oils (1) (2) (3) (4) (5) (6) (7) ** (0.02) (0.04) (0.04) (0.05) (0.06) (0.03) (0.02) ** (0.02) (0.03) (0.04) (0.05) (0.05) (0.02) (0.02) ** (0.02) (0.03) (0.04) (0.04) (0.06) (0.02) (0.02) (0.03) (0.04) (0.05) (0.05) (0.05) (0.02) (0.03) Permanganate ** (0.02) (0.03) (0.05) (0.05) (0.07) (0.02) (0.02) Volitile Phenol * (0.04) (0.04) (0.06) (0.05) (0.06) (0.03) (0.02) * significant at 10% ** significant at 5%. *** significant at 1%. Source : Chinese Disease Surveillance Points Mortality Registration System, China National Monitoring Center (2004) Note : N=145. Each reported coefficient represents a separate regression. The regressions are estimated using the column variable as the dependent variable and the water quality measure in the row as the independent variable. Each water reading is graded on a 6-point scale, with 1 being the highest quality and 6 being the most polluted. The dependent variable is the arithemetic average of the death rate by cause for each DSP site (see Table 2). The independent variable is a measure of water pollution, which is calculated as the average chemical reading among the water surveillance points in 2004 for the watershed containing the DSP site. All specifications include the controls listed in Table 3 and are weighted by the population at each DSP site.
36 Table 8 OLS Regressions of Water Grade on Industrial Chemical Dumping and Rainfall Overall Quality Ammonia Nitrogen Biological Oxygen Demand Oils Permanganate Volitile Phenol Chemical (1) (2) (3) (4) (5) (6) Log of Chemical 0.387*** 0.154** 0.262** 0.237*** 0.347*** Dumping (Tons) (0.10) (0.07) (0.12) (0.07) (0.10) (0.07) Monthly Rainfall (mm) *** *** *** *** *** *** (0.005) (0.005) (0.006) (0.004) (0.005) (0.004) Chemical Dumping Measure Total Dumping Ammonia Nitrogen Chemical Oxygen Demand Petroleum Suspended Solid Waste Volitized Phenol Number of Tons Per Site Average Grade 71,900 13, , , R Squared N * significant at 10% ** significant at 5%. *** significant at 1%. Source : China National Monitoring Center (2004), China Environmental Yearbook (2000, 2005) Note: The dependent variable in each regression is the average water grade for the listed chemical within the province. Water quality is graded on a 6-point scale, with 1 being the highest quality and 6 being the most polluted. The independent variables are the log of chemical dumping reported at the province level in China's Environmental Yearbook (2005), except Suspended Solid Waste, which is taken from Standard errors are robust.
37 Table 9 OLS Regressions of the Log of Firm Cleanup (tons) and Firm Spending on Cleanup (yuan) on the Log of the Water Pollution Levy Charge (yuan per ton) Total Industrial Cleanup (tons) Spending on Cleanup (100 million yuan) Chemical (2) (3) Log of Effective Fine Levy 0.815*** 0.137* (0.21) (0.08) Period Available R Squared N * significant at 10% ** significant at 5%. *** significant at 1%. Source : China Environmental Yearbooks ( ) Note : The effective fine levy is yuan collected per ton of wastewater discharge failing to meet regulatory standards. This is reported for all registered manufacturing firm by province and year. The sample sizes correspond to the 29 provinces in China for All regressions include province and year fixed effects and the standard errors are robust and clustered at the province level. Industrial dumping and cleanup measures are taken from the Environmental Yearbooks and gross output is taken from the Statistical Yearbooks. The dependent variable in the first column is the log of total tons of reported water tonnage of cleanup across all chemicals. The dependent variable in the second column is the log of total spending on cleanup (in 100 million yuan). Chongqing is included in the totals for Sichuan, and Tibet is excluded from this analysis since data on levies are unavailable. I censor the bottom and top 1 percent of the observed provincial levy rates (6 observations). The results are very similar whether I include or exclude these values. Regressions are weighted by the population of each province.
38 Table 10 Estimated Benefits and Costs of Raising Fine Levies Benefits and Costs of Doubling Fine Rates DigestiveCancer WaterGrade WaterGrade Dumping Dumping TaxRate Deaths Averted Per Year Extra Compliance Cost Per Year ($) Cost per Averted Death (1) (2) (3) (4) (5) (6) Overall Grade (1)*(2)*(3)*(980,000 + ) (Cost in 2000)*(0.137) (5)/(4) 0.093** 0.387*** 0.815*** 28,746 $ 504,888,032 $ 17,564 (0.044) (0.096) (0.21) * significant at 10% ** significant at 5%. *** significant at 1%. Source : China Disease Surveillance Points Mortality Registration (DSP), China National Monitoring Center (2004), China Environmental Yearbooks ( ) Note : In column 1, I report the relationship between the log of the digestive cancer rate on the overall water grade (See Table 3). In column 2, I report the relationship between the water grade and the log of total dumping (See Table 8). In column 3, I report the relationship between the log of total dumping and the effective fine levy on water dumping (See Table 9). + In column 4, I predict the number of lives saved by raising the fine levy rate, using the fact that the total annual deaths due to digestive cancers is roughly 980,000. In column 5, I predict the cost of compliance of raising the fine levy rate, using the fact that total reported compliance costs in 2001 was roughly $3.7 billion dollars (8 yuan=1 USD), and the estimated elasticity of spending on cleanup of.137 (see Table 9). In column 6, I present the cost to firms in addtional spending required to avert one additional death from digestive cancer.
39 Appendix Table 1 Sample Means (and standard deviatons) for China Disease Surveilance Points by Urbanization, Statistic Poor Rural Medium Rural Rich Rural Urban (1) (2) (3) (4) Share of Deaths Occuring in the Home (0.08) (0.18) (0.09) (0.16) Share of Deaths Occuring in the Hospital (0.05) (0.17) (0.09) (0.15) Share of Decedents Employed in Farming (0.09) (0.20) (0.23) (0.04) Average Education among Decedents (1.11) (1.33) (1.48) (1.27) Total Deaths Recorded 124, , , ,642 Total Person Years Covered 25,016,184 30,227,522 21,918,116 23,584,446 Crude Death Rate (Deaths/Persons) Number of Sites Source : China Disease Surveillance Points Mortality Registration (DSP) Note : The table above summarizes differences across the 145 sites covered by the DSP. The cites are chosen to form a nationally representative sample of deaths for China, with sites being chosen to match China's census in 1990 (see Yang et al. 2005). Employment and education for decedents restricted to deaths among persons age Total deaths recorded is for the entire sample frame from The total person years covered refers to the total number of individuals covered by each DSP site summed over the entire sample frame from
40 Appendix Table 2 Summary Statistics of Water Quality in China's Main River Systems River System Region Overall Ammonia Nitrogen Biological Oxygen Demand Oils Permanganate Volatile Phenol Liao River Hai River Huai River Yellow River Songhua River Fujian/Zhejiang Yangtze River Nu/Yarlung Zangbo Pearl River Northeast North North North Northeast South South Southwest South Inward flowing systems West Source : China National Monitoring Center (2004) Note : Higher numbers reflect lower water quality (1=best, 6=worst) and a greater concentration of the listed pollutants. These readings are taken from 484 water quality monitoring systems across China. The systems are displayed in descending order of overall water quality.
41 Appendix Table 3 Ordinary Least Squares (OLS) Regressions of Log of Digestive Cancer Rates on Water Grade by Category Statistic No Controls Digestive (all) Esophageal Stomach Liver With Controls Digestive (all) Esophageal Stomach Liver (1) (2) (3) (4) (5) (6) (7) (8) Medium Quality * * Water (1=yes) (0.190) (0.391) (0.236) (0.183) (0.130) (0.276) (0.207) (0.114) Lowest Quality 0.429** 0.953*** 0.554** 0.291* 0.323** 0.648** 0.348* 0.283** Water (1=yes) (0.170) (0.344) (0.226) (0.152) (0.146) (0.289) (0.200) (0.109) Average Education (0.042) (0.104) (0.062) (0.027) Share in Farming *** (0.271) (0.933) (0.390) (0.167) Urban Site * *** (1=yes) (0.197) (0.699) (0.261) (0.143) Air Pollution 0.282** 0.649** ** (0.137) (0.290) (0.165) (0.141) Region Controls No No No No Yes Yes Yes Yes R Squared * significant at 10% ** significant at 5%. *** significant at 1%. Source : China Disease Surveillance Points Mortality Registration (DSP), China National Monitoring Center (2004) Note : N=145. See Table 3 for a description of the control variables included in columns 4-6. Standard errors are robust and clustered at the province level. Regressions are weighted by the population at each DSP site. The water grade is measured on a 6 point scale: the base category is drinkable water (grade 1 or grade 2), the medium quality water category (grade 3) is water that is not drinkable but suitable for human contact (grade 3), and the lowest quality water category is water that is not suitable for human contact (grade 4+). The coefficient for medium quality and lowest quality are water reported relative to drinkable water.
42 Appendix Table 4 Comparison of Age-adjusted Death Rates (per 100,000) due to Cancer, China and the United States China United States (Overall) Asian Americans Men Women Men Women Men Women All Cancers Digestive Lung Other % Digestive 66% 58% 25% 22% 34% 34% % Lung 23% 17% 31% 26% 27% 20% % Other 11% 25% 44% 52% 39% 47% Source : China DSP , United States Cancer Statistics: 2004 Incidence and Mortality, Center for Disease Control (CDC) Note : Statistics for the United States reported relative to US standard population in 2000, which is not directly comparable to the rates reported for China, which are adjusted using the age distribution of the 2000 China census, and would be slightly altered if evaluated using the US standard population. The US population is older than the Chinese population: the census for both countries in 2000 reflects that the US median age (41) is 4 years older than the Chinese median age (37).
43 Appendix Table 5 Industrial Waste-water Dumping and Manufacturing Output by Industry, China ( ) Industry Dumping (10,000 tons) Percent of Dumping Output (million yuan) Percent of Output Pollution Intensity (1) (2) (3) (4) (2)/(4) Chemicals and chemical products 1,081, % 1,236, % 2.6 Ferrous metal smelting and pressing 967, % 318, % 9.2 Paper and paper products 707, % 814, % 2.6 Electricity, gas, and water production 610, % 471, % 3.9 Food, beverages and tobacco 512, % 1,512, % 1.0 Mining 377, % 523, % 2.2 Textiles 357, % 1,687, % 0.6 Mechanical and electronic equipment 296, % 4,645, % 0.2 Construction materials 215, % 757, % 0.9 Other 597, % 4,973, % 0.4 Total 5,724, % 16,942, % 1.0 Source : Chinese Environmental Yearbooks ( ), China Manufacturing Firm Database ( ) Note : Manufacturing output is based on the total value of output in yuan of firms with greater than 500,000 yuan in sales. Dumping by industry is reported for firms registered with China's State Environmental Protection Agency (SEPA).
44 Appendix Table 6 Digestive Cancer Rates and (standard errors) at DSP Sites by Region and Urbanization Region Rural Urban Difference (1) (2) (1)-(2) Northern China Southern China ** (6.24) (3.80) (7.82) (5.20) (4.11) (6.79) * significant at 10% ** significant at 5%. *** significant at 1%. Source : China DSP, China National Monitoring Center (2004) Note : Region is as defined in Table 2, with 66 sites classified as Northern and 79 sites classified as Southern. Statistics are reported weighted by the population at each DSP site.
45 Appendix Table 7 OLS Regressions of Digestive Cancer Rates on Water Grade by Period Total Male Female Total Male Female Statistic (1) (2) (3) (4) (5) (6) Water Grade (1=best, 6=worst) Average Education Share in Farming Urban (1=yes) Air Pollution Digestive Cancer Rates Digestive Cancer Rates ** 7.41** 4.83** (3.1) (4.3) (2.2) (2.8) (3.5) (2.1) (2.5) (3.6) (1.8) (2.8) (3.6) (2.1) * (15.5) (19.2) (15.1) (22.4) (28.9) (16.8) * (14.3) (18.1) (13.2) (16.2) (21.4) (11.9) ** 25.17** 7.63 (10.2) (14.5) (6.7) (8.0) (10.3) (5.9) N * significant at 10%. ** significant at 5%. *** significant at 1%. Source : China Disease Suveillance Points Mortality Registration (DSP), China National Monitoring Center (2004), Global Precipitation Climatology Center (2008), China Cancer Database (2004). Note : Columns 1-3 demonstrate the relationship between cancer rates and water quality in data from overall (1) and by gender (2-3). Columns 4-6 demonstrate the relationship between cancer rates and water quality in data from overall (4) and by gender (5-6).The number of observations varies by statistic, due to incomplete data for the period. Regressions are weighted by the population at each DSP site.
The Burden of Cancer in Asia
 P F I Z E R F A C T S The Burden of Cancer in Asia Medical Division PG283663 2008 Pfizer Inc. All rights reserved. Printed in USA/December 2008 In 2002, 4.2 million new cancer cases 39% of new cases worldwide
The American Cancer Society Cancer Prevention Study I: 12-Year Followup
 Chapter 3 The American Cancer Society Cancer Prevention Study I: 12-Year Followup of 1 Million Men and Women David M. Burns, Thomas G. Shanks, Won Choi, Michael J. Thun, Clark W. Heath, Jr., and Lawrence
9. Substance Abuse. pg 166-169: Self-reported alcohol consumption. pg 170-171: Childhood experience of living with someone who used drugs
 9. pg 166-169: Self-reported alcohol consumption pg 170-171: Childhood experience of living with someone who used drugs pg 172-173: Hospitalizations related to alcohol and substance abuse pg 174-179: Accidental
Cancer Cluster Investigation French Limited Superfund Site, Harris County, Texas
 Cancer Cluster Investigation French Limited Superfund Site, Harris County, Texas Time Period: 1995-2011 Prepared by the Texas Department of State Health Services Summary Some residents living in the vicinity
inflammation of the pancreas and damage to the an increased risk of hypertension, stroke and Table 7.1: Classification of alcohol consumption
 H E A LT H SURVEY Alcohol Consumption 7 Alcohol Consumption N AT I O N A L Introduction Excessive alcohol consumption is associated with inflammation of the pancreas and damage to the an increased risk
Death Data: CDC Wonder, Texas Health Data, and VitalWeb
 Death Data: CDC Wonder, Texas Health Data, and VitalWeb Evidence-Based Public Health Practice Step 2: Quantify the Issue This handout demonstrates how to access CDC Wonder, Texas Health Data, and VitalWeb
Community Information Book Update October 2005. Social and Demographic Characteristics
 Community Information Book Update October 2005 Public Health Department Social and Demographic Characteristics The latest figures from Census 2000 show that 36,334 people lived in San Antonio, an increase
A Labour Economic Profile of New Brunswick
 A Labour Economic Profile of New Brunswick January 2016 Table of Contents New Brunswick Highlights........................... 2 Current Business Environment....................... 3 GDP Snapshot....................................
King County City Health Profile Vashon Island
 King County City Health Profile Vashon Island West Seattle North Highline Burien SeaTac/Tukwila Vashon Island Des Moines/Normandy Park Kent-West East Federal Way Fed Way-Dash Point/Woodmont December, 212
Globally 12% of all deaths among adults aged 30 years and over were attributed to tobacco.
 SUMMARY Proportion of all deaths attributable to tobacco (%) WHO Region Men Women All adults African 5 1 3 Americas 17 15 16 Eastern Mediterannean 12 2 7 European 25 7 16 South East Asian 14 5 10 Western
Epidemiology of Hypertension 陈 奕 希 3120000591 李 禾 园 3120000050 王 卓 3120000613
 Epidemiology of Hypertension 陈 奕 希 3120000591 李 禾 园 3120000050 王 卓 3120000613 1 Definition Hypertension is a chronic medical condition in which the blood pressure in the arteries is elevated. 2 Primary
Appendix Figure 1 The Geography of Consumer Bankruptcy
 Appendix Figure 1 The Geography of Consumer Bankruptcy Number of Bankruptcy Offices in Each Court Number of Chapter 13 Judges Chapter 13 Filings Per Capita Chapter 13 Discharge Rate Variation in Chapter
Survey on the Mortality from Malignant Tumors of Female Asbestos Spinning Workers
 Table of Contents WS-E-12 Xing Zhang Survey on the Mortality from Malignant Tumors of Female Asbestos Spinning Workers Xing Zhang 1, Tong-da Sun 2, Nan-feng Shi 2, Li-qiu Zhu 1, Kenji Morinaga 3 1 Institute
Children in Egypt 2014 A STATISTICAL DIGEST
 Children in Egypt 2014 A STATISTICAL DIGEST CHAPTER 1 DEMOGRAPHY Children in Egypt 2014 is a statistical digest produced by UNICEF Egypt to present updated and quality data on major dimensions of child
Data Interpretation for Public Health Professionals
 Data Interpretation for Idaho Public Health Professionals Welcome to Data Interpretation for Idaho Public Health Professionals. My name is Janet Baseman. I m a faculty member at the Northwest Center for
The Curriculum of Health and Nutrition Education in Czech Republic Jana Koptíková, Visiting Scholar
 The Curriculum of Health and Nutrition Education in Czech Republic Jana Koptíková, Visiting Scholar ABSTRACT The average one-year health expenditure per capita in the European member states has doubled
growing sources of employment in the country. In
 SRI LANKA 8,000 7,000 6,000 5,000 Fig. 1: Employment by Major Economic Activity ('000s), 2002-2008 Agriculture, Hunting, Forestry, Mining and Wholesale and Retail Trade Hotels and Restaurants Agriculture,
Chapter 14 Quiz. Multiple Choice Identify the choice that best completes the statement or answers the question.
 Chapter 14 Quiz Multiple Choice Identify the choice that best completes the statement or answers the question. 1. Which of the following is NOT true regarding the Chesapeake Bay? a. it is one of many small
DATA WAREHOUSE STAT.UNIDO.ORG
 DATA WAREHOUSE STAT.UNIDO.ORG The Website http://stat.unido.org/ provides online access to different sets of data compiled by UNIDO statistics (http://www.unido.org/statistics). While some data is available
Implementation of Environmental Taxes in China: Transition from Charges to Taxes
 Implementation of Environmental Taxes in China: Transition from Charges to Taxes Yazong Mai School of Environment & Natural Resources Renmin University of China 25 September, 2014 GCET15 in Copenhagen
Using Family History to Improve Your Health Web Quest Abstract
 Web Quest Abstract Students explore the Using Family History to Improve Your Health module on the Genetic Science Learning Center website to complete a web quest. Learning Objectives Chronic diseases such
Alcohol Units. A brief guide
 Alcohol Units A brief guide 1 2 Alcohol Units A brief guide Units of alcohol explained As typical glass sizes have grown and popular drinks have increased in strength over the years, the old rule of thumb
Canada-wide Strategy for the Management of Municipal Wastewater Effluent
 Canada-wide Strategy for the Management of Municipal Wastewater Effluent Endorsed by CCME Council of Ministers, February 17, 2009, Whitehorse Executive Summary Wastewater from households, industrial, commercial
Statistics fact sheet
 Statistics fact sheet Fact sheet last updated January 2015 EXTERNAL VERSION Macmillan Cancer Support Page 1 of 10 Macmillan and statistics Statistics are important to Macmillan because they help us represent
Cancer in Ireland 2013: Annual report of the National Cancer Registry
 Cancer in 2013: Annual report of the National Cancer Registry ABBREVIATIONS Acronyms 95% CI 95% confidence interval APC Annual percentage change ASR Age standardised rate (European standard population)
NIOSH Publishes Study of Cancer Among Firefighters Claire Reiss National League of Cities Risk Information Sharing Consortium.
 NIOSH Publishes Study of Cancer Among Firefighters Claire Reiss National League of Cities Risk Information Sharing Consortium The National Institute for Occupational Safety and Health has released the
Mortality Assessment Technology: A New Tool for Life Insurance Underwriting
 Mortality Assessment Technology: A New Tool for Life Insurance Underwriting Guizhou Hu, MD, PhD BioSignia, Inc, Durham, North Carolina Abstract The ability to more accurately predict chronic disease morbidity
Over-Age, Under-Age, and On-Time Students in Primary School, Uganda
 Primary School Net and Gross Attendance Rates, Uganda More than three quarters of primary school age children in Uganda attend school and gender parity in attendance has been achieved. of children ages
A Study Report on China Environmental and Economic Accounting in 2004
 A Study Report on China Environmental and Economic Accounting in 2004 Wang Jinnan Yu Fang 1 Cao Dong Jiang Hongqiang Zhao Yue Pan Wen Ge Chazhong Guo Xiaomin Gao Shuting Yan Gang (Chinese Academy for Environmental
Facts about Diabetes in Massachusetts
 Facts about Diabetes in Massachusetts Diabetes is a disease in which the body does not produce or properly use insulin (a hormone used to convert sugar, starches, and other food into the energy needed
Is the person a permanent immigrant. A non permanent resident. Does the person identify as male. Person appearing Chinese
 Cole Sprague Kai Addae Economics 312 Canadian Census Project Introduction This project is based off of the 2001 Canadian Census data, and examines the relationship between wages and education, while controlling
Selected Health Status Indicators DALLAS COUNTY. Jointly produced to assist those seeking to improve health care in rural Alabama
 Selected Health Status Indicators DALLAS COUNTY Jointly produced to assist those seeking to improve health care in rural Alabama By The Office of Primary Care and Rural Health, Alabama Department of Public
MORTALITY. Leading Causes of Death and Premature Death IN LOS ANGELES COUNTY
 A PUBLICATION OF THE LOS ANGELES COUNTY DEPARTMENT OF HEALTH SERVICES PUBLIC HEALTH MORTALITY IN LOS ANGELES COUNTY 2001 Leading Causes of Death and Premature Death On a typical day in Los Angeles County
CITY OF EAST PALO ALTO A COMMUNITY HEALTH PROFILE
 CITY OF EAST PALO ALTO A COMMUNITY HEALTH PROFILE www.gethealthysmc.org Contact us: 650-573-2398 hpp@smcgov.org HEALTH BEGINS WHERE PEOPLE LIVE Over the last century, there have been dramatic increases
Wisconsin Health Trends: 2011 Progress Report
 Making Wisconsin the Healthiest State Project Wisconsin Health Trends: 211 Progress Report July 21 School of Medicine and Public Health UNIVERSITY OF WISCONSIN MADISON University of Wisconsin Population
New York State s Racial, Ethnic, and Underserved Populations. Demographic Indicators
 New York State s Racial, Ethnic, and Underserved Populations While much progress has been made to improve the health of racial and ethnic populations, and increase access to care, many still experience
EU China River Basin Management Programme
 Ministry of Water Resources Ministry of Environmental Protection EU China River Basin Management Programme Technical Report 075 Water Resource Supply Security Strategy Analysis Ben Piper, Zhang Wang and
Population, Health, and Human Well-Being-- Nigeria
 Population, Health, and Human Well-Being-- EarthTrends Country Profiles Demographic and Health Indicators Total Population (in thousands of people) 195 29,79 176,775 2,519,495 22 12,47 683,782 6,211,82
The Regulatory Impact Analysis (RIA) for the Mercury Air Toxics Standard (MATS)
 for the Mercury Air Toxics Standard (MATS)") The Regulatory Impact Analysis (RIA) for the Mercury Air Toxics Standard (MATS) Kevin Culligan U.S. Environmental Protection Agency (EPA) Associate Division Director, Sector Policies and Programs Division
The Regulatory Impact Analysis (RIA) for the Mercury Air Toxics Standard (MATS) Kevin Culligan U.S. Environmental Protection Agency (EPA) Associate Division Director, Sector Policies and Programs Division
Population, Health, and Human Well-Being-- Kuwait
 Population, Health, and Human Well-Being-- EarthTrends Country Profiles Demographic and Health Indicators Total Population (in thousands of people) 195 152 111,647 2,519,495 22 2,23 423,296 6,211,82 225
Section C. Diet, Food Production, and Public Health
 This work is licensed under a Creative Commons Attribution-NonCommercial-ShareAlike License. Your use of this material constitutes acceptance of that license and the conditions of use of materials on this
4/3/2012. Surveillance. Direct Care. Prevention. Quality Management
 //1 The Epidemiology of Infectious and Chronic Diseases in Minority Communities December 7, 11 Mary G. McIntyre, M.D., M.P.H. Assistant State Health Officer for Disease Control and Prevention Alabama Department
Butler Memorial Hospital Community Health Needs Assessment 2013
 Butler Memorial Hospital Community Health Needs Assessment 2013 Butler County best represents the community that Butler Memorial Hospital serves. Butler Memorial Hospital (BMH) has conducted community
DOES MORE SCHOOLING CAUSE BETTER HEALTH?
 DOES MORE SCHOOLING CAUSE BETTER HEALTH? MEMORIAL LECTURE IN HONOR OF TADASHI YAMADA 2011 MEETING OF JAPAN HEALTH ECONOMICS ASSOCIATION MICHAEL GROSSMAN CITY UNIVERSITY OF NEW YORK GRADUATE CENTER AND
Online Appendix for Limited Life Expectancy, Human Capital and Health Investment
 Online Appendix for Limited Life Expectancy, Human Capital and Health Investment Authors: Emily Oster, E. Ray Dorsey, Ira Shoulson Appendix A: Incentive Calculations In section 6 we calculate the elasticity
Chart 11-1. Number of dialysis facilities is growing, and share of for-profit and freestanding dialysis providers is increasing
 11 0 Chart 11-1. Number of dialysis facilities is growing, and share of for-profit and freestanding dialysis providers is increasing Average annual percent change 2014 2009 2014 2013 2014 Total number
3.5% 3.0% 3.0% 2.4% Prevalence 2.0% 1.5% 1.0% 0.5% 0.0%
 S What is Heart Failure? 1,2,3 Heart failure, sometimes called congestive heart failure, develops over many years and results when the heart muscle struggles to supply the required oxygen-rich blood to
Number. Source: Vital Records, M CDPH
 Epidemiology of Cancer in Department of Public Health Revised April 212 Introduction The general public is very concerned about cancer in the community. Many residents believe that cancer rates are high
Exercise Answers. Exercise 3.1 1. B 2. C 3. A 4. B 5. A
 Exercise Answers Exercise 3.1 1. B 2. C 3. A 4. B 5. A Exercise 3.2 1. A; denominator is size of population at start of study, numerator is number of deaths among that population. 2. B; denominator is
Racial Disparities in US Healthcare
 Racial Disparities in US Healthcare Paul H. Johnson, Jr. Ph.D. Candidate University of Wisconsin Madison School of Business Research partially funded by the National Institute of Mental Health: Ruth L.
AP Statistics. Chapter 4 Review
 Name AP Statistics Chapter 4 Review 1. In a study of the link between high blood pressure and cardiovascular disease, a group of white males aged 35 to 64 was followed for 5 years. At the beginning of
Likelihood of Cancer
 Suggested Grade Levels: 9 and up Likelihood of Cancer Possible Subject Area(s): Social Studies, Health, and Science Math Skills: reading and interpreting pie charts; calculating and understanding percentages
Connecticut Diabetes Statistics
 Connecticut Diabetes Statistics What is Diabetes? State Public Health Actions (1305, SHAPE) Grant March 2015 Page 1 of 16 Diabetes is a disease in which blood glucose levels are above normal. Blood glucose
Education and Wage Differential by Race: Convergence or Divergence? *
 Education and Wage Differential by Race: Convergence or Divergence? * Tian Luo Thesis Advisor: Professor Andrea Weber University of California, Berkeley Department of Economics April 2009 Abstract This
Chapter 2: Health in Wales and the United Kingdom
 Chapter 2: Health in Wales and the United Kingdom This section uses statistics from a range of sources to compare health outcomes in Wales with the remainder of the United Kingdom. Population trends Annual
Canadian Individual Critical Illness Insurance Morbidity Experience
 Morbidity Study Canadian Individual Critical Illness Insurance Morbidity Experience Between Policy Anniversaries in 2002 and 2007 Using Expected CIA Incidence Tables from July 2012 Individual Living Benefits
Name: Date: Use the following to answer questions 2-3:
 Name: Date: 1. A study is conducted on students taking a statistics class. Several variables are recorded in the survey. Identify each variable as categorical or quantitative. A) Type of car the student
The United American Final Expense Plan 400 Series
 UA INDIVIDUAL WHOLE LIFE Final Expense Plan provides the following insurance features: Permanent whole life insurance coverage issue ages -. Choice of Benefit... Level or Increasing. Increasing Benefit
Suicide: Global Insights and U.S. Insurance Analysis
 Suicide: Global Insights and U.S. Insurance Analysis Global Research and Development Research Bulletin, July 2014 Yunke Chen, Julianne Callaway, and Taylor Pickett www.rgare.com Suicide is a tragic fatality
Gen Re Dread Disease Survey 2004-2008 Initial Results
 Gen Re Dread Disease Survey 2004-2008 Wolfgang Droste Session Number: MBR8 Joint IACA, IAAHS and PBSS Colloquium in Hong Kong www.actuaries.org/hongkong2012/ Agenda Background of Gen Re s Dread Disease
Demographics of Atlanta, Georgia:
 Demographics of Atlanta, Georgia: A Visual Analysis of the 2000 and 2010 Census Data 36-315 Final Project Rachel Cohen, Kathryn McKeough, Minnar Xie & David Zimmerman Ethnicities of Atlanta Figure 1: From
activity guidelines (59.3 versus 25.9 percent, respectively) and four times as likely to meet muscle-strengthening
 and four times as likely to meet muscle-strengthening") 18 HEALTH STATUS HEALTH BEHAVIORS WOMEN S HEALTH USA 13 Adequate Physical Activity* Among Women Aged 18 and Older, by Educational Attainment and Activity Type, 09 11 Source II.1: Centers for Disease Control
18 HEALTH STATUS HEALTH BEHAVIORS WOMEN S HEALTH USA 13 Adequate Physical Activity* Among Women Aged 18 and Older, by Educational Attainment and Activity Type, 09 11 Source II.1: Centers for Disease Control
The Health of Riverside County 2 A Community Health Profile
 The Health of A Community Health Profile The Health of 2 A Community Health Profile The Health of 3 A Community Health Profile TABLE OF CONTENTS Executive Summary.. 3 Acknowledgements.. 5 Introduction...
Unit 12 Logistic Regression Supplementary Chapter 14 in IPS On CD (Chap 16, 5th ed.)
") Unit 12 Logistic Regression Supplementary Chapter 14 in IPS On CD (Chap 16, 5th ed.) Logistic regression generalizes methods for 2-way tables Adds capability studying several predictors, but Limited to
Unit 12 Logistic Regression Supplementary Chapter 14 in IPS On CD (Chap 16, 5th ed.) Logistic regression generalizes methods for 2-way tables Adds capability studying several predictors, but Limited to
Part 4 Burden of disease: DALYs
 Part Burden of disease:. Broad cause composition 0 5. The age distribution of burden of disease 6. Leading causes of burden of disease 7. The disease and injury burden for women 6 8. The growing burden
Source Water Assessment Report
 Source Water Assessment Report Public Water Supply: TROY, CITY OF Assessment Areas Include: 516, 517 Kansas Department of Health and Environment Bureau of Water Watershed Management Section 1000 SW Jackson
Does smoking impact your mortality?
 An estimated 25% of the medically underwritten, assured population can be classified as smokers Does smoking impact your mortality? Introduction Your smoking habits influence the premium that you pay for
Optimizing Water Resources Allocation System and Improving Water Resources Supply Capacity
 Optimizing Water Resources Allocation System and Improving Water Resources Supply Capacity Zhang Shiwei Department of Planning and Programming Ministry of Water Resources, P.R.China May. 2015 Contents
Against the Growing Burden of Disease. Kimberly Elmslie Director General, Centre for Chronic Disease Prevention
 Kimberly Elmslie Director General, Centre for Chronic Disease Prevention Chronic diseases are an increasing global challenge Most significant cause of death (63%) worldwide 1 Chronic diseases cause premature
Big Data for Population Health and Personalised Medicine through EMR Linkages
 Big Data for Population Health and Personalised Medicine through EMR Linkages Zheng-Ming CHEN Professor of Epidemiology Nuffield Dept. of Population Health, University of Oxford Big Data for Health Policy
JESSE HUANG ( 黄 建 始 ),MD,MHPE,MPH,MBA Professor of Epidemiology Assistant President
,MD,MHPE,MPH,MBA Professor of Epidemiology Assistant President") Breast Cancer Epidemiology i in China JESSE HUANG ( 黄 建 始 ),MD,MHPE,MPH,MBA Professor of Epidemiology Assistant President Chinese Academy of Medical Sciences Peking Union Medical College Medical Center
Breast Cancer Epidemiology i in China JESSE HUANG ( 黄 建 始 ),MD,MHPE,MPH,MBA Professor of Epidemiology Assistant President Chinese Academy of Medical Sciences Peking Union Medical College Medical Center
Preliminary Report on. Hong Kong Assured Lives Mortality and Critical Illness. Experience Study 2000-2003
 Preliminary Report on Hong Kong Assured Lives Mortality and Critical Illness Experience Study 2000-2003 Actuarial Society of Hong Kong Experience Committee ASHK - Hong Kong Assured Lives Mortality and
Physical flow accounts: principles and general concepts
 Physical flow accounts: principles and general concepts Julian Chow United Nations Statistics Division 1 st Sub-Regional Course on SEEA 23-27 September 2013 Malaysia SEEA Conceptual Framework Outside territory
Q&A on the carcinogenicity of the consumption of red meat and processed meat
 Q. What do you consider as red meat? A. Red meat refers to all mammalian muscle meat, including, beef, veal, pork, lamb, mutton, horse, and goat. Q. What do you consider as processed meat? A. Processed
Wage Compensation for Risk: The Case of Turkey
 27 November, 2013 Motivation 1 Data According to recent estimates by the International Labor Organization, 6,300 people die each day from occupational accidents or work-related diseases, and the yearly
How do you treat water based on water quality from different water sources?
 How do you treat water based on water quality from different water sources? Why? Authors: Wendy Lane and Kim Sciarrone Seattle Public Schools; Seattle, WA Water from different sources will contain different
A Health Profile of Older North Carolinians
 A Health Profile of Older North Carolinians A Joint Publication of the State Center for Health Statistics and Older Adult Health Branch North Carolina Division of Public Health and North Carolina Division
Populations of Color in Minnesota
 Populations of Color in Minnesota Health Status Report Update Summary Spring 2009 Center for Health Statistics Minnesota Department of Health TABLE OF CONTENTS BACKGROUND... 1 PART I: BIRTH-RELATED HEALTH
Primary School Net and Gross Attendance Rates, Kenya. Over-Age, Under-Age, and On-Time Students in Primary School, Kenya
 Primary School Net and Gross Attendance Rates, Kenya Nearly of primary school age children in Kenya attend school with slightly more females than males attending. of children ages - attend primary school.
Appendix: Description of the DIETRON model
 Appendix: Description of the DIETRON model Much of the description of the DIETRON model that appears in this appendix is taken from an earlier publication outlining the development of the model (Scarborough
2x800 MW Thermal Power Project Near Village Paraspani, Tehsil Pathargama, Godda- District By Adani Power (Jharkhand) Limited
 Limited") (IV) Proposed Terms of Reference for EIA Studies Project Category Project Proponent Location Paraspani Thermal Power Plant (2x800 MW) Coal based Thermal Power Project A [1(d) Thermal Power Plant 500 MW]
(IV) Proposed Terms of Reference for EIA Studies Project Category Project Proponent Location Paraspani Thermal Power Plant (2x800 MW) Coal based Thermal Power Project A [1(d) Thermal Power Plant 500 MW]
A Survey of Wastewater Treatment Facility Installation in China: Opportunities for International Cooperation of Technology Transfer
 IDEAS Machinery Industry Study Report No. 2 A Survey of Wastewater Treatment Facility Installation in China: Opportunities for International Cooperation of Technology Transfer Shuhua Gu Xiliang Zhang Bingxiang
Data Report on Spinal Cord Injury
 Indiana State Department of Health Injury Prevention Program Data prepared by Jodi Hackworth and Joan Marciniak December 12, 27 DATA HIGHLIGHTS Data Report on Spinal Cord Injury The leading cause of spinal
Soils and Underground Water Contamination & Remediation In China. Presented by Tom Ward Beijing, July 23, 2013
 Soils and Underground Water Contamination & Remediation In China Presented by Tom Ward Beijing, July 23, 2013 1 Agenda China s Soils and Underground Water Contamination Current Technologies Used Government
NHS Barking and Dagenham Briefing on disease linked to Asbestos in Barking & Dagenham
 APPENDIX 1 NHS Barking and Dagenham Briefing on disease linked to Asbestos in Barking & Dagenham 1. Background 1.1. Asbestos Asbestos is a general name given to several naturally occurring fibrous minerals
Projections of Global Meat Production Through 2050
 Projections of Global Meat Production Through 2050 Dr. Thomas E. Elam Center for Global Food Issues President, FarmEcon Summary: Meat production growth is driven by a combination of increases in economic
Statistical Report on Health
 Statistical Report on Health Part II Mortality Status (1996~24) Table of Contents Table of Contents...2 List of Tables...4 List of Figures...5 List of Abbreviations...6 List of Abbreviations...6 Introduction...7
STATISTICAL LITERACY SURVEY ANALYSIS: READING GRAPHS AND TABLES OF RATES AND PERCENTAGES. Milo Schield Augsburg College, United States milo@pro-ns.
 STATISTICAL LITERACY SURVEY ANALYSIS: READING GRAPHS AND TABLES OF RATES AND PERCENTAGES Milo Schield Augsburg College, United States milo@pro-ns.net In 2002, an international survey on reading graphs
Optimal levels of alcohol consumption for men and women at different ages, and the all-cause mortality attributable to drinking
 Optimal levels of alcohol consumption for men and women at different ages, and the all-cause mortality attributable to drinking Ian R. White, Dan R. Altmann and Kiran Nanchahal 1 1. Summary Background
Analysis of Fire Statistics of China: Fire Frequency and Fatalities in Fires
 Analysis of Fire Statistics of China: Fire Frequency and Fatalities in Fires FULIANG WANG, SHOUXIANG LU, and CHANGHAI LI State Key Laboratory of Fire Science University of Science and Technology of China
Diabetes. African Americans were disproportionately impacted by diabetes. Table 1 Diabetes deaths by race/ethnicity CHRONIC DISEASES
 Diabetes African Americans were disproportionately impacted by diabetes. African Americans were most likely to die of diabetes. People living in San Pablo, Pittsburg, Antioch and Richmond were more likely
Appendix E. Methodology for Statistical Analyses. Comparing North Carolina s Local Public Health Agencies 1
 Appendix E Methodology for Statistical Analyses Comparing North Carolina s Local Public Health Agencies 1 Appendix E Methodology for Statistical Analyses Data Based on prior research and data availability,
Upstate New York adults with diagnosed type 1 and type 2 diabetes and estimated treatment costs
 T H E F A C T S A B O U T Upstate New York adults with diagnosed type 1 and type 2 diabetes and estimated treatment costs Upstate New York Adults with diagnosed diabetes: 2003: 295,399 2008: 377,280 diagnosed
Study into average civil compensation in mesothelioma cases: statistical note
 Study into average civil compensation in mesothelioma cases: statistical note Nick Coleman, John Forth, Hilary Metcalf, Pam Meadows, Max King and Leila Tufekci 23 April 2013 National Institute of Economic
Table of Contents. I. Executive Summary... 1. A. Summary of our Findings... 1. II. Background... 2. III. Methodology... 4. IV. Key Data Sources...
 Table of Contents I. Executive Summary... 1 A. Summary of our Findings... 1 II. Background... 2 III. Methodology... 4 IV. Key Data Sources... 6 A. WCIS Data... 6 B. SEER Data... 8 V. Discussion of NIOSH
Pension Issues: Lump-Sum Distributions and Retirement Income Security
 Cornell University ILR School DigitalCommons@ILR Federal Publications Key Workplace Documents 1-7-2009 Pension Issues: Lump-Sum Distributions and Retirement Income Security Patrick Purcell Congressional
Human resources of science and technology in 2009
 Science, Technology and Information Society 2011 Human resources of science and technology in 2009 Employment rate exceptionally high among those with tertiary level s In 2008, 85 per cent of those with
Alabama s Rural and Urban Counties
 Selected Indicators of Health Status in Alabama Alabama s Rural and Urban Counties Jointly produced to assist those seeking to improve health care in rural Alabama by The Office of Primary Care and Rural
The cost of physical inactivity
 The cost of physical inactivity October 2008 The cost of physical inactivity to the Australian economy is estimated to be $13.8 billion. It is estimated that 16,178 Australians die prematurely each year