Cluster Benchmarking in Poland Survey report
|
|
|
- Jemimah Berry
- 10 years ago
- Views:
Transcription
1 Cluster Benchmarking in Poland 2010 Survey report

2

3 Project co-financed by the European Union under the European Social Fund Cluster Benchmarking in Poland 2010 Survey report WARSAW 2010

4 The publication has been prepared as part of the system project of the Polish Agency for Enterprise Development, entitled Development of human resources through promotion of knowledge, transfer and popularisation of innovation, financed from the European Social Fund under the Operational Programme Human Capital (OP HC): sub-measure Opinions and arguments presented in the publication do not reflect the position of the Polish Agency for Enterprise Development, but only the position of the Authors. Authors: The Public Sector Team of Deloitte Business Consulting S.A REVIEWERS: Bogusław Plawgo, PhD, Associate Professor Dr Witold Witowski, PhD Experts: Aleksandra Nowakowska, PhD Zbigniew Przygodzki, PhD Mariusz E. Sokołowicz, PhD Krzysztof B. Matusiak, PhD Aleksander Bąkowski, PhD The publication is also available in electronic version on the Innovation Portal and on CD Free publication Copyright by Polska Agencja Rozwoju Przedsiębiorczości, Warsaw 2010 Made by: Deloitte Business Consulting S.A. Editor: Polish Agency for Enterprise Development ul. Pańska 81/ Warsaw Tel fax: [email protected] ISBN Circulation 1000 copies Edition I Printed by: Printing House Ul. Szkolna Ząbki

5 List of Contents 1. Introduction Summary of the report Cluster benchmarking in Poland: objectives, scope and methodology Project objectives Benchmarking methodology The scope of the project and contract implementation manner General information concerning clusters in Poland Introduction to benchmark analysis Cluster resources Human resources and know how of the cluster Financing of the operation of the clusters Cluster infrastructure Processes in clusters Joint market activity of clusters Marketing and PR activity of the cluster Communication in cluster Creation of knowledge and innovations Cluster performance Development of human resources Improvement of competitive position Improvement of innovativeness Clusters internationalization The growth potential of clusters Regional predispositions Public authorities policy in favour of the development of the cluster Institutional surrounding

6 9.4 Cluster leadership Cluster strategies The benefits of scale Creating a knowledge and innovation network Impact on business environment Impact on the natural environment Conclusions and recommendations Conclusions of the survey Conclusions and recommendations from the survey addressed to coordinators and entities functioning in clusters Conclusions and recommendations from surveys addressed to entities shaping cluster policy at national level Conclusions and recommendations from the study addressed to entities shaping cluster policy at regional level Methodological conclusions and recommendations and cluster analysis tools English Summary List of Tables List of Charts List of Maps List of Best Practices

7 1. Introduction Cluster benchmarking is the first analysis of the kind performed on such a large scale. The benchmarking survey aims at the identification of practices and processes implemented in clusters against the model activities, so-called benchmarks. The survey is to contribute both to identification of best practices in various clusters, and to providing information for the clusters about the opportunities to improve their performance. The methodology developed by experts on clustering enabled to identify 85 indicators grouped into 5 areas and 18 sub-areas of the clusters subject to the survey. The survey was performed and reports were developed on this basis. 48 reports were prepared under the project, including 47 reports devoted to all the surveyed clusters and a general report. The present general report was prepared as part of the project and presents the cluster benchmarking survey in Poland. It includes a presentation of total results, conclusions and recommendations both for the clusters and public administration units, and the scientific circles supporting their activity. The general report includes a summary in Polish, a description of the objective and scope of the project, and of the methodology in use. Characteristics of the surveyed clusters have also been included in the report. Then results of cluster benchmarking in Poland were described in five areas covered by the survey (cluster resources, cluster processes, cluster results, growth potential and strategy). The subsequent part of the report includes results and recommendations. The report also contains a summary in English.

8 2. Summary of the report Objectives and methodology Benchmarking, also known as comparative analysis or comparative assessment, consists in confronting an organisation s qualities with its competitors or leading companies in a sector, which helps to identify best practices and implement them in one s own organisation. Benchmarking enables to choose the best solutions, improve processes implemented in organisations, identify the competitive position. It also helps to set achievable goals, future trends and directions for development. The most efficient solutions which may constitute an example to follow are sought in the benchmarking process. The present project aims at the cluster benchmarking in Poland, and, in consequence, identification of best practices which may constitute an example to follow. The aim of the present study is both to broaden the knowledge on the status of cluster development in Poland and to promote the idea of clusters. Its goal is also providing clusters with information on the opportunities to improve their activities and demonstrating best practices applied in Poland. The cluster benchmarking methodology which has been used in the described analysis was created in 2008 by a group of experts on benchmarking and cluster theory 1. The authors of the methodology used diverse methods and experiences mostly from the Western Europe countries, taking into consideration Polish conditions. The concept of the analysis in the form of Polish clusters benchmarking was divided into two integral parts: Part A. Cluster characteristics the areas of analysis characteristics are: sector of operation, management structure, region of origination, development types and stages, structure, external projects and objectives. Part B. Cluster benchmarking focused on comparing the development stage in various operation areas, and in consequence, on improving its market position, identifying the best-operating ones in Poland and demonstrating good solutions and examples of their application. 5 key benchmarking areas were chosen for the aim of the analysis: cluster resources processes in a cluster, cluster performance, the growth potential of a cluster; cluster strategy. An important factor in the cluster benchmarking is finding the best practices in the key areas which influence the efficiency of the cluster s functioning. Results and recommendations The analysis covered clusters from all regions of Poland (at least one from each voivodeship). The clusters were formed in , the largest number originated in The initiators of 1 Benchmarking Klastrów, cz I. Opracowanie i opis metodyki benchmarkingu klastrów w Polsce, A. Nowakowska, Z. Przygodzki, M. Sokołowicz, J. Chądzyński, K. Matusiak, M. Klepka, Łódź 2008

9 cluster formation were most often private sector entities, though to a large extent in cooperation with the R&D units, non-governmental sector or public administration institutions. More than a half of the researched clusters are currently in the first development stage the incubation phase, which is reflected in the results of cluster benchmarking. Cluster formalise their structure most often through the establishment of associations, signing consortium contracts or agreements. They generally associate enterprises, though almost every cluster has representatives of other types of institutions, such as R&D units, nongovernmental sector and public administration. Small and medium enterprises prevail among the enterprises which are the cluster members (47% of the members). Microenterprises (43%) and large enterprises are also present, though the latter are the least numerous (10%). The researched clusters represent both highly innovative branches (these are 15 clusters, active a.o. in the information, aviation, eco-energy sectors), medium (19 clusters operating in a.o. tourism and hotels) and of low innovativeness (13 clusters a.o. from the construction, poligraphy, wood/furniture sectors). The results in the Cluster resources area indicate that the analysed entities do not possess resources adequate for the implementation of their tasks. This concerns mostly their financial and infrastructural resources. The above leads to the conclusion that adequate instruments should be created to support financial standing of clusters and the infrastructure accessible for their members. Differences between cluster resources in Poland are significant. The number of persons employed in entities being cluster members varies from 60 to more than Cluster funds vary from PLN 0 to 23 million. The surface of accessible laboratories in the clusters which have such surface varies from 30 to m2. Cluster processes including market activity of clusters, knowledge exchange, internal communication and marketing and PR achieved an acceptable score. Differences between the clusters result to a large extent from the specificity of the branch they function in, earlier cooperation experience of cluster members and different objectives. Clusters undertake both large-scale activities, such as development of a joint product, and smaller-scale ones, e.g. preparation of a common advertisement brochure. Joint activities include mostly information, knowledge and experience exchange among cluster members, and marketing activities preparation of common leaflets and web pages. In the majority of cases, activities undertaken by clusters do not improve their innovativeness or competitive position. Although 1 in 3 analysed clusters operates in highly innovative sectors, they allocate small proportion of funds to the R&D. Neither do clusters undertake measures providing legal protection for the innovations introduced therein. Clusters use the potential of cooperation with foreign institutions or clusters to a small extent. Clusters judge their own growth potential rather positively. The position and activity of coordinators is particularly well-assessed. Strengthening of the role of leaders and activating other cluster members are also necessary, so that the structure achieves its planned goals. The least positive was the assessment of the influence of financial and organisational support from public authorities on the development potential of a cluster, and the opportunity to use external private financing. Investment attractiveness, economic traditions of a region and

10 cooperation with R&D units were included among the most important factors for cluster development. Only slightly more than 60% of clusters have formal development strategies. Many operate on the basis of an informal strategy. Some clusters do not have such strategy at all. The following were mentioned as the most important objectives of cluster activity: sector development, increased project opportunities, exchange of knowledge and experiences among the cluster members, The most important recommendations, including recommendations for clusters, public administration and self-governments are summarised below.

11 Table 1. Summary of the recommendations resulting from the Organisation and performance of cluster benchmarking in Poland analysis Recommendations addressed to coordinators and entities functioning in clusters; building awareness with respect to clustering and the advantages of cluster membership building mutual trust among cluster members activation of cluster members strategic planning of activities and optimisation of management processes seeking alternative solutions for public funding of clusters improvement innovativeness improvement of cooperation with the cluster s surrounding improvement of cooperation with public administration of seeking and building partnerships with R&D sector present in the cluster s surrounding Recommendations for government policymakers creating cluster support strategy building social capital identification of cluster needs to prepare instruments of support financing cluster activities depending on the growth phase reflected in multiannual plans for clusters preparation of systemic support instruments for clusters improvement of vocational education system supporting coordination with scientific units encouraging R&D units to research aiming at development of solutions which may be used in business evaluation of the activity of administration Recommendations for the entities of self-government cluster policy providing cohesion of activities at all levels (cohesion with government strategy) developing regional support tools interregional exchange of experiences increasing attractiveness of a region increasing the influence of regional innovation strategies on cluster activity undertaking activities promoting clusters at regional level

12 3. Cluster benchmarking in Poland: objectives, scope and methodology 3.1. Project objectives Developing clusters and supporting their operations is a vital part of economic policy. Europe has known their benefits for a long time, which has resulted in developing a cluster-based policy (CBP). The policy is founded on the assumption that business, science and public authorities of different levels cooperate on a common platform. Special instruments and activities are to enhance the competitiveness of economy by encouraging the development of existing clusters and the emergence of new ones. After its accession to the European Union, Poland became the beneficiary of EU policy and its aid schemes. As a result, it was possible to finance projects which concentrated on establishing links between enterprises, scientific institutions and public administration. Thanks to a strong cooperation platform, Polish small and medium enterprises are becoming more and more competitive and innovative in comparison with companies in other European countries. In its Communication of 17 October , the European Commission underlined the importance of establishing and developing the network of clusters in Europe. The updated EU framework policy on aid measures provides for the necessity of investing public funds in the development of clusters in view of their value for the Union's economic policy. The Commission also agrees that cluster policy plays an important role in supporting regional innovation systems and the creation of international business links. According to the Commission, strong clusters offer a unique combination of entrepreneurial dynamism, intensive linkages with top-level knowledge institutions and increased synergies among innovation actors, thus contributing to the building of a knowledge-based economy and, therefore, to achieving the objectives of the Lisbon Partnership for Growth and Jobs, as well as European Community's new strategy Europe According to the definition adopted by PAED 3, a cluster is a geographic concentration of interconnected businesses, specialised suppliers, entities providing services, companies operating in related sectors and associated institutions (e.g. universities, standardisation entities, industry associations, supporting bodies), competing and cooperating with one another. Cluster is strictly connected with the territory in which it operates and is regionally rooted. Clusters constitute a specific form of production organization involving concentration of flexible companies that carry out complementary business activities in close proximity. The entities both cooperate and compete, as well as build relationships with other institutions in a specific field. A cluster is based on cooperative links between entities that generate specific knowledge-building processes and increase adaptation abilities. 2 Communication from the Commission to the Council, the European Parliament, the European Economic and Social Committee and the Committee of the Regions of 17 October Towards world-class clusters in the European Union: Implementing the broad-based innovation strategy (COM/2008/0652) 3 Own study, based on: K.B. Matusiak (red.), Innowacje i transfer technologii. Słownik pojęć, Polska Agencja Rozwoju Przedsiębiorczości, Warsaw 2008

13 In order to operationalise the term, when preparing the study, apart from thus defined clusters, other types of cluster phenomena were also identified but they were not included in the study on clusters in Poland 4 : entrepreneurial environments which start to organise themselves, where the developed network of cooperation between the participants cannot be identified yet; cluster initiatives (the term cluster initiative in this research should be understood as both initiatives aimed at the development of a cluster which doesn t exist yet and initiatives aimed at the development of an already existing cluster); projects or institutions which in fact, at the current stage of development/network organization/organization of the entrepreneurial environment, are not clusters or were incorrectly named clusters. This study adopted basic criteria on the basis of which clusters were identified: the inventory involved both formally registered clusters having a specific organizational and legal form and clusters which did not have an organizational and legal form; in the case of informal cluster, its participants were aware that they belong to a cluster and operate in a cluster. There was also a regional awareness of the cluster s existence; concentration around a dominant industry; a cluster could operate both in the production and services sector and the agricultural sector; geographic concentration and the awareness of territorial identity of the cluster; durability of cooperation (at least within the core of the cluster); joint initiatives - carrying out joint projects, existence of value chain elements that are common to enterprises / institutions operating in the cluster. Benchmarking is one of the instruments of the cluster-based policy. This methodology allows seeking the most efficient method of carrying out an activity through comparing methods applied by a given cluster to the ones implemented by model clusters. The European Commission underlines that searching for best practices should be treated as a priority. That is why, a special platform the so-called European Cluster Observatory has been created in order to enable all cluster stakeholders to access information on cluster policy, best practices and solutions applied in different EU Member States as quickly as possible. The aim of the present study is both to broaden the knowledge on the status of clusters in Poland and to promote the idea of clusters. Its goal is also providing clusters with information on the possibilities of improving their operations and showing best practices applied in Poland. The key objective of cluster benchmarking in Poland is: 4 Based on: Benchmarking Klastrów, cz II. Inwentaryzacja klastrów w Polsce, A. Nowakowska, Z. Przygodzki, M. Sokołowicz, J. Chądzyński, K. Matusiak, M. Klepka, 9 Łódź 2008
; projects or institutions which in fact, at the current stage of development/network organization/organization of the entrepreneurial environment, are not")
14 providing clusters with a useful tool to improve their operations, gather knowledge and learn Thanks to the interviews conducted, clusters will gain knowledge on their own position. They will be provided with structured information on their activity, including standardised indicators. They will easily notice their strengths and weaknesses, that is areas in which more work is needed. demonstrating the best solutions and practices applied in Polish clusters The comparative study allows for looking into clusters' activity and singling out solutions which may constitute examples for others to follow. indicating recommendations regarding cluster support policy to be implemented both on the national (government policy) and regional/local (selfgovernment policy) level Both government and self-government actions are aimed at supporting interaction within the cluster policy. Their goal is to strengthen the links between three key actors of the economic system, such as the enterprises, the world of science and public authorities. The study of clusters, conducted under this project, will allow for a more efficient stimulation of all linkages, both inside the cluster and in its environment, as well as selection of appropriate innovation support tools. providing recommendations for other entities that support clusters and cooperate with them, in particular R&D institutions, as well as innovation and enterprise support centres Not only public authorities are interested in the results of the project. Among stakeholders there are also scientific centres, R&D institutions, business incubators and innovation support centres. It's due to the fact that benchmarking makes it possible to determine the competitive position, objectives, future trends and directions of development. R&D units and innovation support centres offer highlyspecialised business and innovation support services. Their task is to enable exchange of knowledge between enterprises and the industry and research sector. collecting knowledge on the current cluster development stage in Poland and internal processes carried out in clusters promoting the idea of clusters in Poland. Participating in the study has many advantages for clusters. The basic ones are: the possibility of promoting the cluster at the national forum, exchanging information on the cluster's development, which will be reflected in the general report, obtaining an individual, free-of-charge report containing an analysis of cluster s strengths and weaknesses, including the best practices suggested for a given cluster, the possibility of having a meeting with the Contractor, during which a dedicated report will be presented, the results of the analysis will be

15 explained and suggestions on changes necessary for further development of a cluster will be discussed, free-of-charge participation in an international conference closing the project, which is planned to take place on 14 October 2010 in Warsaw and which will be an opportunity to collect knowledge on the experience of Polish and foreign clusters, as well as to establish an inter-cluster cooperation, free-of-charge participation in two training courses in the form of a Webcast (interactive Internet courses) devoted to the possibility of obtaining support from the Structural Funds, as well as other means of financing clusters operations. The present study, which has been conducted for the first time on this scale in Poland, is also an opportunity for the clusters to share information on their needs in relation to policies supporting their development.

16 3.2. Benchmarking methodology Benchmarking is a constant, systematic process, concentrated on the measurement and comparison of products, processes or ways of operating, which is aimed at the improvement of the effectiveness of the functioning of the organization. It consists of four basic elements: identification of the subject, data and information analysis, designing of changes, implementation of best solutions. Benchmarking is a method of copying others. This technique makes it possible (through observation) to get to know the best solutions in a given field and implement them. Thus, benchmarking is copying in a positive sense, a way of learning and adapting with minimum risk of failure. Clusters in Poland, being relatively young entities, are searching for optimal solutions guaranteeing their stable growth and competitiveness. Thanks to cooperation and exchange of experiences, cluster enterprises improve the standard of offered goods and services. The best organisational solutions successfully introduced in one cluster can be adapted (irrespective of the type of industry) in another cluster. That is why, benchmarking is justified. This method remains a wide-spread instrument of improving clusters' operations and increasing their effectiveness. Examples of benchmarking studies One of the first studies which applied the benchmarking method, although on a small scale, was the study conducted among six industries included in the Programme for Export Development EXPROM II in Benchmarking analysis is also promoted as one of the auxiliary techniques in the quality function development method (QFD), a method of quality management. The first, large-scale research project based on benchmarking in Poland was the Benchmarking of technology parks in Poland. 5 The study covered six topics related to the functioning of such parks (organisation and management, infrastructure and resources, park's offer, park's residents, technology transfer and commercialisation, operation effectiveness, promotion and communication, impact and cooperation in the region). The study involved an analysis of factors influencing the decisions concerning the parks management, investments, shaping of offer and initiating cooperation with other partners. For each researched topic indicators were also calculated. The result of the study were two rankings: a thematic and collective one. On the basis of the ranking, each park was classified according to its current situation and development possibilities and included in a perspectives matrix. The project also pointed out the best practices which were later described and included in the final report. Each park participating in the study also received an individual report which identified its strengths and weaknesses and suggested changes related to the effectiveness of operations. 5 Benchmarking parków technologicznych w Polsce. Wyniki badania, PARP, Warsaw 2008
 to get to know the best solutions in a given field and implement them.")
17 Among foreign benchmarking projects the Benchmarking of IKT Grenland Cluster with relation to other ICT clusters should be mentioned here 6. In 2009, the Norwegian IKT Grenland cluster was analysed and compared with clusters from the ICT industry from Germany and Denmark. The study concentrated on the following dimensions of the cluster: cluster structure, cluster financing, market activity, processes in the cluster, internationalisation of the cluster, achievements and performance. The total of 47 indicators were defined in these areas. The results of the study shed light on strengths and weaknesses of IKT Grenland in specific dimensions, as well as on potential directions of its development. The report was prepared in cooperation with the Institute of Innovation and Technology and the Kompetenznetze Deutschland (German Competence Network Agency). The end result of the study was such that the IKT Grenland was put on the list of clusters which ranked the highest in comparative analysis. Other interesting ways of using benchmarking in the public services sector are presented below. During the 14 th edition of an international air transport science conference organised by the Air Transport Research Society (ATRS), an annual report devoted to the effectiveness of airports was presented (Global Airport Benchmarking Report 2010) 7. The results of the benchmarking are used not only by airports and airlines, but also by governments, consultants, public investors, scientists and students. The authors of the report convince that diversification of airport revenue sources is crucial not only for the good financial condition of modern airports but also for their efficient management and operation. The study covered 142 airports. Six airports in three different geographical regions were singled out with relation to their operational efficiency, management effectiveness and cost competitiveness. European Cities Marketing (ECM) launched the sixth edition of the European Cities Marketing Benchmarking Report in June The report includes the latest figures about the performance of European cities in 2009 and illustrates the main trends in city tourism between 2004 and 2009 from 101 European cities. The analysis ends with a conclusion that competing cities should carry out active marketing activities based on exact data that would allow them to determine their market position in comparison to other cities, for example by taking account of their investment, tourism and communication potential. The results of the report encourage gathering data by means of benchmarking and carrying out comparative analyses among competing cities. The Report also includes an estimation of prospects for 2010 based on an expert pool of 89 managers of ECM-member cities. 9 6 Cluster Benchmarking Report, IKT Grenland, G. Meier zu Kócker, Institute for Innovation and Technology, VDI/VDE Innovation + Technik GmbH, Berlin See: Report on the effectiveness of international airports, The ATRS report has been prepared by 13 leading scientists from Asia, Europe, North America and Australia and edited by professor Tae H. Oum of Sauder School of Business, University of British Columbia in Vancouver, Canada See:

18 Cluster studies in Poland As regards studies on clusters, first such study in Poland was carried out in It was conducted by the Institute for Market Economics. Its main goal was the identification of clusters in Poland. It constituted an introduction to an analysis of the potential and opportunities of developing cluster structures within Polish economy. Thanks to the study it was possible to identify areas of business activity concentration and to assess the status of development of cluster structure in Poland, as well as barriers and prospects for the future. Research into the possibility of establishing SME clusters was initiated at the beginning of the 90s of the previous century. At that times, programmes financed from pre-accession funds were used (e.g. SME Clustering & Networking in Poland, Polska Fundacja Promocji i Rozwoju Małych i Średnich Przedsiębiorstw). Research works on the Terza Italia 10 phenomenon have been conducted in Poland since the beginning of the 70s. In recent years, a lot of cluster studies were carried out, of which the following are worth mentioning: Development of clusters in Poland 11 Industry clusters in Kujawsko-Pomorskie Voivodeship - studies on the polygraph and electronic industries 12 Development of cluster structures in Eastern Poland 13 Assessment of clusters performance in Łódzkie Voivodeship 14 Qualitative analysis. Cluster initiatives potential in Małopolskie Voivodeship 15 Plan of clusters support in Małopolskie Voivodeship 16 Analysis of clusters potential in technological domains 17 Clusters development prospects in Opolszczyzna 18 Clusters as the development potential Podlaskie Voivodeship 19 Recommendations for the policy of stimulating cluster development in Pomorskie Voivodeship 20 Initial analysis of three potential clusters in Zachodniopomorskie Voivodeship The so-called Third Italy a phenomenon of concentration in specific sectors and Italian regions leading to a steep increase in the number of small and medium industrial enterprises. Such clusters were able to obtain a strong position on the world markets in the traditional products sector. 11 Rozwój Klastrów w Polsce, J. Hołub-Iwan, M. Małachowska, Studies carried out as part of a grant competition organised by the Ministry of Regional Development, Szczecin Klastry branżowe w województwie kujawsko-pomorskim, M. Baron, Rozwój struktur klastrowych w Polsce Wschodniej, red. B. Plawgo, Report prepared on the basis of regional expert opinions drawn up at the request of the Ministry of Regional Development, Warsaw Ocena funkcjonowania klastrów województwa łódzkiego, PAG Uniconsult, Instytut badań społecznych, report prepared at the request of the Marshal s Office of Łódzkie Voivodeship, Analiza jakościowa. Potencjał inicjatyw klastrowych w województwie małopolskim, L. Palmen, A. Powroźnik, M. Baron, Plan wspierania klastrów w województwie małopolskim, Krakowski Park Technologiczny, Analiza potencjału klastrów w obszarach technologicznych, M. Kuflowski, Perspektywy rozwoju klastrów na Opolszczyźnie, A. Żurawska, K. Brandys, K. Bedrunka, P. Rychlicki, Klastry jako potencjał rozwoju - województwo podlaskie, B. Plawgo, M. Klimczuk, M. Citkowski, Fundacja BFKK, Białystok Rekomendacje dla polityki stymulowania rozwoju klastrów w województwie pomorskim, M. Dzierżanowski, M. Koszarek, S. Szultka, Wstępna analiza trzech potencjalnych klastrów w województwie zachodniopomorskim, S. Szultka, M. Koszarek, D. Piwowarczyk, Instytut Badań nad Gospodarką Rynkową, Gdańsk 2005

19 Cluster development strategy in Świętokrzyskie Voivodeship 22 Diagnosis and a detailed analysis of the status and competitive potential of clusters in Świętokrzyskie Voivodeship 23 Study on the development potential of business networks, including cluster initiatives in Wielkopolska region 24 Supporting the development of clusters in Poland and abroad experiences and challenges 25 Policy of supporting clusters, best practices, recommendations for Poland 26 Development of clusters in the Dolny Śląsk region 27 Identification of existing and potential clusters in the Dolny Śląsk region 28 German-Polish Network-based R&D Co-operation 29 Clusters in the EU-10 new member countries 30 Clusters in Poland 31 The role of Maritime Clusters to enhance the strength and development of maritime sectors. Country report - Poland 32 Methodology adopted in this project The cluster benchmarking methodology as applied in this study was developed in 2008 by a group of benchmarking and cluster theory specialists. 33 The proposed methodology builds on diverse methods and experiences coming mainly from the countries of Western Europe and taking account of Polish conditions. The goal of this methodology is to conduct the benchmarking of clusters in Poland in a coherent and transparent way. The direct addressees of the results of cluster benchmarking are companies functioning within clusters as well as cluster coordinators. Indirectly, results of the project are addressed to all interested in the functioning of clusters in Poland, including above all territorial self-governments, institutions supporting entrepreneurship and innovation, government agencies and representatives of the world of science Strategia rozwoju klastrów w województwie świętokrzyskim, Z. Olesiński, Kielce Diagnoza i szczegółowa analiza stanu i potencjału konkurencyjnego klastrów w województwie świętokrzyskim, Z. Olesiński, A. Sabat, Badanie potencjału rozwoju gospodarczych sieci powiązań, w tym inicjatyw klastrowych, w Wielkopolsce, B. Jankowska, R. Romanowski, M. Urbaniak, M. Pietrzykowski, Akademia Ekonomiczna w Poznaniu, Poznań Wspieranie rozwoju klastrów w Polsce i zagranicą - doświadczenia i wyzwania, R. Botham, Z. Dynak, M. Dzierżanowski, K. Erlandsson, K. Gulda, K. Izsak, M. Kedback, H. Kergel, P. Kryjom, M. Kuberka, A. Rybka, S. Szultka, Polityka wspierania klastrów, najlepsze praktyki, rekomendacje dla Polski, T. Brodzicki, S. Szultka, P. Tamowicz, Niebieskie Księgi/Rekomendacje 2004 nr 11, Instytut Badań nad Gospodarką Rynkową / Polskie Forum Strategii Lizbońskiej, Gdańsk Rozwój klastrów w regionie dolnośląskim, P. Fabrowska, M. Halicki, D. Kozdęba, P. Piotrowska, A. Szerenos, Identyfikacja istniejących i potencjalnych klastrów w regionie dolnośląskim, ECORYS Polska Sp. z o.o., German-Polish Network-based R&D-Co-operation, G. Meier zu Kócker, D. Hein, M. Chinalski, Clusters in the EU-10 new member countries, C. Ketels, Ó. Sólvell, Clusters in Poland, Country Report: Poland, S. Kosińska, The role of Maritime Clusters to enhance the strength and development of maritime sectors. Country report - Poland, European Commission, Benchmarking Klastrów, cz I. Opracowanie i opis metodyki benchmarkingu klastrów w Polsce, A. Nowakowska, Z. Przygodzki, M. Sokołowicz, J. Chądzyński, K. Matusiak, M. Klepka, Łódź Ibid.

20 The concept of the analysis in the form of Polish clusters benchmarking was divided into two integral parts: Part A. Cluster characteristics, including the following aspects: sector of operation, management structure, region of origination, development types and stages, structure, external projects and objectives. Part B. Cluster benchmarking - focused on comparing the development stage in various operation areas, and in consequence, on improving its market position, identifying the best-operating ones in Poland and demonstrating good solutions and examples of their application. Five key benchmarking areas were chosen for the analysis: cluster resources, processes in the cluster, cluster performance, the growth potential of the cluster; cluster strategy. As part of the research, 18 specific areas (sub-areas) were identified within the 5 key areas. 35 Benchmarking areas and sub-areas with relevant indicators are presented in Table 1. Some of the indicators were changed due to difficulties in collecting reliable data. In some cases the possibility of making estimations was introduced and in others reference to the core of the cluster. 36 It results from the fact that processes taking place in the cluster s core overlap to a high degree with activities at the level of the entire cluster. Benchmarking indicators Table 2. Key cluster benchmarking areas PART A CLUSTER CHARACTERISTICS Cluster 1. Basic data characteristics 2. Sector of cluster s operation 3. Cluster management structure 4. Region of origination 5. Development type 6. Development stage 7. Cluster structure 8. External projects carried out by the cluster 9. Objectives of cluster s operation PART B CLUSTER BENCHMARKING Area I. Cluster resources I.1. Human I.1.1. Total employment in entities forming the cluster (in parentheses, the resources and measure: number) 37 know-how I.1.2. Number of individuals managing the cluster administrative support (number) I.1.3. Number of cluster participants enterprises, R&D entities, supporting entities (number) 35 Ibid. 36 A sector gathering the most active companies in the cluster functioning in the basic sector of its activity (definition included in the Glossary Appendix no 8 to the Terms of Reference) 37 Introduction of estimate precision up to ten persons.

21 I.2. Financial resources I.3. Infrastructural resources (tangible) I.1.4. R&D employment in the cluster (number) 38 I.1.5. University graduates employed in the cluster (% share) 39 I.1.6. Number of shared projects carried out by the cluster over the last two years (number) Funds for shared projects implementation over the last two years co-funding of cluster initiatives (amount in PLN) I.2.2. External funding obtained for cluster initiatives over the last two years (amount in PLN) I.2.3. Total value of investments implemented over the last two years by cluster members (amount in PLN) 40 I.3.1. Office and conference room space used for cluster purposes (size in m 2 ) I.3.2. Lab space available for cluster members (size in m 2 ) I.3.3. Cluster members using the shared internal network (% share) I.3.4. Value of lab infrastructure available for cluster members (amount in PLN) 41 Area II. Cluster processes (for each sub-point, score from 0 to 10) II.1. Market II.1.1. Joint supplies and orders activity II.1.2. Joint distribution channels II.1.3. Joint offer prepared by the cluster for external clients II.1.4. Market information exchange among cluster members II.2. Marketing and PR II.3. Internal communication II.4. Knowledge and innovation shaping II.2.1. Joint cluster advertising activities (leaflets, folders, media) II.2.2. Joint presence at fairs and exhibitions II.2.3. Joint lobbying II.2.4. Shared websites II.2.5. Visual identification system (e.g. shared logo, colours, business stationery) II.2.6. Contacts and cluster presence in mass media II.3.1. Regular meetings of cluster members II.3.2. Cluster integration events II.3.3. Shared communication platform (such as Intranet) II.3.4. Cluster press (including newsletters) II.4.1. Cooperation on development of new products and technologies II.4.2. Cooperation on introduction of innovations (organizational, marketing, service-related) II.4.3. Shared training, workshops, conferences and study visits (employee education) II.4.4. Shared databases II.4.5. Informal knowledge and experience sharing by cluster members II.4.6. Technology transfer Area III. Cluster performance III.1. Human III.1.1. Increase in employment level in cluster entities over the last 2 years resources (% share) 42 development III.1.2. Number of intra-cluster training participants over the last two years (number) III.1.3. Number of shared training sessions organized in the cluster over the last two years (number) 38 Changed to R&D employment in the cluster core indicator with estimates allowed 39 Changed to Employees with university degree in cluster core indicator with estimates allowed with precision up to 10% 40 Changed to Share of membership fees in funds used for shared projects over the last two years (%) 41 The indicator was deleted from the list of studied indicators due to data collection problems 42 Changed to Increase in employment level in entities of the cluster core over last 2 years with estimates allowed
22 III.2. Improved competitive standing of the cluster III.3. Improved cluster innovation III.4. Internationalising III.1.4. Employees improving their professional qualifications over the last two years (% share) 43 III.2.1. Share of cluster products/services sold in domestic market (% share) 44 III.2.2. Share of cluster products/services sold in foreign market (% share) 45 III.2.3. Number of new members attracted to the cluster over the last two years (number) III.2.4. Start-ups 46 in the cluster (number) III.3.1. Employment increase (direct) in cluster s innovation activity (% share) 47 III.3.2. Number of innovations (e.g. new products, services, rationalization ideas, etc.) introduced in the last two years by cluster members (number) 48 III.3.3. Number of innovations covered by legal protection introduced in the cluster over the last 2 years (number) III.3.4. Share of R&D outlays in innovation expenses over the last two years (% share) 49 III.3.5. Number of shared projects performed (submitted) co-funded by EU over the last two years (number) III.3.6. Number of shared R&D international projects with external, non-eu funding performed over the last two years (number) III.4.1. Number of foreign markets where cluster members are present (number) III.4.2. Share of export in the sale of cluster s products (% share) 50 III.4.3. Number of formal cooperation agreements concluded with foreign entities (number) III.4.4. Participation in international fairs, exhibition and trade missions over the last two years (number) III.4.5. Number of foreign language publications (industry-specific materials, press) over the last 2 years Area IV. Cluster growth potential (for each sub-point, score from 0 to 10) IV.1. Regional IV.1.1. Business potential and tradition of local milieu conditions IV.1.2. Availability and mobility of highly qualified employees IV.1.3. Region attractiveness for investors (developed land, investment offers, municipal infrastructure) IV.1.4. Openness for cooperation between the entrepreneurs IV.1.5. Availability of natural resources (including raw materials) IV.2. Public policy supporting cluster development IV.2.1. Promotion of the cluster by public authorities IV.2.2. Public authorities financial support of cluster development IV.2.3. Training, education and organizational support IV.2.4. Impact of regional innovation policy on cluster (through RIS) IV.2.5. Cooperation with authorities (central and local ones) IV.2.6. Adjusting the education system to the needs of the cluster IV.3. Associated IV.3.1. Availability and quality of research for cluster purposes IV.3.2. Quality and availability of advisory, training and information services 43 Changed to Employees improving their qualifications over last two years in cluster core with estimates allowed 44 The indicator was deleted from the list of studied indicators due to data collection problems 45 Estimates allowed with precision up to 10% 46 These are new entities which started their business activity within the cluster as a result of the need and in view of the opportunity to carry out their own business activities, including the innovative ones. Start-up is a business undertaking built from a scratch (i.e. having no credit record). 47 The indicator was deleted from the list of studied indicators due to data collection problems 48 The indicator was deleted from the list of studied indicators due to data collection problems 49 Changed to Share of R&D expenses in innovation costs of cluster core over last two years with estimates allowed 50 Estimates allowed with precision up to 10%
23 institutions IV.4. Cluster leadership IV.3.3. Readiness and openness of business environment institutions and research institutions for cooperation IV.3.4. Technology transfer organization (domestic and abroad) IV.3.5. Availability of funds to support cluster development (e.g. loans, guarantees, venture capital, seed capital etc.) IV.3.6. Availability of market infrastructure (such as banks, leases etc.) IV.4.1. Strength and position of the cluster coordinator (among others, regarding motivating others to shared initiatives, implementation of shared vision and shared strategy) IV.4.2. Strength and position of other cluster members in shared activity of the cluster IV.4.3. Strength and position of the cluster relative to its environment (ability to obtain funds, lobby, create positive PR etc.) IV.4.4. Coordinator s skills regarding initiating of cooperation (both internal and external) Area V. Cluster strategy (for each sub-point, score from 0 to 10) V.1. Economies V.1.1. Ability to obtain funds for the cluster of scale V.1.2. Increasing the bargaining power in the relations with suppliers V.1.3. Coordinating the client market V.1.4. Lobbying ability (for the cluster or industry) V.1.5. Improved competitive advantage of the cluster V.2. Creating knowledge and innovation network V.3. Impact on business environment V.2.1. Increasing market research opportunities V.2.2. Developing competencies through lifelong learning (among others, training, studies etc.) V.2.3. Knowledge and innovation transfer through informal contacts V.2.4. Intra-cluster technology diffusion V.2.5. Cooperation on developing innovative solutions V.2.6. Determining shared technical standards V.3.1. Improved international competitiveness of the cluster V.3.2. Attracting new contractors (domestic and foreign) V.3.3. Attracting new talents (experts, specialists etc.) to the region V.3.4. Increased market importance of the cluster and the region V.3.5. Enhanced position of the cluster as a business partner (e.g. for authorities or associated institutions) The study uses both the quantity and the quality methods but for the sake of keeping the analysis clear, the methods were separated in particular areas of benchmarking 51. The quantitative analysis was used for the measurement of cluster resources and its performance, while the qualitative analysis was used for the evaluation of the processes taking place in the cluster, the growth potential and strategic orientation of clusters. The total of 85 indicators were established. The following research methods were applied in the study: questionnaire-based (standardized) interview, research based on documents (analysis of secondary sources), 51 Respondents presented qualitative data on processes taking place in the cluster, cluster s development potential and its strategy. In the case of the last two areas, information was supplemented with respondents rating from 0 to 10. In the case of cluster processes, pollsters assign scores on the basis of submitted data. The following scale was used for this purpose: 0 no activity; 1 activities are planned in this area; 2 activities are planned in this area (first steps have been taken); 3 joint activity involves a number of cluster members; 4 more than one joint activity involve a number of cluster members; 5 more than one joint activity involve over 50% of cluster members; 6 a lot of joint activities involve a number of cluster members; 7 more than one joint activity involve over 70% of cluster members; 8 one joint activity involves over 90% of cluster members; 9 a lot of joint activities involve over 90% of cluster members; 10 all possible joint activities are carried out and they involve all cluster members.
24 direct observation. 52 After conducting the interviews, pollsters jointly verified the collected data. Once the verification and completing of data was finished, the scaling (standardisation of data) and encoding was performed. Data gathered during questionnaire interviews, scaled and encoded, constituted the basis for further statistical analysis. The questionnaire comprised both quantitative and qualitative questions. Quantitative questions referred to such areas as: Cluster resources and Cluster performance. Obtained data was later transposed onto the 0-10 scale which made it possible to assess the benchmark value and the average value. The 0 value was given to answers in which the real numerical value of the indicator equalled 0 (e.g. lack of innovations covered by legal protection). The 10 value was given to answers of maximum or close to maximum values. The following formula was applied: where: Y - interval xmax maximum value of variable x xmin minimum value of variable x n=10 That is why, in the case of numerical data which was scaled, the maximum value for a single indicator always equals 10, because such score is given to at least maximum numerical value of a given indicator. In the case of qualitative questions, the score between 0 and 10 was indicated by the respondents or assigned by the pollsters on the basis of respondents answers. These questions were asked with relation to such areas as: Cluster processes, Growth potential and Cluster strategy. For each of the sub-areas, an average value of indicators (after scaling) was calculated for each of the clusters. The highest possible value became a benchmark for a given sub-area. Benchmarks for individual areas were calculated as an arithmetic mean of sub-areas benchmarks. The research did not use weights, each of the variables had the same rank. Best practices An important element in the cluster benchmarking was indicating the best practices in the key areas for clusters operation effectiveness. The term best practices is the derivative of benchmarking as a tool for organization management. Generally speaking, good practices can be defined as processes or methods which, if successfully implemented, lead to increased efficiency. Good practices are not new solutions; these are activities tested in practice, already applied in other organizations. Their application is aimed at improving organisation s performance and increasing its efficiency Benchmarking Klastrów, cz I. Opracowanie i opis metodyki benchmarkingu klastrów w Polsce, A. Nowakowska, Z. Przygodzki, M. Sokołowicz, J. Chądzyński, K. Matusiak, M. Klepka, Łódź K. B. Matusiak (red.), Innowacje i transfer technologii. Słownik pojęć, Polska Agencja Rozwoju Przedsiębiorczości, Warsaw 2008
25 According to the adopted methodology, good practices were identified in the following areas 54 : 1. Human resources development 2. Financing the operation of the cluster 3. Creation of cluster infrastructure 4. Market activity of the cluster 5. Marketing and PR 6. Communication (exchange of information) 7. Creation of knowledge and innovation in the cluster 8. Regional conditions for cluster growth 9. Public policy supporting cluster development 10. Associated institutions 11. Cluster leadership 12. Approach to strategic and developmental activities. 55 Selection of best practices was carried out in the following way: 56 Stage 1 - on the basis of information gathered during questionnaire interviews, 5 clusters which achieved the best quantitative results in each area qualified for describing the best practice were identified. Stage 2 - on the basis of observation and information gathered by pollsters in the pollster s questionnaire, clusters chosen in Stage 1 were verified. Stage 3 consultants assessed the chosen clusters together with the areas of good practices and made the final choice of best practices, subject to an in-depth analysis (case study). They were then accepted by the Ordering Party. The basic criteria applied in the selection of the best practices were 57 : Systemic nature and durability of solutions applied in the cluster Innovation (inventiveness) of the applied solution Effectiveness (efficiency) of the applied solution Possibility of applying (using) the solution in a different cluster Best practices which were possible to apply in individual clusters were included in the dedicated reports together with the description of implementation and expected benefits. 54 Benchmarking Klastrów, cz I. Opracowanie i opis metodyki benchmarkingu klastrów w Polsce, A. Nowakowska, Z. Przygodzki, M. Sokołowicz, J. Chądzyński, K. Matusiak, M. Klepka, Łódź New area was added: 12. Approach to strategic and developmental activities 56 In the course of the study, the area was additionally defined and included in the identification 57 Benchmarking Klastrów, cz I. Opracowanie i opis metodyki benchmarkingu klastrów w Polsce, A. Nowakowska, Z. Przygodzki, M. Sokołowicz, J. Chądzyński, K. Matusiak, M. Klepka, Łódź 2008
26 3.3. The scope of the project and contract implementation manner The project Cluster Benchmarking in Poland" was carried out in the course of 8 months - from 23 March 2010 to 23 November 2010 and involved comparative analysis of 47 clusters in Poland. It was part of a system project by Polish Agency for Enterprise Development (PAED): Developing human resources through knowledge promotion, innovation transfer and dissemination funded by European Social Fund under Human Capital Operational Programme (HC OP) Sub-measure The following entities cooperated in the course of project implementation: Polish Agency for Enterprise Development as Employer. The PAED s role involved preparation of the contract, selection of the Contractor, cooperation and assistance at each stage of project implementation, verification and approval of materials supplied and participation in working meetings. Consultants experts in cluster benchmarking methodology. The Consultant's role involved cooperation and technical assistance in the course of project implementation, reviewing and initial approval of supplied materials as well as participation in working meetings. Deloitte as the Contractor. Deloitte were responsible for contract implementation, cooperation with the Consultants and the Employer, providing work outcomes within the deadlines specified in the project schedule as well as organisation of and participation in working meetings. One of the first stages of the project was preparation of instructions for interviewers based on a scenario submitted by the Polish Agency for Enterprise Development. Since the beginning of project implementation, the Contractor started verifying a list of key clusters presented by PAED and a list of additional clusters identified based on different sources. An analysis of the list received revealed that some of the clusters no longer operated at the time or suspended their activity (the list was drawn up in 2008) whereas others did not agree to participate in the study or were merely a cluster-like initiative and did not meet the criteria of a cluster, as defined for the use of implementation of this project. In consequence, 22 clusters were selected for the research from the list submitted by PAED. At the subsequent stage, activities aimed at identifying the missing clusters were undertaken. In total, 178 entities were verified and these included both clusters and cluster-like initiatives. The final selection of clusters selected to take part in the research are listed below. Alternatywny Klaster Informatyczny Bałtycki Klaster Ekoenergetyczny Budownictwo Polski Centralnej Bydgoski Klaster Przemysłowy Gdański Klaster Budowlany
27 Innowacyjny Klaster Przemysłowy Stowarzyszenie Producentów Komponentów Odlewniczych "KOM-CAST" Izba Gospodarcza Grono Targowe Kielce" Klaster Budownictwa Energooszczędnego TERMOMAX Klaster Drzewno-Meblarski Klaster Kotlarski Klaster LifeScience Kraków Klaster Mazurskie Okna Klaster Medycyna Polska Południowy-Wschód Klaster Multimediów i Systemów Informacyjnych Klaster NUTRIBIOMED Klaster Poligraficzno - Reklamowy w Lesznie Klaster Poligraficzny Instytutu Transferu Technologii Poligraficznych Klaster Restauratorów i Hotelarzy Klaster Technologii Energooszczędnych Euro-Centrum Klaster Zielonych Technologii Lubelski Klaster Ekoenergetyczny Lubuski Klaster Metalowy Łódzki Klaster Medialny Łódzki Klaster Warzywno-Owocowy - Zjazdowa Małopolski Klaster Technologii Informacyjnych Małopolsko-Podkarpacki Klaster Czystej Energii Mazowiecki Klaster Druku i Reklamy KOLOROWA KOTLINA Mazowiecki Klaster Lotniczy Aviation Mazovia Mazowiecki Klaster Technologii Informacyjnych i Komunikacyjnych (ICT) Nadwiślański Klaster Energii Odnawialnej Opolski Klaster Turystyczny Kraina miodem i mlekiem płynąca" Optoklaster - Mazowiecki Klaster Innowacyjnych Technologii Fotonicznych Podlaski Klaster Bielizny Podlaski Klaster Obróbki Metali Pomorski Klaster BioEkoChemiczny Pomorski Klaster ICT Stowarzyszenie Grupy Przedsiębiorców Przemysłu Lotniczego DOLINA LOTNICZA Stowarzyszenie Lubelskie Drewno - Regionalny Klaster w Lublinie Stowarzyszenie Sieć Porozumienia Lotniczego AVIA SPLot Śląski Klaster Lotniczy Śląski Klaster Wodny Warmińsko-Mazurski Klaster "Razem Cieplej" Wielkopolski Klaster Energii Odnawialnej Wielkopolski Klaster Motoryzacyjny Wielkopolski Klaster Teleinformatyczny Wielkopolski Klaster Zaawansowanych Technik Automatyzacji ELPROTECH" Zachodniopomorski Klaster Chemiczny Zielona Chemia" In the first working meeting, organised by the Contractor following initial verification of 47 clusters, representatives of the Employer and Consultants participated alongside representatives of clusters potential survey respondents. The participants familiarised themselves with the object of the contract, the rudiments of benchmarking, methodology of
28 the research conducted and data analysis. Next the respondents went on to arrange meetings with representatives of different clusters. According to the procedure specified in the adopted methodology, and the Employer s decision, the interviews were conducted independently by two interviewers at the seats of two different entities within a given cluster. The interviewees of the questionnaire-based interview were, as a rule, two entities: the entity coordinating the cluster the entity which is the leader in the cluster, i.e. the entity actively involved in the cluster s operations, having a strong position in its structure. The data gathered during the interviews were transferred to an IT tool for data aggregation and subsequently verified by the interviewers. The data were completed based on the availability of information from such sources as: the clusters websites websites of entities within the clusters, news and publications databases i.e. ISI Emerging Markets, Factiva Search, enterprises financial databases - i.e. Bureau van Dijk's Amadeus, Monitor Polski B national and international statistical publications. Based on the aggregated data, a database including additional information was developed. This is where the questionnaire-based interview data was coded. In case of statistical indicators the respondents' answers gathered were transposed onto a 1-10 scale. What followed was establishment of benchmarks for 18 sub-areas based on maximum values of individual indicators and 5 benchmarks for core areas. Due to largely insufficient data, which might have impacted adversely the final benchmarking results, two clusters were excluded from benchmark calculation: Mazurskie Okna and Klaster Drzewno-Meblarski. Best practices selection was based on information collected during questionnaire-based interviews, during which 5 top-performing clusters were identified in each area and qualified for good practice description. In addition, selected clusters were assessed by the Consultants along with best practices. The next stage of the project consisted in result analysis using various methods. Based on this, general and detailed reports were prepared. The final version of the general report was subject to content and scientific review and this was done by the Reviewers selected by the Contractor.
29 4. General information concerning clusters in Poland This chapter presents background information on the studied clusters. This information was obtained by interviewers during interviews and is in addition to the indicators used directly in the benchmarking. The population surveyed includes clusters which differ considerably from one another in many respects, e.g.: geographical location of business age of cluster, size of cluster, economy sector in which the cluster operates, type of initiative that initiated the cluster, legal and organisational status of the cluster, objective of its operations and factors shaping its success. A cluster classification based on the above criteria is provided below. The clusters' analysis: regional distribution While identifying the location of clusters surveyed it is important to remember that this is not a complete list of clusters operating in Poland but only of those that agreed to participate in the research. The map below presents the regional distribution of clusters (broken down into voivodeships). The largest number of clusters surveyed are located in the Małopolskie voivodeship whereas the smallest number in the following voivodeships: Kujawsko-Pomorskie, Lubuskie, Opolskie, Świętokrzyskie, Warmińsko-Mazurskie (one cluster each). Clusters vary greatly between voivodeships. Few similarities can be identified for those which were surveyed. The following tendencies were noted: clusters located in the Mazowieckie Voivodeship are only entities of up to 30 participants, none of the clusters surveyed from the Śląskie Voivodeship received external funding in the last two years, the clusters surveyed from the Warmińsko-Mazurskie Voivodeship were only clusters operating in low-innovation industries and these clusters received significant external funding, all clusters surveyed in the Zachodniopomorskie Voivodeship received external funding of more than PLN 2 million in the last two years.

30 Map 1. Clusters participating in the research by voivodeships * For clusters operating in more than one voivodeship, the voivodeship with the coordinator's seat was selected Age of cluster Chart 1: Age of cluster The chart above presents the surveyed clusters year of establishment. Only one cluster Łódzki Rynek Hurtowy "Zjazdowa" S.A. was established (as a bottom-up initiative) before The remaining ones have been created in the last few years. It can be clearly seen that
31 the majority of surveyed clusters were established in (47% of the clusters surveyed were established in 2007 and 26% a year later). This may be related to a pilot programme implemented by PAED in 2007: "Support for cluster development, funding opportunities for clusters under the Integrated Regional Operational Programme, Measure 2.6 Regional innovation strategies and transfer of knowledge, as well as availability of structural funds under the Innovative Economy Operational Programme, Measure 5.1 Support for cooperative connections of supra-regional importance. By 2007 only 13 clusters were established from the investigated group. It is worth emphasising that average age of a cluster participating in the research is not much more than 3 years. This has an enormous impact on the research findings as some of the areas which are very well developed in foreign clusters (e.g. cooperation with R&D units) are still in their phase of incubation. Two of the clusters surveyed (Nadwiślański Klaster Energii Odnawialnej and Wielkopolski Klaster Energii Odnawialnej) were established in Even the clusters which are as young as this undertake active cooperation and seek synergy effects 58 for their members. Cluster initiator There may be various ways in which clusters were established. Possible initiators include the public sector, private sector, NGO and R&D. Out of 47 surveyed entities, as many as 40% were initiated by private businesses. Business environment organisations such as: regional development agencies, associations, funds and other institutions were also active. Almost just as frequently, clusters were established as an initiative of the science sector and R&D units. In both cases it was more than 20% as compared to all entities surveyed. The public sector plays the least part, as only in 6 cases such institutions as: County Office, Poviat Starosty or Marshal's Office were the initiators. According to published sources, the origin of creation of a cluster in Poland usually falls into one of three models: The Danish model the state is actively involved and the cluster is established by a "network broker located in a business support institution, The Italian model the cluster has no formal structure and is usually initiated by companies from a given sector; the relationships are close and local identity plays a vital role, The Dutch model the state is actively involved and there is an emphasis on innovation with a significant part being played by scientific centres. 58 This relates to achieving multiple benefits owing to skilfull combination of different parts into a whole. In this case it means achieving multiple benefits owing to joint efforts made by different enterprises.
 initiatives - when the cluster was established independently, out of")
32 Chart 2 Cluster initiator Type of initiative One may easily notice a close relationship between cluster initiator and the manner in which the cluster was established (type of initiative). The research participants were requested to indicate the relevant type of initiative from a list covering: bottom-up (autonomous) initiatives - when the cluster was established independently, out of own initiative of companies or natural persons; top-down initiatives when the entity encouraging the cluster establishment was an organisation outside the enterprise sector, i.e. a non-profit institution or public sector; mixed initiatives when the cluster was established as a result of an agreement between enterprises and representatives of non-business institutions Out of all clusters surveyed, 17 were established as a result of activities undertaken by companies and this amounts to 36% of the respondents. The remaining 64% may be almost evenly split between the top-down and mixed initiatives. The top-down initiative was undertaken by universities, Marshal Offices, chambers of crafts and municipalities. As many as 30 clusters from the group surveyed were created as a result of activity of organisations other than enterprises. This shows difficulties in terms of establishing permanent cooperation between the entrepreneurs. This may be due to lack of trust between entrepreneurs and even difficulties in establishing expected outcomes of cluster s operations. Cooperation based on trust between enterprises is still not very common in Poland.
.")
33 However, a relatively large number of clusters established as a result of a top-down initiative would suggest that the policy of supporting cluster development is successful (a successful transformation of a cluster initiative into a cluster). 14 clusters were established as a mixed initiative a common action undertaken by entrepreneurs and local government units and/or R&D units or NGOs. Chart 3 Type of initiative In the case of clusters established by entrepreneurs without co-participation of other organisations more than a half has not received any external support in the last two years. As regards clusters established as a top-down initiative, 81% of these received funding (of which 50% were granted more than PLN 1 million). In most voivodeships the surveyed clusters were established as part of various initiatives. It should be noted that clusters established as a bottom-up initiative only are located in the Lubuskie Voivodeship (1 cluster) and the Podkarpackie Voivodeship (3 clusters) and these testify to the high performance of entrepreneurs operating there. Clusters established as a result of a top-down initiative are located in the Świętokrzyskie Voivodeship (1 cluster) and Zachodniopomorskie (2 clusters). A relatively large number of clusters established as a topdown initiative are also present in the Mazowieckie Voivodeship (3 clusters) and the Pomorskie Voivodeship (3 clusters). In case of voivodeships in which clusters were established as a top-down initiative only, the reason for this could be active cluster development policy implemented by public authorities in these regions. Another reason for this could be that enterprises see no added value in cooperation and it is only the actions undertaken by the authorities or other organisations (frequently related with funding support for cluster development) that give rise to the establishment of new clusters.
34 Table 3 Types of cluster initiatives by voivodeship. Organisational and legal forms Chart 4 illustrates different organisational and legal forms that clusters adopt in order to perform their operations. Out of 47 clusters surveyed 43% operate as associations. 11% of clusters surveyed signed consortium agreements. Only one joint-stock company, one limited liability company and one foundation were identified these forms represent 6% of all the clusters investigated. 40% of entities operate based on other contract types: agreement is one of the most frequently mentioned ones and was signed by 13 clusters. Other clusters operate: as a federation (1 cluster) as a partnership (1 cluster) based on a cooperation agreement (2 clusters) as chambers of commerce (1 cluster) Polish cluster experience shows that cluster structure members have insufficient knowledge of different legal and organisational forms and the benefits of adopting these. During the interviews, the respondents were frequently interested in legal forms adopted by the clusters surveyed. This shows a lack of adequate support and consulting for clusters in this respect. Doubts were also raised as to limitations resulting from choosing association as an organisational and legal form to operate as a cluster. Association members are natural persons rather than organisational units and this might make cooperation more difficult. For instance, where the company owner changes, the new owner does not automatically become a cluster member, which in fact results in the enterprise being excluded from the cluster s operations. In addition, such a legal form impedes the cluster s profit-making activity and makes it impossible to transfer the potential monies earned by it to association members.

35 The clusters expressed interest in other organisational and legal forms which would be free from the limitations described above. Many clusters are contemplating the possibility of creating a special purpose vehicle which would make it possible to conduct profit-making activity, which is particularly important when, for instance, a joint product is being developed. Chart 4. Organisational and legal form of cluster Cluster participant types Businesses represent nearly 79% of cluster participants. The remaining 21% are business environment institutions called support institutions (e.g. industry associations, chambers of commerce, Centre for Innovation and Transfer of Technology, non-profit consulting institutions, agencies for ownership transformations or restructuring agencies) and the R&D sector and other entities. R&D institutions (universities, polytechnics, science and technology parks and science institutes) represent 8% of all entities cluster members. Only 117 organisations were classified as other (the least number of cluster participants) and these were self-government authorities (the number of enterprises being 1469). According to a definition by M.Porter, clusters are a geographic concentration of businesses and institutions. Interestingly, out of 47 clusters surveyed, 5 have business members only. This is not to suggest that cooperation with R&D institutions or the NGO sector is absent. This cooperation is indeed present but R&D institutions or NGOs are cluster partners and are not directly involved in a formalised network.
36 Chart 5. Type of cluster participants Business size in a cluster Chart 6. Structure of employment in a cluster according to employment size The above chart presents the size of enterprise which are part of the clusters surveyed. The largest group (43%) are microenterprises employing up to 9 people. In terms of size, the second largest group is medium enterprises representing 29% of the respondents. The
37 remaining group (27%) are small and large enterprises. However, large enterprises are the least represented (10%). Only one cluster consists of microenterprises only. In the other clusters at least several members employ more than 10 people. The research also involved one cluster in which large enterprises were dominant. The structure of clusters in which microenterprises are dominant is not without any consequences. On the one hand, the dominance of microenterprises may impede cooperation due to low confidence in or awareness of benefits that such a membership may bring. On the other hand, representatives of microenterprises in clusters (usually company owners) know their industry very well as well as the scope of activity of the companies which they represent. Cluster development phase The literature indicates three cluster development phases 59 : phase of incubation/embryonic - occurs when a dozen or so players begin to cooperate in the primary sector, around which cooperative ties are organized, thereby implementing the common objectives, The phase of growth / maturity the phase of growth is characterized by the attraction of new enterprises to the cluster, including the entities from related and supporting industries. In the maturity phase the cluster reaches a critical mass of development the large number of participating companies, cluster has strong ties to external entities, there are new companies created (spin-offs), and the member companies merge and convert, phase of decline / transformation in the decline phase of the cluster there is a reduction of the relationships between the participants, as well as the loss of competitiveness, such as the effect of aging of the industry, around which the cluster was organized. Phase of transformation concerns clusters that have the ability to adapt to the changing environment (change of market, technology, etc.) and that can avert a crisis by transforming the structures and relationships between participants in the cluster. 59 Benchmarking Klastrów, cz I. Opracowanie i opis metodyki benchmarkingu klastrów w Polsce [Cluster benchmarking in Poland, part 1, Developing and describing a cluster benchmarking methodology in Poland] A. Nowakowska, Z. Przygodzki, M. Sokołowicz, J. Chądzyński, K. Matusiak, M. Klepka, Łódź 2008
.")
38 Chart 7. Phase of cluster development The majority of entities (25, i.e. 53% of respondents) are at the beginning of their development path and refer to their development stage as embryonic. On the other hand 47% of clusters were classified as being at the phase of growth. None of the clusters surveyed is in the final development phase (phase of decline/phase of transformation). The respondents who described their clusters as clusters in the phase of decline, whose average life span is 3 years. For clusters in the phase of growth, average life span is 4 years. The oldest cluster whose representatives described its development stage as embryonic, has been in existence for 6 years and the youngest one in the phase of growth - for 2 years. Such substantial differences stem from many factors - e.g. the clusters development potential, support for particular clusters (especially of the financial kind), cluster members' activity or that of the coordinator. Industries in which clusters operate The surveyed clusters represent various industries, and there are several cross-industrial ones. Most of them belong to the IT sector, with a large number representing aviation, construction and eco-energy. Below clusters are listed by industry.

39 Table 4. Clusters surveyed by industry Many clusters represent traditional industries, such as metallurgy, foundry or coppersmithing. Also, a number of clusters belong to the high-tech or knowledge-intensive services sectors, such as aviation, telco, biotechnology or optics. Innovation level of clusters Clusters may also be categorised based on innovation level of their sectors, measured as R&D intensity per industry, in accordance with the OECD classification. In OECD classification, assignment to a given group depends on whether or not it is a production or services sector. The main factor when classifying a given industry into a particular class is employment in R&D. In the above mentioned classification industrial sectors are categorised into the following classes: 60 low technology, medium-low technology, 60 Statistics in Focus, Theme 9 Science and Technology", 10/2004, Eurostat 2004
40 medium-high technology, high technology, For the purpose of this report, these classes were used to create groups which stand for a given level of innovation in a particular industry sector. Class 1 sectors correspond to low innovation groups, class 2 refers to medium innovation level and classes 3 and 4 to high innovation levels. In the OECD KIS (knowledge-intensive services) classification, services sectors were assigned to the following classes 61 : knowledge-intensive services (including high tech and other knowledge-intensive), other services (less-knowledge intensive services), other services sectors Each cluster investigated was assigned to one of the categories below: Clusters operating in high innovation industries (clusters operating in the medium high and high technology group - for production clusters and knowledge-intensive services): the population surveyed includes 15 clusters of this kind. Clusters operating in medium innovation industries (clusters operating in the medium low technology group - for production clusters and less knowledge-intensive services): the population surveyed includes 19 clusters of this kind. Clusters operating in low innovation industries (clusters operating in low technology industries for production clusters or other services): the population surveyed includes 13 clusters of this kind. Cluster strategies The majority of clusters surveyed (89%) has a development strategy. It is not always, however, a formal strategy. It should be noted here that although 33% of clusters with a strategy defined the aims, mission and development trends, they did not make any formal arrangements in the form of an official document. This is certainly connected with the early development stage of a cluster. As mentioned before, 53% of the entities surveyed are still in the phase of incubation, i.e. establishing cooperation, relationship shaping in core activity industry. Almost a half of clusters in this phase have a formal cluster development strategy. However, many clusters began their operations from an analysis of development potential and preparation of a strategy indicating its development trends. This may be due to an increased awareness of business entities in terms of the need and necessity of preparing strategic documents and long-term planning of own activities. The strategies adopted by clusters often define their missions, the cluster s distinctive features that manifest its individuality. This is how strategies contribute to building cluster identity. The following was usually mentioned as the cluster's mission: enabling cooperation between business and science, 61 Statistics in Focus, Theme 9 Science and Technology", 10/2004, Eurostat 2004

41 ability of cluster members to compete with international enterprises and increasing domestic market share, innovation development, creating optimum enterprise development conditions within the cluster, creating adequate conditions for transfer of knowledge, building a common brand that would enable launching technology and products to a wide market. Chart 8. Cluster strategy Cluster operations objectives During the interview additional information on objectives and rationale for cluster membership emerged. Below is a summary of the most frequently mentioned aims of cluster operations. It should be emphasised that some clusters were concentrated on achieving one aim whereas others were focused on achieving many aims simultaneously. The most frequently cited aim of cluster operations is industry promotion and development. The clusters usually operate in one, precisely defined industry and less frequently in related industries. The latter situation usually occurs in ecoenergy clusters dealing with energy produced using different sources: wind, water, biomass, etc. For clusters it is very important to be able to win new projects using the funds intended for their development and by cooperating with other entities in the cluster (e.g. by offering a joint service). Sharing knowledge and experience is an equally important aim of one s activity, especially in the context of cooperation between R&D units and enterprises. When a company is part of a cluster, it is much easier for it to establish cooperation with universities and attempt to implement projects developed there. Another important reason for establishing a cluster is promotion and development of cluster companies. For instance during meetings with representatives of several clusters, the possibility of participating in fairs or business missions
42 was raised, which is a direct result of being a cluster member. Many enterprises, especially of the micro kind, would not be able to bear the costs of fairs or business trips, which are intended to expand one s industrial knowledge, enable one to gain new experiences and provide an opportunity for gaining trading partners. Chart 9. Objectives of cluster operations * The Education objective means aiming at human resources development and that of future cluster personnel Region promotion and development are also an important aim of a cluster s activity. This objective is characteristic for clusters which are regionally-rooted to a considerable extent, and also those which are located in poorly developed regions. The cluster s activity may therefore also be aimed at supporting its members and regional development. Other aims that were mentioned included joint work on technology, a product or service. This is related to taking advantage of the benefits of economies of scale, as this enables cooperating entities to offer a new product or service cheaper/quicker/more effectively. In some cases it s the only possibility of introducing modern products to the offer of enterprises which are cluster members. Joint work on technology and technology transfer is also important. This may happen between companies cluster members but primarily it concerns cooperation with universities. Being part of a cluster facilitates cooperation with universities, enables one to use their experience, research or even laboratories. Another aim may be education - support for cluster member personnel (e.g. increased training opportunities) or education of external environment by a cluster, for example through promotion of technical education. The above tasks are carried out using different methods and their impact on benchmarking results is huge. It should be noted that two of the clusters surveyed are commercial law companies, and therefore their operations are aimed at profit-making. The reason why the companies where

43 established was to win more project opportunities a cluster acting as one company may generate profit distributed among company shareholders. Chart 10. Cluster success factors Chart 10 presents all the factors that influenced the current situation of clusters on the market and had an impact on its achievements. The research has revealed advantages of supporting clusters by large companies, local authorities and science and research centres. It was one of the main success factors and 18% of the respondents mentioned it. Willingness to cooperate, openness, tradition, good location, human capital potential these are other important factors mentioned, each of which was pointed at by 11% of respondents. The research participants stressed how important it was for the coordinator to be an authority and be experienced and they emphasised the importance of relevant qualifications of cluster members. This factor constituted 9% of all the factors identified. Other factors include geographical concentration, informal business relationships, experience and trust gained in earlier projects, shared plans and operation areas, diversified members and activities, adaptation abilities of companies, information flow between members, participation in industry fairs, awareness of the necessity of change. Survey respondents The research also covered aspects of access to labour market in entities which are cluster members for persons of different sex. The respondents showed that they are aware of the need of equal opportunities for men and women in labour market in their cluster and its entities. This, however, depends on the industry in which the clusters operate. In professions related to IT, aviation, energy, construction and in wood /furniture or metallurgical industry, women are less frequently employed than men.

44 Chart 11. Participation of women and men in the survey Among the respondents that were interviewed, there were 21 women and 73 men. The larger proportion of men is due to the fact that fewer women perform the role of cluster coordinator or leader. Among the coordinators and leaders women represented 26% and 19% respectively.
45 5. Introduction to benchmark analysis In line with the methodology adopted, benchmark analysis of clusters in Poland covers 5 areas: cluster resources, in-cluster processes, cluster performances, cluster growth potential and cluster strategy. Each area is divided into sub-areas, which are defined by specific indicators. While spider charts for specific areas present benchmark results and the average result curve, during analysis of subareas they illustrate the average result curve and the highest indicator value in a given subarea. This makes it possible to refer the best results which are a benchmark or the highest value of an individual indicator to the average obtained by all the clusters surveyed. The benchmarking results cover data obtained from 45 clusters at all area and subarea levels. Results from two clusters were not included in the benchmark analysis due to numerous deficiencies in benchmarking indicators. Cross-section analysis The general information regarding clusters in Poland as presented above shows their strong differentiation. Therefore, subsequent sections of the report devoted to individual areas and sub-areas are presented as cross-sections, with reference to several criteria at once. Below there is information regarding the criteria used and the number of clusters in each group. The cross-sections used allow us to evaluate the impact of external funding received by a cluster on cluster processes and performance. Including innovation level in a given cluster industry makes it possible to see differences between clusters surveyed, especially in relation to areas connected by innovation. This allows us to see in which areas the difference between clusters operating in traditional and high tech is the largest. The data in the cross section make it possible for us, for instance, to answer the question of how cluster size impacts on internal cluster communication. Table 5. Clusters used for analysis along with the number of clusters in particular groups

46 According to the data collected in the course of interviews, more than 44% of clusters have not received any external funding in the last two years. The largest number of clusters received funds of PLN 1 million, 13 clusters having received more than PLN 1 million. External funding intended for cluster development in the last 2 years ranged from PLN 102,000 to PLN 17 million. Innovation level in a cluster is measured by means of "R&D intensity" (knowledge intensity) in a given production or services sector, according to OECD classification. 13 clusters operate in industries classified as low-innovation ones. These are clusters representing traditional branches of industry and services (construction, energy, gas and water production and distribution, clothes production and wholesale). 19 clusters are present in industries representing average innovation level. These include clusters dealing with traditional branches of industry, renewable energy or tourist services. Almost 32% of clusters operate in high innovation sectors: multimedia, IT, optics, aviation, pharmacy and chemistry. The clusters were also subject to size cross section analysis, measured using the number of entities in a cluster, both enterprises as well as R&D units, NGOs and other. The majority of clusters surveyed are small clusters of up to 30 members. 30% of clusters surveyed have between 31 and 60 members and only 11 clusters more than 60 members. Each of the above cross sections is accompanied by aggregated benchmarking results at the level of areas and subareas. Attention should however be drawn to the fact that the results presented are not the actual benchmark analysis, because such analysis requires specific, individualised points of reference (data of specific clusters) and it was included in dedicated reports. Presentation of best practices An important element of cluster benchmarking is also indicating best practices in the areas which impact on their efficiency. In line with the methodology, best practices were identified in 12 areas. Next based on four criteria (systemic character and durability of solutions, innovation, efficiency and ability to implement the solution by another cluster) best practices were selected and these were presented in the present report.

47 6. Cluster resources The first presented area of benchmarking analysis are cluster resources. Traditional resources are considered to be one of the basic elements which determine the ability of an organisation to build competitive potential. The analysed area directly influences the implementation effectiveness of processes and the efficiency of generating cluster results. The area of cluster resources consists of the following sub-areas: Human resources and know how of the cluster Financial resources of the cluster Infrastructure resources The summary of benchmark value and average values for the area Cluster resources which were achieved by 45 clusters included in the analysis is presented below. Chart 12. Average values and benchmark values for the area Cluster resources Human resources and know how of the cluster Average Infrastructure resources of the cluster Financial resources of the cluster Benchmark value for the area Cluster resources Average value for the area Cluster resources The analysis of the above results shows considerable discrepancies between the analysed clusters in the field of resources. The average score in each case is considerably different from benchmark value. It is most noticeable in the sub-area of financial resources of the clusters, which shows great variation in access to financial resources. Some of the clusters have acquired several million of projects co-financing from external sources and at the same time they have additional financial resources from membership fees. Other clusters do not have financial resources, neither from inside resources nor outside resources, and function due to social work of a coordinator and other people. In accordance with information provided by the respondents, problems with financing of the clusters activities are one of the main
48 factors limiting their development. Lack of financial resources in the case of some of the clusters can lead to a considerable decrease or discontinuation of the cluster's activities. The lowest benchmark value is in the sub-area of infrastructure resources. Only small number of clusters have laboratory area at their disposal or make use of an internal network. This indicates the initial stage of cluster development in Poland. Cooperation with research and development units, which usually provides laboratory area for the clusters, has just started. Some of the discussed clusters do not carry out such cooperation at all or carry it out to a very limited degree. The laboratory infrastructure belongs to enterprises only in the minority of cases. In this context, increasing the use of laboratory area requires better cooperation with research and development units. The results show small popularity of Intranet as a form of communication and exchange of knowledge in the cluster. It can be caused by three factors: other forms of communication ( , telephone) are much more popular, and communication relates primarily to current activities, and not to the transfer of knowledge, which would require using a common platform, cluster members are not aware of the possibility of using the internal network, and can often be reluctant to share knowledge due to low level of trust, clusters do not have appropriate financial resources for the construction of internal network. The highest average indicator value among the discussed sub-areas is for the human resources and know how of the clusters. It is the result of high average values for the indicator Percentage of employed with higher education in the core of the cluster. The level of education is high in many analysed clusters. It should be remembered at the same time that in accordance with the assignments to appropriate groups in the cross-sectional analysis, as many as 15 cluster industries fall into a highly innovative group, where higher education is a standard. People who carry out research and development activities are a small part of human resources of the clusters. This points to the concentration of cluster members mainly on production and providing services, and not on developing new solutions. The obtained results show that clusters in Poland do not have considerable resources at their disposal (clusters have few members and/or enterprises which function within their framework employ few employees). Not high (not higher than 7 out of 10) benchmark values show that even model clusters do not have considerable amount of resources at their disposal. It can have an influence on the processes carried out in the clusters as well on the results. Not enough resources can limit the activities implemented in the clusters. The results point mainly to the possible difficulties in taking up actions connected with research and development in this respect. Clusters which operate in more innovative industries (medium or highly innovative) have greater resources at their disposal than clusters operating in traditional industries. They also have access to bigger laboratory area, and have better qualified human resources at their disposal.
 The number of entities which participate in the cluster (enterprises, R&D sector, support institutions) The number")
49 6.1. Human resources and know how of the cluster Sub-area Human resources and know how of the cluster involves the following indicators: Total employment in entities functioning in the cluster The number of people administering the cluster (administrative service of the cluster) The number of entities which participate in the cluster (enterprises, R&D sector, support institutions) The number of employed in R&D activity in the core of the cluster Percentage of employed with higher education in the core of the cluster (with an accuracy of 10%) The number of jointly implemented projects in the cluster in the period of the last 2 years. The summary of the results for the discussed sub-area is presented below. Chart 13. The average value and the highest indicator value within the framework of the sub-area Human resources and know how of the cluster Total employment in entities functioning in the cluster The average indicator value The highest indicator value Number of jointly implemented projects in the cluster in the last 2 years Number of people administering the cluster (cluster administration service) Percentage of employed with higher education in the core of the cluster (with 10% accuracy of Number of entities participating in the cluster (enterprises, R&D sector, support institutions) Number of employed in R&D activity in the core of the cluster Benchmark value for sub-area Human resources and know how of the cluster Average value for sub-area Human resources and know how of the cluster

50 It is worth noting that in human resources, which are at clusters disposal, there is high percentage of employees with higher education in the core of the cluster. Clusters achieved low indicator values for total employment in entities functioning in the cluster, the number of people operating the cluster, the number of people employed in research and development activity in the core of the cluster and jointly implemented projects in the cluster. The highest registered number of cluster members is 122 entities, and the average is slightly over 42 entities. The results for individual indicators are presented below. Total employment The clusters in Poland are characterised by considerable diversity regarding the number of employed, which results from the initial characteristics of companies creating them. Total employment ranges from several dozen of people (Regional Cluster in Lublin - Stowarzyszenie Lubelskie Drewno (Lubelskie Wood Association)) to over 70 thousand (Małopolsko- Podkarpacki Klaster Czystej Energii (Małopolsko-Podkarpacki Clean Energy Cluster)). Total employment in the majority of clusters is not higher than 1,000 people. There are 8 smallest clusters, with the employment of up to 200 people. The biggest group (almost 45%) is clusters where the number of employed ranges from 1 thousand to 10 thousand people. More than 10 thousand people are employed (in enterprises and organisations operating in the network) in only 5 clusters. The biggest in this category is Małopolski Klaster Technologii Informacyjnych (Małopolski Cluster of Information Technology) (approx. 23 thousand of employed), Cluster LifeScience in Kraków (approx. 35 thousand of employed) and already mentioned Małopolsko-Podkarpacki Klaster Czystej Energii (Małopolsko-Podkarpacki Clean Energy Cluster) (approx. 70 thousand of employees). Chart 14. Total employment Number of the clusters 0-1,000 people 1,001-5,000 people 5,001-10,000 people >10,000 people Total employment Administrative service of the cluster The number of people who carry out administrative services in individual clusters is between 1 and 40 people. It should be noted, however, that the work of the majority of people servicing
51 Number of clusters clusters, inter alia, supervising administrative issues, is unpaid. If the cluster s coordinator is a foundation or an association (which business activity is much broader than cluster coordination), it is often the case that the work for the cluster of people employed in a particular foundation or association is unpaid. Chart 15. The number of people servicing the cluster (administrative service) Number of people servicing the cluster Such a situation is caused by the necessity to limit costs connected with the cluster s administrative service due to the lack of possibility of financing such a post from external sources. Clusters pointed to the limitation of the possibility of financing costs connected with administrative service and the office as the factor which limits their development. The minority of clusters have coordinators, who can fully engage in the implementation of tasks connected with servicing the cluster. This results from the lack of financial resources for covering costs of a coordinator s activity. This issue is especially harmful for clusters which are in the initial stage of development. Time and financial limitations influence the lack of possibility of a coordinator s full engagement in activities taken for the cluster and of using many development chances. Number of entities participating in the cluster (enterprises, R&D sector, support institutions) A detailed characteristic of the number of entities participating in the cluster (enterprises, R&D sector, support institutions) was presented in chapter four of the report in chart No 5. From the information obtained during interviews it seems that in the case of many clusters there is no active cooperation between enterprises and scientific units, despite the fact that officially research and development institutions are members of the cluster. There are several reasons for such a situation. The first is that including a research and development unit in the structure of the cluster was only in order to apply for EU funds (presence of a research and development unit often determines the possibility of applying for EU funds). There are also situations in which, in spite of the existence of a formal partner at R&D sector s side, clusters
52 representatives do not have any ideas for an effective cooperation. Another reason is lack of funds for carrying out such activities (not all of the clusters manage to achieve external financing for this). The clusters representatives pointed also to low motivation of the science sector for creating innovative solutions, which is the result of achieving scientific degrees - the number of issued publications is more important than the implementation of a technologically new product/process. Lack of active cooperation between the research and development sector and the business sector has a negative impact on the number of implemented organisational, marketing or product innovations by Polish clusters. It was presented in detail in sub-area Improvement of cluster innovativeness. Employment in the research and development activity Research and development institutions are the members of almost all analysed clusters. The scale of this presence highly depends on the industry in which a particular cluster operates (more/less innovative industries) and on the character of a cluster s activity (e.g. the aim of the activity can be technology transfer or works on a new product, service or technology). In the case of some industries, such as biotechnology, pharmacy, chemistry or medicine, works on the joint technology are often the most important aim of development. On the other hand, if clusters which operate in traditional industries, that have lower innovation potential, want to have new technology, they decide to buy it. In such cases and in the case of production clusters, the purchase of technology is justified economically. The role of the university and scientific entities in the clusters operation is also worth mentioning. The cooperation with some of them mainly consists in training future personnel or the possibility of having an internship in the cluster s companies, not always on trying to implement in business theoretical solutions developed at universities. In the case of clusters which operate in industries of low innovativeness, the number of employed in the research and development activity is maximum about 70 people, and in clusters operating in highly innovative industries this number fluctuates between 0 (one cluster from this group) and over 2000 employees. The clusters employ approximately 217 people in the research and development activity. Such activity is not carried out in 6 out of 45 clusters. Chart 16. Employment in the research and development activity in the clusters


53 Does not carry out R&D activity people people people people people The best practices connected with the promotion of the cluster s operation sector on the labour market, especially with the promotion of technical education among teenagers, are presented below. Best practice 1. Promotion of the cluster s operation sector on the labour market Lubuski Klaster Metalowy (Lubuski Metal Cluster) Podlaski Metalworking Cluster Lubuski Klaster Metalowy (Lubuski Metal Cluster) obtained the results of the analysis carried out in Germany in 2009 concerning the industry s needs in the field of future availability of professionals and people educated in a particular field. The results of the analysis foresee a considerable deficit of experts from metal industry in the next 5 years. With the aim to secure its industry in the region against the maladjusted structure of graduates education, the cluster took actions directed at promoting employment in metal industry. Lubuski Klaster Metalowy proposed and supports education in the field of exact sciences promotion and development of practical abilities on technical studies at universities functioning in the region. Entrepreneurs are engaged in conducting lectures on the scope of works and the possibility of developing professional careers in technical industries. Moreover, the cluster develops marketing supplies in the form of leaflets which present advantages of employment in metal industry and promote the attractiveness of this type of professions. Podlaski Metalworking Cluster prepared an advertisement film played in lower secondary schools, which shows the possibilities and advantages resulting from working in metallurgy industry. The film aims at increasing the prestige of the industry and the profession, as well as attracting new employees to vocational schools.
54 Association of Entrepreneurs of Aviation Industry Aviation Valley Wood and Furniture Cluster Aviation Valley has carried out activities which promote the aviation sector in the labour market for 6 years. They include mainly placing billboards at universities and broadcasting of a television advertisement in a regional television in order to encourage studying technical faculties. Such activities are to ensure the cluster the access to educated personnel in the future. Wood and Furniture Cluster functions actively in the promotion of technical education in wood industry and related industries in the region. The activities include the organisation of internship in the cluster s member companies, which give the possibility of training future personnel. The cluster also organises, every six months, workshops in wood industry and supports various initiatives connected with its promotion (e.g. promotion of carpenter s competitions organised by Salezjanie Association Schools which cooperate with the cluster). The cluster participates in technology fairs Wszystko dla domu ( Everything for home ), where, apart from companies operating in wide wood and furniture industry, they present also entities connected with design. The cluster cooperates in this area with Koszalin University of Technology mainly with Design Department and the Academy of Fine Arts, the students of which have the possibility to present their projects and cooperate with the cluster s companies. Effect: Ensuring the inflow of appropriate specialists to the companies functioning within the framework of the clusters in the long-term perspective. Employed people with higher education Among the employed in the companies functioning in more than half of 45 clusters, the percentage of people with higher education exceeds 40%. In the next 10 clusters, this indicator ranges from 41 to 80%. It is worth noticing than in the case of the remaining 13 clusters, the percentage of employees with higher education, which are employed in the companies functioning in the cluster, is approx. 90%. As far as the employment in the cluster s entities is concerned, it is worth highlighting that there is a big correlation between the percentage of employed with higher education and the industry in which the cluster operates. During the interviews the respondents were complaining about the existence of a huge gap in possessed abilities among people with secondary education, mainly technical and vocational. The cross-sectional analysis confirms that in clusters operating in more innovative industries comparatively more employed people have higher education. Chart 17. Percentage of employed with higher education
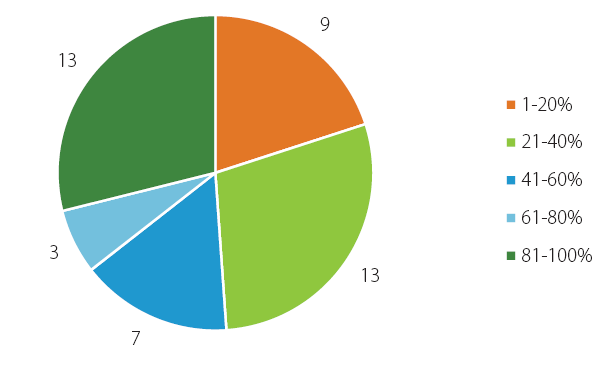
55

56 Jointly implemented projects in the clusters In the last 2 years, over 82% of 45 clusters have jointly implemented at least one project. No joint undertaking was implemented in as many as 8 clusters. More than half of the clusters implemented jointly 1 or 2 cluster projects in the last 24 months. In the next 7 clusters this number ranges from 3 to 6, and in the next 5 clusters from 7 to 10 undertakings. One cluster implemented jointly over 10 projects in the last 2 years. The implemented projects concerned many areas of the clusters activities from expanding knowledge, participation in trainings and fairs, to developing new technology solutions. This shows that there are not many activities which involve all entities in the cluster. What should be questioned here is the stability of functioning of these clusters which have not implemented any joint projects in the last two years. There are also doubts whether these structures are actually clusters. There is a visible correlation between the number of entities in the cluster and the number of jointly implemented projects the more entities there are, the more joint projects were implemented by the cluster. This can result from more initiatives from the cluster members if there are more entities, there is a greater possibility of initiatives from the cluster members. Chart 18. The number of jointly implemented projects in the clusters in the last 2 years Summary Summing up: in the area of human resources in the cluster, the average of score calculated from six discussed indicators is The cluster with the highest result achieved in this area the result of Human resources of the clusters, in the majority of cases, are scarce. The clusters gather approximately 42 entities, which approximately employ 5,800 employees. A big part of the cluster s members are micro and small enterprises, what has an impact on low results
57 achieved in the area of human resources. Small number of people employed in the clusters is responsible for research and development - approximately 5% of the cluster's employees. This activity is carried out by more than 20% of employees in four clusters. These are clusters functioning in the industries of a medium or high level of innovativeness. There are also considerable discrepancies in the field of human resources among individual clusters. Both, the entities with a dozen or so members and those with more than a hundred members, were analysed. A considerable part of employees of entities which are the core of the cluster have higher education, which is almost 50% of employees in each cluster. It is a very high result compared to the average in Poland only 18.1% of people between 15 and 64 years of age have higher education 62. This shows a very big potential connected with the education of the cluster s employees. The results achieved by the clusters show that the amount of obtained internal resources does not translate directly to the results concerning human resources and know how. The level of the cluster's industry innovativeness has greater impact. This influences directly the number of employed in the research and development activity and the percentage of employed with higher education in the cluster s companies. The size of the cluster has a considerable impact on the results concerning human resources and know how. If the cluster is bigger, the score in the field of human resources is higher. Not high scores in the field of human resources have a great impact on the activity taken up the cluster, on the processes in the cluster and their results. Small number of people employed in the research and development activity translates into low innovativeness of Polish clusters. At the same time, high level of education of the cluster s employees points to the high potential for clusters' development. 62 Central Statistical Office, Indicators for monitoring the implementation of the objectives of the National Strategic Reference Framework for (NSRF) supporting economic development and employment.

58 6.2. Financing of the operation of the clusters Sub-area Financial resources includes the following indicators: Funds for shared projects implementation in the last 2 years External funding obtained for cluster projects in the last 2 years Share of membership fees in financial resources for the implementation of shared projects. The summary of the results for the discussed sub-area is presented below. Chart 19. The average value and the highest value of the indicator for the sub-area Financial resources of the cluster Financial resources for the implementation of shared projects in the last 2 years The average indicator value The highest indicator value Share of membership fees in the financial resources for the implementation of shared projects External financial resources achieved for cluster projects in the last 2 years Benchmark value for sub-area Financial resources of the cluster The average value for sub-area Financial resources of the cluster Big differences between the average value and the highest indicator value for all indicators presented above point to considerable discrepancies between the analysed clusters in the field of financial resources. The average amount of financial resources for the implementation of shared projects was about PLN 1.6 million, and the average amount of external financial resources PLN 1.4 million. The membership fees were collected in 13 analysed clusters. It is 12% of financial resources at the clusters disposal. The results of analysis for individual indicators are presented below. External sources of co-financing The main source of financing the clusters activity in Poland in recent years have been programmes co-financed from the European Union funds, i.e.: The Integrated Regional Operational Programme (IROP) implemented in the programming period ,
59 Operational Programme Innovative Economy (OP IE) implemented in the programming period , Operational Programme Innovative Economy (OP IE) implemented in the programming period , Operational Programme Human Capital (OP HC) implemented in the programming period , Operational Programme Development of Eastern Poland (OP DEP) implemented in the programming period , Regional Operational Programmes (ROP) implemented in individual voivodeships in the programming period , Innovation Express Programme financed from the national budget, developed within the framework of the INNET project financed from 6 EU Framework Programme 63, Leonardo da Vinci programme, which is an educational programme financed directly from the EU budget, implemented in: , , , Seventh Framework Programme, which is a financial instrument of the European Union supporting research and development works which include almost all science areas, implemented in , Foresight Programme 64, implemented in The clusters also implemented projects financed from the EU funds being part of cross-border projects (Interreg III Programme in the programming period and the European Territorial Cooperation Programme in the programming period ). In the period of their functioning, the clusters acquired over PLN 65.5 million in total and implemented 62 projects financed from external sources. The majority of projects obtained financing from the Integrated Regional Operational Programme ( ). The clusters in the programming period implemented 14 projects for the amount of almost PLN 6.2 million. The funds granted then were mainly allocated for the development of cooperation network and innovation in the regions. The number of projects implemented by the clusters from the external resources broken down by individual programmes is presented in the chart below. 63 Full title of the project: Creating cooperation network between national/regional financing and innovation organisations, for engaging SME in innovative clusters in Europe based on technologies - INNET 64 Foresight is a systematic, future-oriented way of accessing information in order to build medium or long-term development vision, its directions and priorities, acting as a tool in making current decisions and launching common activities (
60 OP IE OP HC OP DEP ROP for Voivodeships IROP 7 Framework Programme Cross-border Projects Foresight Programme Chart 20. The number of projects implemented by clusters from the external resources It is worth noticing that one cluster acquired approximately PLN 1.4 million for the implementation of its projects. This amount was allocated for approximately 1.32 of a project. The highest amount of resources was acquired by the clusters from the Operational Programme Innovative Economy - PLN 32.2 million. This amount of co-financing for the implemented projects results from the implementation of two measures under OP IE: Measure 5.1 Support for cooperative connections of supraregional importance and Measure 3.1 Initiating of innovative activity. The smallest amount of financing came from Leonardo da Vinci and Foresight programmes. Financial resources in the clusters About 29% of clusters have not had any financial resources for the implementation of shared projects in the last 2 years. The subsequent 7 clusters have had resources below PLN 100 thousand. 12 clusters have had resources which were between PLN thousand. More than 24% of clusters have had at their disposal the amount exceeding PLN one million. The majority of the acquired financial resources come from external resources. The clusters which have not acuired external financing in the last two years for the implementation of shared projects had resources amounting to PLN thousand. These amounts are very low compared to the funds which the clusters acquired from external resources. This indicates considerable difficulties in financing the clusters activity from own resources.
 to 100 thousand 100-500 thousand 500 thousand 1 million 1-10 million above 10 million External financial")
61 Chart 21. Financial resources for the implementation of shared projects in the last 2 years (PLN) to 100 thousand thousand 500 thousand 1 million 1-10 million above 10 million External financial resources The majority of the projects (79% of all projects) implemented by the clusters from the moment of their creation have acquired co-financing in the amount below PLN 1 million. This results from the fact that the majority of the clusters do not have enough own contribution in order to implement the projects of a higher value. One out of five projects has acquired cofinancing exceeding PLN 1 million. 10 projects have acquired co-financing in the amount exceeding PLN 2 million. These projects concerned co-financing infrastructure investments. The acquired funds were mainly used for constructing modern technological and production lines. These funds were also allocated for the projects concerning the development of cooperation of companies from the industry. The division of the funds is presented in the chart below. In accordance with information provided by the respondents during the interviews, as many as 56 applications submitted before July 2009 by the clusters, did not acquire co-financing, which statistically is more than 1 refused application for each cluster. In the majority of cases, the reason for not granting the fund was failing to fulfil formal requirements. The clusters representatives pointed also to difficulties in going through the second stage - substantive evaluation of the application form. On the one hand, it shows the lack of proper substantive preparation of the clusters for applying for the funds. On the other hand, the cause of difficulties encountered by the clusters can be a high degree of complexity of the funds granting process. The respondents indicated also the lack of advisory counselling for the clusters aimed at proper preparation of application forms.

62 Chart 22. Division of resources acquired by the clusters from external resources from the moment of their creation by the amount of granted co-financing number of projects co-financed below PLN 1 million number of projects co-financed from PLN 1 million to PLN 2 million number of projects co-financed above PLN 2 million The clusters have acquired much diversified amounts of co-financing in the last two years. Thirteen clusters have acquired the amount which is between PLN thousand. Two clusters have acquired co-financing between PLN 500 thousand and PLN 1 million. Over 22% of the clusters have acquired funds from external resources of more than PLN 1 million in the last 24 months. It should be noted, however, that over 44% of entities have not acquired any external funds at all. It is also worrying that many clusters have not been able to generate any resources over 2 years for the implementation of shared projects. This may mean that companies which are the cluster s members do not have enough financial base or do not have motivation to engage financially into the cluster development. The cause of this situation can be the lack of knowledge among entities in the cluster about mechanisms which would enable the acquisition of funds, both external and internal, for the implementation of shared projects, and the lack of will and organisational initiative in this field. Chart 23. External financial resources acquired for cluster projects in the last 2 years (PLN)


63 to 100 thousand thousand 500 thousand-1 million 1-10 million above 10 million It was observed that there is no correlation between the level of innovativeness of the cluster s industry and the amount of granted external financial resources. Perhaps this situation will change after the support of innovative industries is considered one of the priorities of the European Union activity; and in the future more financial resources will be directed to clusters which function in more innovative industries. The best practice connected with lowering the costs of promotion activities of a cluster by selective joining a partner s project, is presented below. This enables to lower the financial dependence of the cluster on external resources. Best practice 2. Lowering the costs of a cluster s operation Klaster Poligraficzno- Reklamowy w Lesznie (Poligraph and Advertising Cluster in Leszno) Aim: Lowering the costs of participating in trainings and conferences and other events which promote the cluster The cluster limits the costs of organising trainings and conferences and other events by selectively joining the projects organised by the cluster s partners. The coordinator, after consulting it with the cluster members, selects the events which can contribute to increasing the efficiency of cluster s operation or enable its promotion. The following entities are among those cooperating with the cluster: Innovation and Technology Transfer Centre, Warsaw University of Technology (Poligraph Institute), Research & Development Centre for the Graphic Arts, Social Initiatives Promotion and Development Centre, Poviat Starosty and the City Council. Effect: Optimisation of costs of the cluster s participation in many activities organised by the partners in the area selected by the cluster. Membership fees
64 The majority of the clusters (over 70%) do not collect membership fees from their entities for the purpose of shared projects. In 7 clusters membership fees are up to 25% of financial resources for joint undertakings. In the case of 2 clusters, the share of fees is between 26-50% and 51-75% of the resources for shared projects. Only four clusters finance shared projects practically only with the funds (in %) collected from their entities. The amounts acquired by the clusters from fees are from several to several hundred thousand. They depend on the capacity of entities which are the clusters' members. It should be noted that two of the analysed clusters are commercial law companies. Due to that, income from their activity is the main source of financing these companies. In this case, the membership fees cannot be collected. However, these companies can also acquire external resources for the implementation of their projects. One of them finances its activity from income connected with renting retail space (the cluster members are at the same time the company s shareholders, and space tenants). The second cluster which operates in the form of a company is not selling joint products yet. Chart 24. Share of membership fees in the financial resources for the implementation of shared projects It results from information acquired from the clusters representatives that membership fees are primarily allocated for current functioning of the clusters. There are situations when companies do not pay fees regularly. Financing the cluster only from such source contributes (by small amount of resources acquired in this way) to limiting activities taken up. Applying high membership fees, on the other hand, can be the barrier which hampers the entrance of new members into the cluster, or can cause withdrawal of entities from the cluster, if members do not see noticeable benefits of the membership in a short time. This means that the financing resources of the cluster's activity in such a situation are very limited. It is therefore necessary, especially at the stage of creating the cluster and in the first 2-3 years, to ensure external financial support from public resources.
65 The best practice, implemented in two clusters, connected with searching for alternative financing resources for the cluster s operation, is presented below. Best practice 3. Achieving new financial resources for the current activity of the cluster Alternative Information Technology Cluster Aim: Providing part of income from the functioning of enterprises in the cluster structure for the aims connected with the cluster s activity The cluster financing is one of the most crucial issues for companies entering the cluster. In the case when fee financing does not completely fulfil the needs connected with administration and statutory expenses of the cluster, there are other possible ways of acquiring the funds. Alternative Information Technology Cluster introduced the rule that from each contract acquired from the membership the cluster members give 5% of its value for the cluster. The arrangements connected with the transferred amount are not formalised. In spite of this, the members agree on the division of income since they take into account that without their participation in the cluster these contracts would not have been acquired. Such financing method has functioned for a short time and has already covered 2 contracts concluded within the framework of the cluster (contracts concerned the outsourcing of a research on a newly implementated product or project). The funds acquired in this way are allocated for the current activity of the cluster. Gdański Construction Works Cluster Gdański Construction Works Cluster, on behalf of its members, negotiates contracts with service providers and concludes group contracts. Thanks to that, the cluster members acquire more favourable conditions than in the case of individual contracts. The contracts which have been concluded so far concerned fuel supply and mobile communication services. The acquired savings, whose part is voluntarily declared by individual members, are allocated for the cluster's activity. In this way the cluster acquires finances for the current operational activity. Effect: Limiting the share of fee financing in the cluster s budget. Increasing financial resources for the development of the cluster. Summary In the sub-area of financial resources of the cluster the average score achieved by all clusters within the framework of benchmarking was Such a low mean value results from several factors. Firstly, there are many clusters which do not receive external financing (20 clusters).
66 Many clusters do not allocate any funds for the implementation of shared projects or do not collect membership fees. This happens especially in not very active or young clusters, which are not able to convince their members to implement shared projects or pay fees (it often results from inability to present measurable benefits from the participation in the cluster). It also results from information acquired in the clusters that activities taken up in the area of financing are mainly directed at searching for external financing resources of shared projects. There is lack of knowledge about alternative resources for acquiring funds for the implementation of the clusters' activities. Therefore, the activeness of the clusters primarily depends on the availability of public funds, which is worrying in the long-term perspective (raisesconcern about the dependence of functioning of the clusters in the long-term perspective on ensuring external financing). On the other hand, development of the clusters in the initial stage of development is not possible without the support from external resources. The period of change from the embryonic to the growth stage can last several years. Therefore it is necessary to apply mechanisms of public support of the clusters, which will be long-term (several years) system of encouragement which would positively influence the process of clusters gaining independence. Due to that, after the period of financial aid, the clusters will acquire appropriate experiences and encourage new members to participate actively in the cluster s activities, showing them measurable benefits. The members, being more aware of what the cluster is, will be able to co-finance its activity. In the future the clusters maybe will set up companies which will bring profit for the cluster s participants. At the moment, however, due to small financial resources of the clusters (especially own funds), preparation of long-term support plans seems to be necessary. The results acquired by the clusters show that higher level of innovativeness of the cluster s industry has an impact on better financial situation. Similar situation concerns the size of the clusters those with a greater number of entities acquired better results in the discussed subarea. It is easier for bigger clusters, especially those having big enterprises, to apply for external funds they have a better access to loans, they have no difficulties in generating own contribution for co-financing of the projects. During the interviews respondents were telling about many problems connected with financing the clusters activities, which are, inter alia: lack of bridging financing between the programming period for and , connected with the lack of continuation of some of the programmes, lack of financial support for administering the office, employment of a person for administering the secretariat, carrying out cooperation and starting the cluster activity, lack of proper support of cluster projects at the regional level, lack of financing dedicated only for the clusters, not adjusting the projects to the cluster s needs clusters need co-financing of organisational and administrative functions in order to be able to undertake project activities, difficulties in preparing the application forms for cluster projects and achieving funds along with the settlement of granted funds,
67 lack of loan offers for associations (an organisational and legal form often taken by the clusters), lack of availability of alternative forms of financing the cluster development (e.g. loan and warranty funds, venture capital, seed capital, etc.), lack of knowledge about the possibilities of adopting a legal and organisational form which would enable to carry out earning activity and foster strengthening of cooperation. The respondents, in reaction to the above problems, proposed different solutions, inter alia: allocating more resources for operational activities of the clusters (they called for considering the costs of cluster s administration to be eligible expenditure), supporting each cluster, which starts its activity, with a long-term financial plan, in which the amount of funds would be smaller each year, the possibility of access to funds without the necessity of allocating own contribution, the possibility of receiving financial resources also by a legal form of an association, increasing the number of competitions by lowering amounts of co-financing allocated for one project and preparation of competitions to which clusters would have easy access (including, inter alia, simplified application procedures), better description of project evaluation criteria, simplifying competition rules, taking into account the clusters' needs by consulting the way of allocating funds with the clusters and the professionals from the industry, ensuring advisory counselling concerning the possibility of financing the cluster s activity, improvement of communication with public administration. The results of the analysed sub-area, as well as the conclusions connected with the system of public financial support of the clusters, show that taking actions by the majority of analysed clusters depends on the amount of received funds. It questions the stability of cluster structures and the continuation of clusters activities after the end of financing. The clusters need, therefore, also the support aimed at the best allocation of granted funds and the possibilities of using other financing resources. Some of the clusters took steps to improve the situation in the field of financial resources with the use of innovative ideas, which were described in the best practices parts. The results show that membership fees are a slight part of financial resources of the clusters, and achieving income by the cluster is highly limited due to their legal form, as well as due to human resources of the clusters. In many of them the coordinators do not have time for undertaking activities which could earn money for the clusters, and the leaders and other members are not very active. The financial resources of the clusters have a great impact on their activity and results, and at the same time on the stability of their functioning Cluster infrastructure Sub-area Infrastructure resources include the following indicators:
68 Area of offices and conference rooms used for the cluster's needs. Area of laboratories available for the cluster members. Percentage of cluster members using the common internal network (Intranet). The summary of the results for the discussed sub-area is presented below.
69 Chart 25. The average value and the highest indicator value for the sub-area Infrastructure resources Area of offices and conference rooms used for the cluster s needs The average indicator value The highest indicator value Share of cluster members using the common internal network (Intranet) Area of laboratories available for cluster members Benchmark value for sub-area Infrastructure resources The average value for sub-area Infrastructure resources The information presented above shows low infrastructure resources of the analysed clusters in Poland. The "model" cluster acquired the benchmark value which is slightly over a half of a possible value, and the average is very low. Due to that there is also a big discrepancy between the analysed clusters. Many from the analysed clusters do not use common laboratories (16 clusters) and a common internal network (33 clusters). The results of the analysis of indicators of infrastructure resources of the clusters are presented below. Offices and conference rooms The majority of the analysed clusters use administrative areas which are in the coordinator s seat or other entities operating in the cluster. Not many entities have offices dedicated only for the implementation of tasks connected with administering the cluster. Individual clusters have from several dozen to several thousand of m2 of office floor and conference rooms at their disposal depending on the needs. The chart below presents the divisions of the clusters depending on the area of office floor.

70 Chart 26. The area of offices and conference rooms More than half of the clusters have the area of offices and conference rooms up to 100 m2, from which in the case of 15 clusters this number does not exceed 50 m 2. Less than 30% of the clusters use offices and conference rooms of the total area from 101 to 200 m 2. The remaining 4 clusters have at their disposal over 200 m 2 of such areas. The practice applied most often among the entities is using offices of the companies participating in the cluster. In some of the clusters, meetings were held in the office of a different company each time, which is favourable for integration of the cluster members, building of ties and learning about the scopes of activities. Many clusters, especially those including micro and small enterprises, complained about the lack of access to proper infrastructure. They pointed to this fact as an indicator limiting the possibility of their development. There were even situations, when the interviews were held in private apartments of the representatives of a selected cluster. The respondents pointed to the necessity of external support in this field, e.g. in the form of the possibility to use, in the case of formal meetings, the rooms of self-government or business environment institutions. Access to laboratory areas The clusters in Poland vary considerably regarding the available laboratory area, which results from different activity profile. The majority of the clusters (16 entities) do not have laboratories at all, which results from the lack of such need. The fact that many clusters have just started their activity and have limited financial resources, for sure contributes to limiting the number of available laboratories. 29 clusters have at their disposal rooms of the area from several dozen to several thousand of m 2. There is a visible correspondence between the available laboratory area and the innovativeness of the cluster's industry. In the majority of the clusters (16 from 27 which have the laboratories) the rooms have the area of up to 500 m 2. In the case of 8 clusters the available laboratories exceed 1000 m 2. The project analysis proves that the level of innovativeness of the cluster s industry is directly proportional to the area of laboratories available for its members. At the same time, as it was


71 already mentioned in the part concerning the share of research and development units in the clusters, although the entities have access to laboratories, many of them do not use this potential every day. Cooperation with research and development units is limited to theoretic cooperation, without the necessity to carry out laboratory analysis in the field of the implemented projects. The clusters representatives were often not able to determine the area of laboratories which is at their disposal. Chart 27. Area of laboratories available for the cluster members The best practice connected with the construction of a laboratory available for the cluster members is presented below. Thanks to this practice the members for whom the laboratory analyses, due to their costs, have not been available so far, can use the provided area. Best practice 4. Creating infrastructure, strengthening the cluster innovativeness Nutribiomed Cluster Aim: Construction of a laboratory for common cluster activities Nutribiomed Cluster developed and constructed one of the most modern technological lines in the world. This line is equipped with the devices of the highest quality which enable to carry out pilot production, which had not been available on the market before, nutraceuticals (combination of food products and pharmaceuticals). This project was implemented mainly due to cofinancing from measure 5.1 of the Operational Programme Innovative Economy, and with the support of the Wrocław Technology Park. The works with the use of the line have not been
72 started yet, it is thus difficult to enumerate its benefits. The construction of technological line is extremely flexible, which will enable to produce many kinds of products, including enriched pasta, mayonnaise of a unique composition, and also super phospholipids and products for osteoporosis. Effect: Obtaining an access to infrastructure, which had until then exceeded the financial possibilities of individual companies from the cluster. The new line will enable the development of production offer and will give the possibility of developing new formulas of nutraceuticals. Common internal network Using a common internal network in Polish clusters is poor. Only in 12 clusters the members use the internal network, and half of them is actively used by less than 50% of members. In the remaining 5 clusters almost all entities take information from an Intranet network (76-100%), but only in one cluster the Intranet is used by 51-75% of its members. It should be highlighted, however, that the clusters which do not use the Intranet tool often use tools which fulfil similar functions. After logging in on the cluster s website, they get the access to project documents or information available only for the cluster members. Chart 28. Percentage of cluster members using the common internal network (Intranet)
73 The analysed clusters see the Intranet network as a useful tool, although not necessarily essential at their present stage of development. Other means of communication are seen as more useful, i.e. internet forums, sending information by with using mailing lists or direct telephone conversations and meetings. This situation is also influenced by human resources (limited number of people responsible for cluster administration makes it difficult or even impossible to create modern channels for information flow in the clusters). Summary Summing up, in the area of infrastructure resources the average score from three discussed indicators is The cluster with the highest result acquired in this area the result at the level of These are very low values. They result from a limited access to office areas and conference rooms, especially for the clusters of micro and small enterprises, as well as the lack of a common network - Intranet. The respondents did not point to difficulties in the access to laboratory infrastructure. More noticeable was the lack of ideas for its use within the framework of cooperation with research and development units. This means that the laboratory potential of the clusters does not directly translates into the activities taken up by the clusters within this scope. As it has been noticed before, this can result from the lack of detailed specification of the area of cooperation with research and development units which are the members of the cluster. We should remember, on the other hand, that the intensity of using such infrastructure depends on the industry of a particular cluster and specific aims of its activity. The results acquired by the clusters show that the amount of acquired external resources does not directly translates into the results connected with infrastructure resources. The level of innovativeness of the industry of the cluster has has a considerably higher impact, which influences the size of laboratory area, especially for the clusters functioning in highly innovative industries. The clusters have at their disposal small infrastructure resources, which can make it difficult for them to carry out research and development activity. Even if there is access to laboratories, few enterprises make use of it. It is generally connected with not full cooperation of the clusters with scientific units. In accordance with CSO data 65, from all industrial enterprises, only 8.3% cooperated within the field of their innovative activity with other enterprises or institutions, and in the service sector it was only 6.6% of enterprises, and the cooperation was growing in the case of bigger companies. This trend is somehow reflected in the cluster resources they do not indicate great cooperation between the clusters members or universities in the field of research and development. Current resources of the clusters do not support them in using modern means of communication and transfer of knowledge. In Polish clusters infrastructure resources of the clusters are one of the areas which require improvement. In order for this to happen, these entities should first of all realise the advantages which can result from joint use of laboratories or Intranet network. These advantages include the growth of process production innovativeness or other processes 65 Innovative activities of enterprises in , Information note, Central Statistical Office, Industry Department, Statistical Office in Szczecin,
74 inside enterprises and inside the cluster, working out new products or services in niche markets, growth of demand for better designed products and generally an improvement of the standard of living. Using the internal network, on the other hand, leads to the improvement of communication, gives the possibility to introduce electronic documents, information and correspondence circulation, as well as to create libraries and information archives in the form of electronic documents. Thanks to that, there is demand for information among the cluster members, and the construction of the cluster culture is carried out with less difficulty. New cluster members can find their own place in the structure more easily.
75 7. Processes in clusters The next area covered by benchmarking analysis was processes in clusters area. Within this area, business processes carried out in particular clusters were verified in respect of operation processes. The analysis of information within this area enabled to compare actions taken in cluster structures which aim at achieving particular goals. Within processes in clusters area the following sub-areas were analysed: Market activity sub-area Marketing and PR sub-area Communication in cluster sub-area Creating of knowledge and innovations sub-area Summary of benchmark value and average values for processes in cluster area is presented below: Chart 29. Average value and benchmark values for Process in cluster area The analysis of the results in processes in cluster area presented in the above chart indicates that discrepancies between clusters in the area of processes are smaller than in the case of
76 the resources area. They have reached high benchmarking value and average value for all 45 examined clusters which is approximately 50 % of benchmark value. Such high result is caused mainly by very good marketing and PR scores. Nearly 98 % of examined clusters have their own websites, logos and visualisations. Several clusters received external resources for financing the preparation of visual identification system and production of promotional gizmos. As regards public relations actions the clusters undertake cooperation (including lobbying actions attempts), and in particular with self-government administration. Creation of knowledge and innovations sub-area has gained quite a high benchmarking value and average score. First of all it results from the common initiatives concerning training courses, study trips, participations in conferences or organizing conferences and exchange of experience between the cluster members. The value of indicator reached by the best entity is high also in Communication in cluster sub-area. Unfortunately, average score for clusters within this sub-area is much lower. Despite the fact that in many clusters regular meetings of members are held several times a year and in the others the members meet in working parties, the level of indicator is affected by: lack of common communication platform in clusters and small activity of internal information publishers (newsletters etc.). It shows an insignificant use of systematic and modern methods of communications. The clusters had the worst results in the market activity area. They very seldom take the opportunity to make common purchase. The common purchase if any, concerns usually simple products and services supporting members' work, such as mobile phone services. Moreover, only a few clusters use shared distribution channels. It is mainly due to the initial stage of cluster development and reflects also limited level of trust of particular members (however, the analysis shows that the problem concerns also the clusters with a longer history of activity). The clusters indicated that such a state of affairs results from too small number of entities in clusters till now, whose clout is not sufficient in negotiation of possible common orders. Apart from that, the lack of awareness concerning a possibility to use such solutions amongst clusters representatives was also marked Joint market activity of clusters The analysis within Market activity sub-area covered the following indicators: Joint supply joint orders Joint distribution channels Joint offer prepared by the cluster for the external recipients. Exchange of information among the members of the cluster. Summary of results for sub-area concerned is presented below.

77 Chart 30. Average value and the highest value of indicator within Joint market activity of clusters Within Joint market activity of clusters sub-area, the maximum result amounted to 9 points. Maximum score of 10 points has not been reached for any of indicators. Within this sub-area the indicator of market information exchange was the best. However, it still stands out from the benchmark value for the whole sub-area. In this sub-area the worst are indicators concerning joint orders and joint distribution channels. Their level shows lack of development of processes concerned in the Polish clusters. Whereas, the preparation of the joint market offer by particular entities is more and more often the marked phenomenon. However, as many as 29 clusters are still at the stage of identifying of such need or take the first actions in this regard. Therefore, benchmark value reached at the level of the whole Joint market activity of clusters" sub-area (presented in the above table) is strongly higher than the average reached by all clusters covered by the survey. The detailed analysis of indicators within Joint market activity of clusters sub-area is presented below. Joint supply - joint orders The below chart shows the score given to the clusters for the performance of joint orders. These orders may concern supply of raw materials as well as purchase of technological solutions or external services (e.g. mobile phone services). The average score for cluster was 1.71 which shows a very low activity in the field of joint orders.
78 Chart 31. Score for joint supply joint orders Score from 1 to 10 As much as 56 % of clusters is merely at the stage of planning joint supply and only recently has taken its first actions towards it. 24 % of respondents have not taken any initiative in that area. In one cluster many orders were noted but they concern only a part of entities. 2 clusters were identified where joint orders covered almost all of the cluster members. The clusters where such actions were taken generally purchase minor services, office/administration articles and promotional materials. Sometimes they purchase joint packaging for products or conclude agreement with energy supplier or telecommunications provider. Most clusters show that they only recently were at the stage of planning such actions or do not plan them at all because of big diversity of activity and related difficulties. Lack of joint orders made by all members of the cluster results also from the peculiarity of applicable procedures as regards orders in particular entities, and in particular it is difficult for public entities which are bound by the provisions of Public Procurement Law. Cross-sectional analysis shows the lack of relations between the amount of received external resources, size of cluster or level of innovativeness of cluster industry and activity concerning joint orders in the cluster. This challenges a working hypothesis according to which less number of entities in clusters causes an increase of activity in the field of joint orders. The clusters that received high score in this regard are connected with traditional economic industries. Joint distribution channels Clusters may carry out many actions concerning joint distribution. Their members can bid or carry on sale in joint point of sale or via joint website. The below-presented chart shows that 38 % of clusters have not even initiated the process of creation of joint sale path. It was also argued that the industry specificity or the nature of a cluster hinder taking joint market activity initiatives. The average score for cluster's activity in question amounted to 1.86 %. For 31 % of respondents an integrated sale is a good idea and they plan to take appropriate related actions. 9 % of clusters managed to build one distribution channel which covered a part of
79 entities. Joint sale of own products by 2-3 companies in clusters occurs. Only one cluster has a distribution channel which covers almost all entities, and the other - several joint sale channels for almost all entities. Chart 32 Score for joint distribution channels Score from 1 to 10 The respondents declared desire to take such initiatives together and claimed that at this stage it is too early for that. The idea of clustering is relatively young form of cooperation of entrepreneurs in Poland. Over 70 % of clusters operate no longer than 3 years. Preparation of joint channels requires first of all the high level of trust between particular companies associated in clusters, but also time for introduction thereof. Not surprisingly, the vast majority of clusters have not had such solutions yet. Whereas, for some clusters using of joint distribution channels will be very impeded or impossible, taking into account the specificity of the industry (e.g. water supply systems, power industry) or the nature of cluster (e.g. when selected stages of one production process are implemented by particular companies of the cluster. Joint cluster s offer The clusters showed moderate activity also as regards joint offer prepared for external recipients. Not many of them offer joint product or service. The average granted score amounted to However, many clusters plan to take action in this area or are already taking first actions. Such actions generally concern the preparation of the joint offer brochure or website that present companies and which enable to purchase services of those companies in packages.
80 Chart 33. Score for joint offer prepared by the cluster for external recipient Score from 1 to 10 None of the clusters covered by survey have a joint offer prepared for external recipients in which all members would participate. 3 clusters have a joint offer that covers over 70 % of entities - cluster members. 29 % of surveyed clusters could boast of a joint offer partially developed by their participating members, whereas 33 % only recently have planed actions concerned. It is mainly connected with the young age of clusters in Poland and just like in implementation of joint orders or creation of distribution channels, it requires a high level of trust and time for implementation of appropriate solutions. However, in this case there are no more limitations connected with the type of industry or specificity of a cluster which would prevent the creation of a joint cluster s offer, like in the remaining processes. Examples of good practices connected with the creation of cluster s product or brand and preparation of a comprehensive market offer for cluster are presented below.

81 Best practice 5. Creation of products under the cluster's name.

82 Best practice 6. Development of a joint comprehensive market offer Exchange of market information Dynamics of market information exchange is illustrated on the below chart. This category covers exchange of technological, industry and legal information and market reports' distribution via website or electronic mail, as well as formal and informal meetings. The average score in this area amounted to 5.30 points which means that in an average cluster approximately half of the members use several methods of market information exchange. In 31 % of clusters 7 out of 10 members participate in exchange of information. First of all it results from activity of particular companies in clusters. The more active a given entity is, the more information it provides to other members. Just like in other processes it depends on the level of trust amongst the cluster s companies. Entities which cooperate more often are also more eager to share knowledge than entities which join the cluster with a selfish attitude to gain profits only for themselves. Members of the cluster share trade and technological data, information on unreliable contracting parties or customers, and also support each other in sharing information on legal amendments, possibility to submit applications for the implementation of joint projects or possible cooperation between particular cluster members. However, it is not the case in every cluster as one can still observe in many of them a limited level of trust among the cluster members. In such situations they are not eager to share information of particular significance, such as information on customers, prices or development possibilities.
83 Chart 34. Score for market information exchange amongst cluster members Score from 1 to 10 A cross-sectional analysis of Exchange of market information amongst the cluster's members indicator shows two very interesting interrelations. Exchange of market information has obtained higher score in case of clusters which received external financial resources. One can assume that these resources enabled to create new form of market information sharing in the cluster. It is also possible that those resources were allocated for the purchase of external publications which present market data. Moreover, the clusters which have more participants are more active as regards market information exchange. This may be connected with the need to structure communication channels because of the necessity to disseminate information among many members. Good practice examples connected with transferring of orders between the cluster's members are presented below:

84 Best practice 7. Mutual transferring of orders Summary Results of clusters in Market activity sub-area come in the lower part of the 10 point scale. Benchmark for standard cluster equalled 7 points, whereas the average value of granted score was The activity in the Polish clusters is very limited, according to information gained within the survey. It mainly concerns the processes such as joint orders, distribution channels and joint cluster's offer. It results mainly from the fact that the idea of clustering is relatively young form of cooperation of companies in Poland. Over 70 % of clusters covered by survey have operated for no longer than 3 years. Preparation of joint distribution channels or implementation of joint orders require high level of trust of particular companies associated in the clusters. High level of trust at the present stage of development of the Polish clusters has not been reached yet to the extent that enables to implement such processes. Moreover, taking such actions requires adequately long period of cooperation and often also financial resources. 80% of clusters do not implement joint supply. The Polish clusters are still in the stage of planning and taking first actions in this area. The situation is similar with regard to joint distribution channels. Only 9 % of clusters formed a joined distribution channel. The vast majority of entities which do not carry out joint distribution or orders is considering such possibility. However, in the respondents opinion it requires time, financial resources as well as activity of entities being the members of the cluster.
85 According to some of clusters, the lack of possibility to implement joint orders by all members of the clusters resulted from the specificity of applicable procedure concerning orders in particular entities. Such process is particularly hampered when the cluster members are public entities which are obliged to apply Public Procurement Law. As regards joint distribution channels, for some clusters implementing such solution will be very difficult or even impossible because of the specificity of industries. The situation concerning joint offer prepared by clusters for external recipients looks a little bit better. Relevant actions taken by the clusters concern mainly preparation of a joint offer brochure, website presenting companies and enabling to purchase services provided by those companies in packages or taking part in tenders with the cluster members offer. However, none of the clusters within the survey had such a joint offer prepared for external recipient, in which would participate all of the entities associated in the cluster. It results from the structure of entities in the cluster, as well as their insufficient activity. Not in all cases companies want to take part in joint actions being taken in clusters, which is also driven by the lack of identification with the structure or lack of belief in the efficiency of taken actions. In the area, the indicator for market information exchange amongst the cluster member had the best average result noted for all clusters. Each time respondents stressed that the above aspect of cluster structure functioning is the most profitable for them as the cluster members. Market information exchange relates mainly to all commercial, technological information, information on legal amendments or possibility to submit applications concerning the implementation of joint projects. Respondents who are the leaders most often assessed this exchange higher than the coordinators. It results from the fact that they represented the leading companies in clusters which take part in exchange of information between companies on a daily basis. Activity of particular companies in clusters influences directly on the intensity of contacts between members in the cluster. The more engaged in actions taken by the cluster its particular members are, the bigger their will is to cooperate and exchange knowledge and experience. It depends on the level of trust amongst the cluster companies just like in other processes. Entities which most often cooperate also are more eager to share knowledge than entities which join the cluster to gain profits only for themselves. In the cross-sectional analysis one can notice a clear trend toward the increase of market activity of the cluster together with the increase of financial support. Granted resources have a motivating influence on contacts between the cluster members because of the necessity to implement jointly particular tasks in co-financed project. Summing up: Joint market activity of clusters sub-area requires unquestionable improvement of actions amongst the Polish clusters. The creation of appropriate conditions of cooperation in the first place by an increase of mutual trust amongst the members of particular clusters is the condition for success of all actions concerned. The second significant issue here is the necessity to identify needs and possibilities to implement joint processes in clusters so that prepared solutions would take account both of the specificity of industry and of the nature of particular clusters. The solutions prepared for processes should be considered carefully, so that they would be adjusted to the needs of as many members of the cluster structures as possible.
 Joint activity of the cluster concerning trade fairs Joint lobbying authorities Common websites of the cluster Visual identification system of the cluster (inter alia")
86 7.2. Marketing and PR activity of the cluster The following indicators are covered by the analysis within 'Marketing and PR sub-area: Joint advertising activities of the cluster (leaflets, brochures, advertisement in the media) Joint activity of the cluster concerning trade fairs Joint lobbying authorities Common websites of the cluster Visual identification system of the cluster (inter alia common logo, colouring, letterhead) Contacts and presence of the cluster in mass media Summary of results for sub-area concerned is presented below. Chart 35. Average value and the maximum value of indicator in 'Marketing and PR of the cluster sub-area
87 The maximum score (excluding Joint lobbying directed at authorities ) has been reached for most indicators in Marketing activity and PR of the cluster' sub-area. The average results in this sub-area were considerably higher than in joint market activity sub-area. The best result was reached for the joint websites indicator. Common use of this tool causes that it is used almost in every cluster (only one cluster does not have active website). In this sub-area the indicators concerning Joint lobbying directed at authorities' and Joint activities concerning trade fairs were the worst. The detailed analysis of indicators within 'Marketing activity and PR of the cluster' sub-area is presented below. Joint advertising activities Most clusters carry out joint advertising activities. Over half of them (26 out of 45) received in this category 6 or higher score which means that they use many advertising methods which cover at least some members. As many as 10 clusters received the maximum score - 9 or 10. The average score for this indicator amounted to Leaflets and brochures of different type are the most popular forms of advertisement. Moreover, both local and nationwide mass media (press, television, radio) are also used for promotional purposes. Many of clusters presented not only the entire offer but also the offers of particular members when preparing materials for website or brochure. For some entities, and in particular for micro-enterprises it is a cheaper form of advertisement which they can afford. Chart 36. Assessment of joint cluster advertisement activities Score from 1 to 10 It is worth noting that the higher score joint advertising activities received, the more external resources were gained by the cluster. It results from the fact that some clusters received financial support directly for the preparation of advertising materials (e.g. from Express Innovation program). It is also noticeable that the stronger the growing trend in cluster advertising is, the more entities are in the cluster.
88 Example of good practice connected with the comprehensive planning and carrying out od promotional campaign is presented below:

89 Best practice 8. Comprehensive planning and carrying out promotional campaign Trade fair activity The scale of trade fair activity being carried out is very diverse. About 10 % of clusters did not organise and take part in any trade fairs and exhibitions. The most (25 out of 45 clusters) received score ranging from 3 to 5 which means that they participated in one or more such events, but each time only some of the cluster members participated in them. 11 clusters received in total 6 and higher score. It means that the cluster members participate or organise more trade fairs and exhibitions. The average score for that indicator amounted to The substantial number of clusters take part not only in nationwide but also international exhibitions. Some of them organise trade fairs or conferences themselves. It stems from the lack of such events, and in particular events of industry nature on the national market. Participation in a cluster is an opportunity to promote the industry, cluster and companies themselves, and at the same time it lowers related costs as they are divided between more entities.
90 Chart 37. Score for joint trade fairs activity of the cluster Score from 1 to 10 The cross-sectional analysis also shows that clusters which operate in more innovative industries participate more often / to a greater extent in trade fairs and exhibitions. It is caused by an increased need to receive current information on technical and technological novelties. Higher score is also received by the clusters composed of the bigger number of participants which is directly connected with the better financial possibilities such entities have. Joint lobbying directed at authorities The clusters in Poland are aware of the necessity to cooperate with public authorities in order to establish their position as the significant partner in region (country) and secure the level of their competitiveness. Most clusters (25 out of 45) carry out informal actions with this regard such us meetings and direct talk with public authorities. Few respondents gave examples of formal actions that cover submitting official positions or letter addressed to public administration (score from 3 to 5). Only one cluster received in that category almost the highest score (9) which proves that it successfully carries out many both formal and informal initiatives. Social-personal meetings which are an occasion to raise cluster issues may be an example of informal actions. The average score for that indicator amounted to Most often clusters activity is addressed to self-government administration. Only in a few cases, meetings with the representatives of parliamentary committees were organised. Actions that are taken concern in the first place issues connected with the provisions regulating selected industry, medium and higher-level education programs, as well as issues related to financing the clusters' activity from public resources. The representatives of the clusters meet most often with local authorities and more seldom with poviat or gmina authorities. It results from the wide scope (voivodeship) of clusters' actions. It is also interesting that more lobbying actions directed at authorities are taken by the clusters that have
91 received little external resources or have not received them at all. One can notice a positive trend that these clusters try to take actions for their members or home industries despite the lack of financial support. Chart 38. Score for joint lobbying authorities Score from 1 to 10 The examples of some clusters covered by survey indicate that strong persistence in making changes brings measurable results in the form of e.g. changes in education program, assessment criteria for projects within EU programs etc.). However, respondents more often complained of the low efficiency of actions they take. In the respondents opinion, the standpoint presented by the cluster is often ignored by public authorities (in particular at the central level). Respondents indicated that they have an impression that they are not treated as the discussion partners. The results of benchmarking survey shows that only selected clusters take formalized actions in order to attract public entities attention to the problems concerning functioning of the clusters and their industries. It results to a large extent from a conviction of a low effectiveness of such actions. In the course of interviews, respondents indicated their negative experience concerning cooperation and feeling that a cluster is not an equal partner for the public institution and its opinion will not be taken into consideration. This situation results in lack of willingness of the Polish clusters to follow actions of public authorities on an ongoing basis and to take formal initiatives in the form of consultations of prepared documents or decisions taken by the authorities at the governmental or self-governmental level. Example of good practice connected with promotion of cluster amongst local community by printing bulletin is presented below.

92 Best practice 9. Cluster promotion via bulletin
93 Cluster s website The clusters being surveyed received very high scores for having a common website. Practically all clusters have their own website which is in most cases dedicated (independent from any membership entity). Most websites are updated on the regular basis, have easy navigation and include contact details of cluster entities. Chart 39. Score for a common website of the cluster Score from 1 to 10 It is reflected in high scores in this category. 36 clusters received 6 and higher score. One cluster does not have its own website and claims that it is due to the lack of funds for launching it. The average score for this indicator amounted to The clusters which received external resources and those that operate in more innovative industries (in particular from ICT sector) go best in this respect.

94 Example of good practice connected with the use of Internet marketing is presented below. Best practice 10. Use of Internet marketing
95 Visual identification system Almost every surveyed cluster has some element of visual identification. They have their logos, some of them have also identifiable characteristic colouring. Some of them have broader range of elements that enable visual identification e.g. in the form of letterhead, calling cards or common designs of promotional materials. About 60 % of clusters received in this category a score ranging from 3 to 5. Chart 40. Score for visual identification system of the cluster Score from 1 to 10 Only one entity from clusters covered by survey do not have any visual identification system due to lack of financial resources for such activity. The application concerning subsidy for a.o. the above mentioned purpose is pending. One of the clusters has legally protected trademark that covers a product which has been jointly developed by the members. Several entities have advertising gizmos such as: mugs, caps eco-bags food products CD in the shape of business card card box The above information indicates that graphic symbols are in common use by the Polish clusters. Cluster promotion is currently one of the main objectives of such entities in Poland. However, surveys show that not everything has been done as regards this issue, because e.g. visual identification system, as the element of marketing communication necessary from the point of view of promotion possibilities and creating cluster image, for sure in many cases still
96 requires improvement. According to analysis which has been carried out only 30 % of clusters fully use visual identification system and it is used not only for the clusters' needs but also by entities being its members. Use of prepared system depends mainly on the level of identification of cluster members with the whole structure. It means that over a half of entities in clusters still do not identify themselves with the cluster. The interesting thing is that there is no noticeable interrelation between the amount of received external resources and the assessment of visual identification system of the cluster. Presence of the cluster in mass media Clusters participating in survey marked their presence in mass media on a different scale. One of the most popular forms was posting information and articles on websites and publishing them in the press (industry, local, nationwide and very seldom also in foreign press). Chart 41. Score for the cluster s contacts with and attendance in mass media. Score from 1 to 10 Some clusters were presented on the radio and television (local, nationwide). Events with the participation of clusters (it refers mainly to service clusters and those dealing with tourism) were often used for promotion and to increase the presence of cluster in media. Several entities decided also to produce their own spots. Almost 75 % of clusters reached in this category a score ranging from 4 to 8 thanks to such initiatives. The average score for that indicator amounted to The cross-sectional analysis shows the interrelation between the size of cluster and frequency of appearance in media. It presumably results from the greater possibilities with this regard when the number of member is greater. Example of good practice connected with the development of marketing actions through sponsoring and patronage under international events is presented below:

97 Best practice 11. Development of marketing actions through sponsoring and patronage during international events Summary Summing up: the average score of 6 discussed indicators amounts to 5.29 in Marketing and PR area. The cluster with the highest result in this area reached According to information gained from analysis the indicator concerning websites prepared by the clusters was the highest in this sub-area. All clusters with one exception have websites, most of which are updated on the regular basis, with easy navigation and contact details of entities from the cluster. The score for this indicator may be further improved by introduction of better functionalities and making them more interactive using new tools such as forum, knowledge database etc. which are not common at present in clusters. The processes concerning marketing actions and PR of the Polish clusters also received one of the highest scores. This score mainly results from the interrelation of such actions with the most popular purpose of cluster structure which is currently promotion and development of the industry. It also influences directly the necessary visual identification system in the cluster (inter alia: joint logo, colour, letterhead) and contacts and presence in mass media. These are other indicators which have reached high scores. However, the possibility to implement such actions is mainly dependent on availability of resources for the implementation of these actions. Not all of the clusters could afford it. The analysis shows that the more members the cluster has, the more such actions it implements. Trade fair activities in comparison to other indicators look a little bit worse. Generally, the clusters participate in trade fairs and exhibitions, but according to some respondents the attendance is not so high due to financial limitations (it concerns in particular international events).
98 As regards lobbying activities addressed to public authorities there is a noticeable trend to address actions to self-government administration and (to very limited extent) to government administration. The representatives of cluster usually meet with regional authorities and rarely with poviat or gmina authorities which results from the lack of possibility to get support from the latter and for these authorities to shape policy in the cluster area. Only selected clusters take formalized actions in order to attract public entities attention to the problems concerning functioning of the clusters or their industries. It results to a large extent from a conviction of a low effectiveness of such actions. On the one hand the clusters indicated their negative experience concerning cooperation and feeling that a cluster is not an equal partner for a public institution and its opinion will not be taken into consideration. On the other hand, the examples of selected clusters indicated the effectiveness of consistent lobbying activity regarding educational programs for the secondary and high schools or amendments in financial provisions concerning public programs to be more profitable for the cluster. The results show that the amount of external resources being gained not only have direct impact on the improvement of the cluster activity in the field of marketing and PR. The conclusion from this analysis is as follows: clusters are able to take many marketing and PR initiatives even though they do not have external financial resources or those resources are very low. Analysing the cross-sectional group connected with the level of innovation of the cluster s industry one can notice that clusters which function in industries that are characterised by the higher level of innovation have better results in the field of marketing and PR. These differences are insignificant anyway: the clusters that operate in more innovative industries can use modern media in a better way to take promotional actions. The same applies to the cross-sectional group connected with the size of a cluster measured in the number of entities - the bigger the cluster, the higher the score in the field of marketing and PR is. In this situation economies of scale are clearly noticeable Communication in cluster Within Communication in cluster sub-area the analysis covered the following indicators: Regular meetings of entities in the cluster Joint integration events Joint communication platform (inter alia Intranet). Internal press (including newsletters)
99 Summary of results for sub-area concerned is presented below. Chart 42. Average value and maximum value for Communication in a cluster subarea The average value of results reached by all clusters in the Communication in cluster' subarea is half as much as the benchmark for this sub-area. The indicators concerning internal organisation of work (including newsletter) and joint communication platform received the lowest score. The results of these indicators are mainly dependent on time and financial possibilities which according to survey are limited in the Polish clusters. The best score was noted for the indicator regarding 'Regular meetings of entities in the cluster'. However, the average result still stands out from the highest value of indicator reached by the selected entities in this area. The detailed analysis of indicators within Communication in cluster subarea is presented below. Regular meetings of entities in the cluster In all clusters regular meetings of members are held from several to a dozen or so times a year. The number of entities participating in meetings is different (usually at least half of them, but there are also meetings in which almost all members take part). The meetings of the management of cluster structures associations, thematic groups and other bodies to which special functions are conferred in clusters take place often. The members of entities where additional working parties were established sometimes meet even once a week or once
100 every 2 weeks. The considerable majority of clusters (35 out of 45) received in this category score that locates in the middle of the scale ranging from 3 to 7. The next 5 clusters received scores below 3, and the remaining 5 - over 7 (including one - 10). The average score for this indicator amounted to Chart 43. Score for regular meetings of entities in the cluster Score from 1 to 10 Regular meetings are held more often and the attendance concerned is higher in clusters which have received external funds. These meetings mainly concern the current implementation of subsidized projects. The fact of receiving a grant is an incentive for the cluster members to participate in meetings as it is an evident effect of joint actions. The current actions taken by the cluster entities also influence the cluster's activity. One has not established relations between the size of cluster and the regularity of meetings because there are task forces in big clusters which hold meetings relatively often.
101 Integration events Large number of clusters (19 out of 45) do not organise joint integration events or are now at the stage of planning them (score 0 2). About 50 % of clusters organise integration events once or several times a year (score from 4 to 7). Chart 44. Score for joint integration events Score from 1 to 10 These events are very often the continuation of formal meetings of the cluster members. Such events are an opportunity for entrepreneurs, representatives of self-government units, research-scientific units and other business-oriented institutions to get to know each other better and to find cooperation possibilities in an informal way. Some clusters also planned to organise integration trips. Financial resources turned out to be the biggest hindrance. The average score for the indicator amounted to 3.58.
102 Joint communication platform Most clusters being surveyed (28 out of 45) do not have joint communication platform or such platform is very limited (score 0-2). Some of them do not have resources for such actions and many of them plan to build such platform in the future. Discussion fora and groups are the most popular forms of communication of the cluster members on the Internet. Very often it is also unidirectional communication i.e. sending s with information by the coordinator. Single clusters use more complex tools. Chart 45. Score for joint communication platform Score from 1 to 10 Only a few clusters post on the joint platform document models or IT tools that facilitate work of their members. The average score for this indicator amounted to Surprisingly, scores related to joint communication platform are not correlated with the level of innovation in the cluster industry. Financial issues were the main reason of the lack of information exchange platform indicated by the clusters. Building of such tool is expensive and this is the reason why Polish clusters with the limited financial resources postpone this investment. Moreover, using such solution is reasoned for entities which compose of a large number of members, and thus their internal communication is hampered. In clusters that associate few members s exchange or access to joint project documentation at the cluster s website for the logged-in users turn out to be sufficient forms of contacting. It is worth attention that in this case the age and development level of Polish clusters have direct impact on the result reached by the indicator.

103 Examples of good practices connected with encouraging the cluster members to create jointly the website or exchange information on human resources in the cluster are presented below. Best practice 12. Incentive for the cluster members to create together a website and exchange information

104 Best practice 13. Exchange of information on human resources in the cluster
105 Internal press Many of the clusters (20 out of 45) do not use at all or just plan to use internal press as the means of communication (score 0-2). About 40 % of clusters use this form of communication on a regular basis according to their needs. Five clusters often use this form of communication. Communication in clusters is often carried out in the form of s being sent by the coordinator. Over 20 % of clusters considered creating additional form of communication such as press to be unnecessary. In their opinion it was a redundant tool which does not bring measurable profits. Chart 46. Score for internal press In clusters where bulletins are prepared (in the form of electronic files or printed materials), bulletins are usually sent not only to cluster members but also to other interested parties (cluster partners or self-governments). The average Score from mark 1 to for 10 that indicator amounted to As it was previously mentioned, the preparation of such bulletin requires both time and (in the case of printed form) financial means. The clusters where most of coordinators are involved in community work and must reconcile professional tasks with involvement in cluster s activity cannot afford to prepare additional internal press. Therefore, these clusters use mainly electronic mail. Moreover, not all entities consider this form of communication necessary and efficient.

106 Example of good practice connected with the development of joint resources of market information is presented below. Summary Summing up, in the 'Communication in cluster' area the average score for 4 discussed indicators amounts to 3.7. The highest result reached in this area was at the level of The highest score in this area received an indicator concerning regular meetings of entities of the cluster. The meetings in clusters are held more often when entities jointly implement projects or prepare themselves to submit applications. It is unusual that all entities of the cluster participate in meetings. The frequency of joint contacts is also determined by setting apart additional bodies that perform given functions in clusters or working parties. Participation of the cluster members in such meetings depends on particular entities involvement in the cluster's activity. The more active the entity is, the higher the attendance at the meetings. The attendance at the meetings is also determined by the issues being discussed. The companies which are not interested in a given issue will not participate in such meetings.
107 The clusters organise to a limited extent joint integration events. It results from the fact that it is connected with additional financial resources. Often it also happens that integration results from the continuation of the official meeting which naturally evolve into informal meetings. Communication of clusters within joint communication platform (inter alia Intranet) is limited. Members most often communicate via simplified tools such as discussion lists or communications being sent via . Moreover, the use of advanced communication platforms is in most cases justified in organisations which are composed of big number of members. In the case of clusters that associate few members, simpler form of contacts are more reasonable. It is worth attention that in this case, the age and development level of the Polish clusters have direct impact on the result reached by the indicator. Also internal press (including newsletter) is not the most popular form of communication. If clusters decide to distribute newsletter in most cases it is also distributed to the external entities. Respondents explain that the preparation of the additional method of communication is limited due to the fact that they are involved in community work as coordinators in clusters and must reconcile this activity with their basic professional tasks. According to information gained from the analysis, the amount of received financing has not always a direct impact on the improvement of communication amongst cluster members. The situation is similar as regards the classification of clusters according to the level of innovation in their industries. It does not affect the results concerning communication. What is interesting, the size of cluster (number of participants) also does not determine the results which are reached in the communication area. The conclusion is that the member of cluster may communicate efficiently with the use of different tools (meetings, events, trips, Internet, communication platform, bulletins etc.) regardless of the amount of financial resources, number of entities in a cluster or the level of innovativeness of the cluster industry.
108 7.4 Creation of knowledge and innovations Under the sub-area Creation of knowledge and innovations the following indicators underwent analysis: Joint works on new products and technologies. Jointly introduced innovations (organizational, marketing, in services). Joint trainings, workshops, conferences, study visits (education of employees). Joint data bases. Exchange of knowledge and experiences (informal) between cluster members. Technology transfer. Below there is a summary of results for the discussed sub-area. Chart 47. The average and the highest value of the indicator under the sub-area Creation of knowledge and innovations Benchmark value for the sub-area Creation The average value for the sub-area of knowledge and innovations Creation of knowledge and innovations 7,83 4,32 Under the sub-area Creation of knowledge and innovations for 4 out of 6 indicators the highest value of an indicator did not reach the score of 10 points. The best result in the subarea was acquired by the indicator concerning the exchange of knowledge and informal experiences. Also joint trainings, workshops, conferences, study visits remained at the level of the average acquired by the clusters included in the study evaluated at the level higher than half of the benchmark value. The indicator related to jointly introduced innovations and
109 technology transfer in clusters acquired the worst results in this sub-area. Below there is a detailed analysis of indicators in the sub-area Creation of knowledge and innovations. Joint works on products and technologies The aim of initiating cooperation between entities in clusters was, among others, the possibility to create a common product or a new technology. The chart presented below shows that as much as 35% of clusters is still at the stage of planning and initiating such cooperation. Four clusters, concentrating entities whose type of activity or line of business make it impossible to create a common product or technology, e.g. a situation when companies associated in a cluster take part in different stages of production, as sub-contractors, waterworks business, gained no points for this criterion. Chart 48. Score for joint works on new products and technologies Score from 1 to 10 8 clusters gained 3 points, which means that they conduct works on a common product or technology. 11% of clusters designed their own products or technologies but they were never sold nor implemented. 8 clusters gained scores between 6 and 8 which means that they have jointly drawn up at least one product/technology which was implemented. 4% of the studied entities (cluster members) have an integrated production line for a few products or technologies, they also conduct works on starting up new ones. Works conducted in terms of technology transfer or joint products are financed by external resources (e.g. purchase of a production line or support for works on a common product). Thus, the dependence between the amount of cluster financing and the score for joint works on a product/technology should not be surprising. Also clusters operating in more innovative businesses gained better scores they more often jointly work on new solutions and they are also more often successful in implementing the results of their works. Many clusters during interviews stated that the aim of their activity is not the creation of a joint product. The main goals of cluster creation in Poland are promotion and development of the line of business, bigger possibilities of gaining financial resources for joint projects as well as
110 the exchange of knowledge and experiences and the increase of cooperation. Technology transfer and joint works on a technology/product/service are the 2 out of 4 the most rarely indicated goals of cluster structure creation. Thus, it can t be surprising that clusters are not active in this field. It also depends on the age and development of clusters in Poland and the availability of resources for those purposes. Jointly introduced innovations The chart below presents the distribution of scores for jointly introduced innovative solutions in terms of management, organization, marketing or services. The dominating group of clusters (56%) gained scores between 0 and 2 so currently it has not implemented any innovative solutions or it only just plans such solutions now. 7 clusters prepare for implementation of a new solution. 18% of entities managed to introduce one rationalization and 5 clusters two or more and they work on further ones. The majority of joint innovations concern organizational solutions (communication, computerization), definitely more rarely they include the implementation of new technologies or products. An average score for this criterion amounted to Chart 49. Score for jointly introduced innovations (organizational, marketing, in services) Score from 1 to 10 It follows from information gained from respondents that most commonly the transfer of innovations between cluster members takes place with the use of the simplest tools and behaviour imitation channels (copying) through the exchange of information in the form of informal and formal meetings. However, the clusters operating in highly innovative lines of business, benefiting from cooperation with research and development units, have a proper background for the creation of joint innovative solutions.
111 Joint trainings, workshops, conferences, study visits Actions aimed at the education of cluster members include above all workshops, study trips to foreign clusters and conferences. The average score given for this criterion amounted to From 5% to 70% of cluster members participated in the organized events aimed at the increase of the knowledge level. 53% of clusters used at least one form of training and 12 entities have as much as three trainings. 38% of clusters organize trainings in a regular way and with high frequency. Out of 45 entities whose scores were taken into account in the study only two do not conduct any initiatives of this type. A higher number of trainings, study visits or participations in conferences took place in those clusters which received external funds enabling their financing. It results from this analysis that clusters are interested in the increase of knowledge level of their members even when they lack financial resources, however, in the case when they have such resources at their disposal they can in a better way contribute to the creation of knowledge. Clusters which operate in more innovative lines of business more often organize trainings for their members due to the necessity of getting to know the newest technical and technological solutions. Chart 50. Score for joint trainings, workshops, conferences, study visits (employees education) Score from 1 to 10 Below there is an example of the best practice connected with creation of new technological solutions with the cooperation of a cluster and research units.
112 Best practice 15. Regular meetings of the representatives of the education and enterprises sector form a cluster. Association of Entrepreneurs of Aviation Industry Aviation Valley Aim: creating new technologies with the cooperation of a cluster and research entities Creation of a Group of Aviation Industry Enterprises called Aviation Valley The Aviation Valley Cluster took actions aimed at tightening cooperation between research and development units and the surrounding enterprises connected with the aviation industry as well as the implementation and commercialization of new technologies in this sector. The result of those activities was the initiation of a consortium: The Center for Advanced Technologies AERONET Aviation Valley (Centrum Zaawansowanych Technologii AERONET - Dolina Lotnicza") consisting of research units, entities operating for research and development works and a group of entrepreneurs. Currently it is one of the strong and active members of the consortium. Cooperation between the research environment and companies resulted in the implementation of the following projects: Materials Research Laboratory for Aviation Industry Advanced aviation technologies demonstrator a flying research platform Advanced aviation technologies demonstrator onboard equipment FORESIGHT- Development Directions of Technologies for the Needs of the Aviation Cluster Aviation Valley Modern material technologies used in aviation industry individual key project Effect: The implementation of the aforementioned projects, tightening of cooperation between research and development units and the environment of entrepreneurs as well as the implementation and commercialization of new technologies connected with the aviation industry. Joint databases The access to joint data bases by cluster members is limited. 11% of clusters is not interested in the creation of joint data bases, while 5 clusters think about such a solution or acts in this direction. 42% of studied entities have joint bases (usually contact data of cluster members and partners). Among the most commonly mentioned types of bases there were platforms of market and branch data exchange (also branch reports), contact data of associates and experts as well as trainings, conferences. As part of data bases owned by clusters there was also information concerning legislation changes connected with the activity of the industry. 10 clusters have two and more sources of information exchange. Only one cluster has more than 3 data bases. The average score for this criterion amounted to In general it can be stated that data bases of clusters are simple tools facilitating cooperation. Few of them are a practical tools serving as knowledge bases or information exchange.
113 Chart 51. Scores for joint data bases Score from 1 to 10 It results from the analysis that in bigger clusters access to data bases for one of the members is better than in the case of clusters associating fewer members. The scale benefit effect is here clearly visible. For an individual entity it would be difficult to create a knowledge or business information base. Whereas, in the case of cooperation of a few tens of entities (especially when research and development units are among them), creation of such a data base is much easier. Exchange of knowledge and experiences between cluster members In the case when clusters do not have formalized methods of information exchange in the form of ready data bases the information exchange is carried out at an informal level in the form of meetings or phone conversations. Respondents were very contented with such a form of contacts and they often underlined that it is regularly used. Exchange of knowledge and experiences concerned, among others: the applied technologies, areas of possible cooperation, knowledge in terms of legal solutions applied in a given line of business, organizational issues, possibilities of financing joint projects or their implementation, possibilities of borrowing production appliances etc.
114 Chart 52. Exchange of knowledge and experiences (informal) between cluster members Score from 1 to 10 The average score amounted here to % of clusters gained scores between 6 and 9 which prove that the contacts between particular members are vivid and regular. Only one cluster admitted to the lack of any initiatives in this field. Informal contacts and their intensiveness to a large extent are dependent on the level of trust among cluster members as well as the activity of particular entities. Below there is an example of the best practices connected with the exchange of knowledge and international experiences and the investment in practical knowledge of potential personnel. Best practice 16. Exchange of knowledge and international experiences


115 Aim: Learning about worldwide trends and technical novelties Innovative Industrial Cluster the Association of Casting Components Producers KOM-CAST KOM-CAST cluster once a year co-organizes an international conference entitled: Quality assurance in foundry, which includes issues concerning: innovative technologies, application of modern research tools, research concerning hardness tests of metals, welded constructions and organization of production process. So far 11 such conferences took place and the cluster was a co-organizer of five of them. The effect of the meetings is the exchange of experiences, broadening of knowledge, getting to know technical novelties and the analysis of trends and industry development. In the conferences participate the representatives of such countries as: China, Czech Republic, Finland, Slovakia, Argentina, Hungary, Slovenia, Japan, Ukraine and Russia. Effect: Initiation of contacts with foreign companies and with research and development units. Exchange of opinions and knowledge. Best practice 17. Investing in practical knowledge of potential personnel. Aim: Increase of competences and provision of access to pre-school personnel Energy-saving Technologies Cluster EURO-Centrum Euro - Centrum Energy-saving Technologies Cluster The cluster enables 2-month internships, preparation of Bachelor and Master s thesis as well as the acquisition of experience in companies from the cluster by graduates and doctoral students mainly from Silesian University of Technology and AGH University of Science and Technology. Internships enable practical implementation of theoretical knowledge gained during studies. Writing BA, MA or doctoral thesis in the cluster enterprises influences full understanding of the subject of the prepared work as well as gives the possibility to gain reliable information about the company. 4 graduate theses have been drawn up with the participation of companies included in the cluster. The subject of the works was connected with energy-saving technologies and was mainly based on research conducted in the cluster companies. A benefit for companies resulting from the internship program is the possibility to employ the best interns. Additionally, the companies can learn about technical novelties which are familiar to the students from the theoretical side during studies. During one year seven students on average take part in internships. Effect: The possibility to choose potential employees
116 from among the best interns. Gaining analysis on the cluster companies and the industry, drawn up by students during internships. Transfer of technologies The last indicator studied under the sub-area creation of knowledge and innovations was the transfer of technologies. The results presented below directly correspond with the results for joint works on a product and technologies. The average score for this criterion amounted to In the case of 8 clusters no transfer of technologies took place. 33% of studied entities are at the stage of plans creation, 9 entities purchased a new technology which was successfully implemented by some of the participants. 13% of clusters prepared (e.g. in cooperation with universities) their own solutions and they work on their implementation, another 13% is already after the implementation and they work on further solutions. Only one cluster gained a maximum score which means that the cluster has already conducted a transfer of technologies as part of its structure and conducts works on further ones. Transfer of technologies usually has a form of cooperation with universities or knowledge exchange networks (also foreign ones), more rarely purchase of ready appliances (e.g. a production line). Chart 53. Cluster scores for technologies transfer Score from 1 to 10 The dependence between the innovation level of cluster industry and technologies transfer is clearly visible. In the case of clusters operating in not very innovative industries in traditional branches of economy, such technology transfer is rarely a condition of optimal activity. While in the case of clusters which operate in highly innovative industries technologies transfer is often the main goal of activity. Summary Summing up, in the area of the creation of knowledge and innovations the average of the discussed five indicators is A reference cluster acquired the result of 7.83 in the area of creation of knowledge and innovations.
117 The lowest scores in this sub-area were given to indicators concerning jointly introduced innovations, technologies transfer and joint works on new products/services. Taking into account the fact that technologies transfer and joint works on a technology/product/ service are 2 out of 4 the most rarely indicated goals of cluster structure creation, the small activity of Polish clusters in this area should not be surprising. Entities associated in clusters are still looking for a proper form of cooperation with research and development units and a way for joint work on solutions ready for implementation. Many clusters require professional support in this field because there is a shortage of sufficient knowledge in these structures concerning the choice of the best legal form for the sale of common products or the way of financial accounting of income from such a sale. Additionally, the respondents signalled the limited access to knowledge in terms of legal and practical aspects of innovations implementation and technologies transfer especially in cooperation with research and development units as well as concerning the issues of intellectual and industrial property and the acquisition of licences. It results from the analysis that the access to joint data bases in clusters is limited. Additionally, some part of clusters is not interested in the creation of joint information sources because they do not see benefits connected with possessing such a tool. Admittedly, clusters have data bases but they do not relate to all the areas of joint activity. From the conversations with respondents it did not result that they conducted analysis of needs in this field. In the area of the creation of knowledge and innovations the most intensive cooperation among clusters takes place in participation in joint trainings, workshops, study visits and the exchange of knowledge and experiences (informal) between cluster members. Especially the evaluation of informal contacts of clusters ranks the closest to the benchmark value. Informal cooperation is one of the strongest sides of Polish clusters which is very appreciated by entities which are their participants. Respondents underlined its meaning and described it as one of the biggest added values from the creation of such structures. The cross-section analysis shows that clusters which received external public financing do better in the area of creation of knowledge and innovations than those which did not received such a support. The differences are not big but they indicate potential areas of clusters support as part of pro-cluster policy. Thus, striving to intensify activities which increase the level of knowledge and innovations requires the provision of access to proper financial resources for clusters which will enable it. The analysis also indicates that clusters operating in industries characterised by a higher level of innovations achieve better results in the studied area. The situation is similar in relation to cluster size measured by the number of entities the bigger the cluster the higher the score in the area of creation of knowledge and innovations which indicates the acquisition of the effects of scale. Analysing the area connected with the creation of knowledge and innovations the development level of Polish clusters should also be considered as well as the fact that over 70% of them have cooperated for no longer than 3 years. In this period it was not possible to acquire significant results in this field. Without properly educated cluster structures, proper level of trust among cluster members as well as knowledge shortage in the fields connected with the area of technologies transfer the received results seem to be significant. Also the
118 limited access to public financing for cluster operation (the necessity to put a high own contribution, security of project implementation) contributed to the received score.
119 8. Cluster performance A very important area of cluster benchmarking are their performance. It is important to study how the cluster resources and the processes initiated by them translate into cluster results. Analysis of this area makes it also possible to state which actions initiated under the networks determine to the biggest extent enterprises results. Studies conducted in this area also facilitate the deduction in terms of information concerning cluster characteristics. In particular they verify the answer to the question: actually in which phase of development the clusters are, if the goals defined by clusters are reflected in their results, to what extent does the cluster innovation influence the benefits acquired by them. The area of cluster results consists of the following sub-areas: Development of human resources sub-area Improvement of the competitive position of a cluster (market position) sub-area Improvement of cluster innovativeness sub-area. Cluster internationalization sub-area Below there is a summary of benchmark values and average values for the area Cluster performance Chart 54. Average values and benchmark values for the area cluster performance Benchmark value for the area Cluster Average value for the area Cluster performance performance 6,28 2,17
120 The analysis of the above results indicates huge differences between the studied clusters in the area Cluster results. The received benchmark values are low they amount to from 5 to 7.60 in the scale from 0 to 10. The average value is about three times lower from the benchmark value. Especially in sub-areas Improvement of cluster innovativeness and Cluster internationalization huge differences between clusters taking part in the study are visible. It should be noted that the studied clusters take up a large number of actions directed at the development of their human resources. In each cluster on average about half of employees have higher education and every third employee has been trained in the last 2 years. The basic instruments are trainings organized by clusters and continuous education. Trainings for cluster employees implemented thanks to the membership in the network include both soft and technical skills. They constitute a chance for contact with research and development sector and at the same time also a chance for discussion on the possibility to introduce new solutions to business. For that reason they can also indirectly contribute to the improvement of cluster innovativeness. Development of competences through continuous education is one of clusters strategic goals. It should be taken into consideration that external financing influences the development of human resources because a great number of the organized trainings and courses are co-financed by European Union funds. Improvement of cluster innovativeness sub-area is characterised by a relatively low benchmark value and average score. Only 6 of the studied clusters possess innovations under legal protection. Additionally, cluster implemented not many international research projects which were financed from external sources other than EU funds. The presence of enterprises in a cluster has a small influence on their innovativeness. In this respect the low innovativeness of all enterprises in Poland should be considered only not many more than 21% of industrial enterprises and 15% service enterprises introduced product or process innovations in Comparing the studied clusters with enterprises in Poland the networks devote a larger part of innovativeness outlays for research and development. In Polish companies it is about 8.2% 67 while in clusters 13.7%. Thus, expenditure on research and development among the companies of a cluster is higher than in an average Polish enterprise. Thanks to that in a way the improvement of innovativeness takes place as long as the expenditure translates into new products or process innovations. Despite the fact that the majority of clusters (39 out of 45) conduct activities also on global markets, the share of cluster products sale in those markets is not high, in the majority of cases it is minimal. Membership in a cluster does not influence any change of this situation because clusters, even those initiating international cooperation, in the majority of cases do not seek any new output markets. Thus, enterprises export is not dependant on the membership in a cluster. It can be connected with the initial phase of the development of many clusters and also with a small number of members the majority of Polish clusters are not recognized internationally and their actions are focused on the national market and in many cases regional or local market. Clusters have managed to attract in total 540 new members during the last two years. It means that about ¼ of the members of the studied clusters have joined this structure during the last two years. It should also be indicated that a large number of 1 Innovative activity of enterprises in , Information Note, Central Statistical Office, Industry Department, Statistical Office in Szczecin 2 Education and technique in Poland in 2008, Central Statistical Office, Industry Department, Statistical Office in Szczecin, table 2.12
121 entities has been in a cluster from the beginning of the start-up of their activity. On the one hand it indicates the durability of membership (although there were situations when the members left a cluster) and on the other hand a small cluster dynamics in attracting new participants. Clusters activity did not cause the creation of a large number of start-up enterprises. In total 45 enterprises of this type were created but they were created in 10 clusters. The benchmarking indicators analysis indicates that the current activity of clusters has a strictly limited influence on the increase of competitiveness of enterprises operating in them. Due to this fact attracting new members may be difficult. If the enterprises will not feel the influence of cluster activity on their results they will be discouraged from the membership, and it will also be more difficult to acquire new members. Results in this field indicate that the actions initiated by clusters should be moved in the direction of strengthening enterprises competitiveness. Of course, it also happens through the development of human resources but this fact should also be followed by sales and financial results of member enterprises. In other situation the durability of cluster structures can be endangered unless they will be transformed into centres for employees development and contractors searching. However, Polish clusters have a bigger potential and they at the same time indicate that the increase of competitive advantage of a cluster is a significant strategic goal for them. Products and/or services produced by cluster members are present on many continents although the majority of clusters focus their activity on the national market. In terms of supranational activities clusters initiate cooperation with foreign entities research and development units, other clusters, associations of clusters or innovation networks. A part of clusters seeks for possible contractors on their own, however, in the case of others the presence of this cooperation is dependent on the acquisition of financial resources supporting international activities. Those clusters also quite often took advantage of the possibility to travel on missions or foreign fairs. However, the improvement of cluster internationalization is not treated as a priority activity (the majority of clusters e.g. did not prepare any information about their activity in English). Clusters indicated a positive impact of international cooperation in the form of experiences exchange or even the implementation of joint projects by some of their members together with the members of foreign clusters. However, the cooperation does not translate directly into an increased number of orders or additional financial resources being at clusters disposal. Due to this fact the initiated actions are limited. In the situation when cluster members will not be able to note the impact of international cooperation on their activity the number of actions initiated by clusters in terms of internationalization can decrease Development of human resources The first analysed sub-area connected with cluster results is the development of human resources. The following indicators underwent analysis: Increase of employment in entities operating in the cluster core in the last 2 years The number of the participants of trainings organized in the cluster (for the needs of the cluster) within the last 2 years The number of joint trainings organized in the cluster within the last 2 years The percentage of the employed improving professional qualifications during the last 2 years in entities constituting the cluster core
122
123 Below there is a summary of results for the sub-area Development of human resources. Chart 55. The average value and the highest value of the indicator in the sub-area Development of human resources Benchmark value for the sub-area Average value for the sub-area Development of human resources Development of human resources 7,25 3,35 Benchmark value for the sub-area Development of human resources is quite high and it amounts to It means that for a referential cluster it is the average value of scores of the studied indicators. The average value is also relatively high. It indicates good cluster results in the field of the development of human resources. The studied clusters have experienced an increase of employment in the period of the last two years despite the crisis on the market. Also their employees participated in trainings organized by clusters. Apart from that, a large number of employees improved their professional qualifications through different education systems. Below there is information on the results of the study for particular indicators applied in the sub-area Development of human resources Increase of employment in cluster entities The chart below presents the increase of employment in the cluster core during the last two years. In 3 clusters the employment decreased during the last two years which is connected with the business trends and difficult situation on the labour market. The economic crisis caused a difficult situation in entities being the members of the discussed clusters. Due to this fact the cluster members and its leaders had to decrease the labour force resources, sometimes also through mass dismissals.

124 Chart 56. Increase of employment in entities operating in the cluster core in the last 2 years Despite of a not very easy market situation 74% of clusters have increased, during the last two years, employment from 1% to 6% and in the case of 6 entities the personnel number increased by over 10%. In clusters conducting activity in more innovative businesses the increase of employment was bigger. Respondents indicated that the increased number of workplaces does not result from the membership in a cluster. It is surely connected with a short period of cluster activity in Poland. Participants of trainings in clusters A small number of persons employed in entities being cluster members participated in the trainings organized by clusters. In total during the last 2 years in all studied clusters the inner trainings have included almost persons. Total employment in the entities of all clusters in Poland amounts to about persons, so about 2.4% of their employees were trained. Despite the fact that clusters are active in the area of human resources development, the ratio of the number of trained employees to all the persons employed in clusters is not very high. It is however worth noting that often the management of the enterprises participates in the trainings organized in clusters so a large part of it has been trained. For the last 2 years only in 3 clusters not a single person has been trained. However, in trainings prepared by 78% of the studied entities participated less than two hundred participants. Huge courses for groups of over 800 participants took place only in one cluster. 13% of clusters trained between 200 and 800 participants. Much more participants have been trained in clusters which received financing. Clusters which did not receive such funds cannot usually afford training a huge number of

125 employees. Among clusters which did not receive external support the biggest number of trained employees is 240. All clusters which received financial resources from external sources trained at least several persons. In the case of the remaining sections the following regularity can be observed: the more innovative the cluster s line of business, the higher the percentage of trained persons the more members the cluster has, the bigger the percentage of trained persons. For the last two years in clusters in total 259 trainings have been organized which means that on average 26 persons participated in one training. Both huge trainings (for over 100 persons) and training courses for small groups of employees have been organized. On average, in the last two years, in one cluster over 5 trainings have been conducted. Taking into account the short period of clusters activity in Poland (two of the studied clusters were created only a year ago) the number seems to be surprisingly high. However, one should remember that taking into account the whole employment in entities being cluster members still the percentage of persons trained during trainings organized for the cluster needs is small. Chart 57. Clusters according to the number of participants of trainings organized for cluster needs within the last 2 years

126 Number of trainings organized in clusters Only 5 clusters did not offer joint trainings to their participants. 12 clusters prepared one or two trainings during the last two years. Another 17 clusters, that is 38% of the studied clusters, proposed to their participants from 3 to 7 courses. 18% of clusters had in their offer up to 13 different forms of education. More than 20 trainings were organized by only 2 clusters (4%). The biggest number of organized trainings was 30. Trainings included both the issues connected with possibilities and principles of joint project financing and they concerned business issues. Chart 58. The number of joint trainings organized in a cluster for the last 2 years Below there is an example of the best practice concerning organisation of trainings in a cluster, connected with the preparation of analysis concerning real training needs of cluster members.

127 Best practice 18. Cluster activities based on needs identification Aim: Identification of training needs of companies included in a cluster The Warmińsko - Mazurski Cluster Together Warmer (Warmińsko-Mazurski Klaster Razem Cieplej) In the Warmińsko - Mazurski Cluster Together Warmer the Coordinator, before organizing trainings and workshops, conducted a survey among cluster members for the identification of training needs. The survey encompassed not only the enterprises belonging to the cluster but also the selfgovernment. The study, despite the fact that it was time consuming, brought calculable benefits in the form of acquisition of knowledge on training needs of particular entities. During the cluster history such a survey has been conducted twice. It helped to precisely identify the expectations of particular groups of recipients and in effect to organize tailor-made trainings. Effect: Conducting trainings according to the prepared analysis of needs for companies being cluster members. Improvement of professional qualifications. Among the studied clusters at least a part of employees improved their professional qualifications. In more than a half of 45 studied clusters the percentage of professionally educated persons fluctuated below 24%. 6 clusters were in the range between 25 % and 44%, while in 6 clusters the result was higher than 85%. The average share of persons improving their professional qualifications in the total number of the employed in cluster entities amounted to 34%. It is compliant with national trends because from among persons at the age of every third person on average takes up (continues) any form of educational activity 68, while only 5.5% of people take up formal education (on universities, courses) and the bigger part non-formal (inside a company) and informal (self-education). In one of the clusters due to the specific character of the business 100% of employees improve their professional qualifications. A situation in which education is pursued by a large part of employees takes place especially in clusters operating in more innovative businesses - the higher innovativeness level of the business in which the cluster is operating, the bigger the share of employees improving their professional qualifications among all the employed persons. 3 Education of grown-ups, Central Statistical Office, 2009, p.25

128 Chart 59. The share of persons improving their professional qualifications in the total number of the employed during the last 2 years in entities constituting the cluster core Summary Clusters do not have huge human resources which was presented in the analysis concerning cluster resources. Despite of that, they achieve relatively good results in terms of human resources development. Increase of employment in cluster companies does not result from the participation in the cluster it is not connected with companies development due to cluster activity. It is strictly connected with the development of business and with market tendencies. The average increase of the number of employed in particular clusters during the last 2 years has amounted to 3.8% while in Poland in total 1.1% 69. Thus the tendency of the change of the number of employed persons is more positive than it is for the whole economy. However, it may be connected with businesses in which the studied entities operate as many as 15 clusters operating in highly innovative businesses took part in the study. In those businesses the increase of employment was higher than in traditional ones. The gathered numerical data does not make it possible to state if the changes of employment are caused by the membership in a cluster. However, additional information gained during interviews indicates the lack of such a co-relation respondents indicated market trends as the cause. The above analysis however, does not mean that the membership in a cluster does not influence the development of human resources. The trainings organized by clusters have a positive impact. Some actions in this field were taken in almost every cluster (employees training by a cluster or the improvement of professional qualifications on their own). Relatively 4 Increase of employment between IV quarter of 2009 and IV quarter of 2007 according to CSO coming from the paper Employment and remuneration in national economy in 2009, Warsaw 2010
129 many trainings were organized in clusters. In total almost 250 trainings have been organized during the last two years. In each of them 27 participants took part on average. A large number of conducted trainings was co-financed from European Union funds. Also trainings/workshops were organized during which the cluster employees exchanged their knowledge usually conducted by research and development units being cluster members. However, not in many cases taking up training initiatives was preceded by analysis of cluster needs. The tool seems to be not very popular although it is very useful for clusters, facilitating the trainings planning process. The analysis of clusters training needs would also enable the coordinators to acquire better knowledge on the level of the development of human resources in a cluster. Cluster employees increase their professional qualifications also through other forms of trainings than trainings organized by clusters. It can be education organized in the system of education (e.g. post-graduate studies), as well as commonly available courses. Employees qualifications are also increased through dedicated trainings organized outside or inside the enterprises. The possible method of education, although still not very popular, are also e- learning trainings. The number of people taking part in activities aimed at the increase of professional qualifications is close to the results for the whole economy. Thus, membership in a cluster does not motivate enterprises to greater dynamics of activity connected with the development of human resources. Better results in terms of the improvement of their employees qualifications were achieved by clusters operating in more innovative businesses. These businesses require constant trainings so the companies are familiar with new technical solutions. In the case of production companies also the security and labour quality requirements may require constant education of the employees. If the goal of cluster support policy would be the increase of the level/ quality of human resources in network structures, the application of tools encouraging the organizing of trainings or delegating employees to those trainings seems to be better than direct financial support. It would also be worth to extend cluster knowledge on the access to trainings co-financed from European Union funds. Currently the knowledge is often limited especially among micro and small enterprises. Thus, a significant task for the coordinator should be, apart from the study on training needs among cluster members, the monitoring of available trainings which could be interesting for clusters Improvement of competitive position Under the sub-area Improvement of competitive position analysis was carried out on the following indicators: Share of cluster s products/services sale in the foreign market The number of new participants of a cluster during the last 2 years (institutions and enterprises attracted to a cluster) Number of start-ups in a cluster Below there is a summary of results for the sub-area Improvement of competitive position
130 Chart 60. The average value and the highest value of the indicator under the subarea Improvement of competitive position Benchmark value for the sub-area An average value for the sub-area "Improvement of competitive position" "Improvement of competitive position" 5,00 1,95 Benchmark value and the average value for the sub-area Improvement of competitive position are not very high. To a large extent it is the result of a small number of start-ups in clusters. This type of companies is usually created in high tech sectors and 1/3 from among the studied clusters conducts its activity in highly innovative lines of business. The share in foreign market of the sale of products and services offered by cluster members is small which indicates small recognition of the studied clusters in international environments. Clusters managed to attract new participants which proves their dynamism and the growing structure. It is also the potential for their future growth because having a larger number of members they can have a bigger influence on the surrounding. However, not only the number of members but also their activity is important. It will be characterized in the next chapter. Below the results of the analysis for particular indicators under the sub-area Improvement of competitive position are presented. The share of cluster s sale in the global market According to the information gained during interviews clusters focus above all on the sale of products and services on the domestic market. 7 clusters do not export any products. The great majority constituting 80% of the studied clusters (36 clusters) evaluated its international activity as low, in the range 1-10%, usually closer to 1% (measured by the share of cluster s products/services in the foreign market).
131 Despite of that, in the case of some products usually from the aviation industry Polish clusters are among the global monopolists. In general however, the majority of clusters have a minimal share in the global market. Only one cluster was in the range 11-2-% and one in the range 40-50%. Both those clusters are structures consisting of at least 60 entities. An important conclusion from the above analysis is the fact that the majority of clusters conduct activity also beyond Polish boarders. However, their influence on the global market is minimal. None of the studied clusters can boast itself with a visible influence on global trade. Thus, Polish clusters still have a long distance to e.g. Silicon Valley or vineyards of Bordeaux region. Polish clusters are characterised by a short period of functioning. The low value of the indicator connected with the participation of a cluster in a global market shouldn t be surprising at the moment. Other benchmarking studies should indicate if this situation changes. Chart 61. Number of clusters according to the share of products/services sale in the foreign market. The difficulties connected with acquiring data for the discussed indicator should be considered because clusters do not have the knowledge concerning the share of the sale of their products or services in the global market. Acquiring such information would require full analysis of the business (and its income) on the whole world which would be very expensive for the Polish clusters. New clusters members Only 3 out of 45 of the studied clusters for the last two years have not attracted any new members. It results from two factors lack of cluster openness to new members and also the stagnation in some clusters which discourages the new participants from becoming a cluster member. On average each cluster during two years expanded its structure by 12 new
132 entities. The number also takes into consideration the situations when cluster members withdrew from the membership mainly due to the fact that the cluster did not fulfil the expectations connected with it (especially concerning the possibility of gaining new projects) or because of the closing of business activity by a company. Clusters managed to attract both enterprises as well as research units. 11 clusters gained from 13 to 24 new members, and another 3 from 25 to 34 new members. Two clusters have the number of new members amounting to 35 or more entities (maximal number of new participants amounted to 40). The analysis results indicate that those of the clusters which operate on the market for the shortest period attracted the smallest amount of new members. Chart 62. The number of clusters according to the number of new participants of a cluster during the last 2 years (institutions and enterprises attracted to a cluster) There is a positive relation between the amount of the received external funds and the number of new cluster members. The possibility to participate in new projects without the necessity to incur high own costs is the factor which attracts entities to a cluster. The crosssection analysis indicates also that more new members were attracted by bigger clusters and those operating in more innovative businesses. Start ups in clusters In clusters which operate the most dynamically new initiatives can be created, the so-called start-ups. These are enterprises starting their activity from a scratch. The term characterises a stage of enterprise s development which is the newly established company (most commonly a small one) which introduces and develops its product on a market and gathers marketing data.

133 The stage lasts usually no longer than one year. Their establishment requires small financial costs but at the same time their survival is burdened with higher risk 70. In total the establishment of 26 new enterprises has been noted. In general, however, only in few clusters the establishment of start-up enterprises was successful (in 35 clusters start-ups were not created). Chart 63. Number of clusters according to start-ups number in a cluster It results from the analysis of the chart above that 10 such new entities were created only in one cluster. In five clusters one start-up (in each cluster) started operating. The analysis of the study shows that the created companies are most of all small partnerships operating for the benefit of the cluster supporting the implementation of projects or providing advisory services. Their number is not related with the received external funds, cluster size nor with the innovativeness level of the business in which the cluster operates. Summary The average evaluation for the sub-area Improvement of competitiveness amounted to 1.95 and it was one of the lowest among all studied areas and sub-areas. Benchmark value amounted to 5.00 for this sub-area and it indicates very low values gained even by the referential cluster. Such low values connected with small activity of the great majority of clusters beyond national borders (indicator Share of the sale of cluster s products/services in the foreign market ) and with a very small number of start-ups which were established in the studied clusters. Clusters do not always take advantage of the possibility to enter foreign markets which is caused by a short period of cluster activity and the lack of critical mass 5 innovative academic entrepreneurship- global experiences, J. Guliński, K.Zasiadły, Polish Agency for Enterprise Development, Warsaw 2005, p.18
134 connected with the number of members which would enable them to initiate such costly activities (without the necessity to engage additional support from external sources). It is especially important in the case of micro and small enterprises which without such a support will have a very difficult entrance to foreign markets. Establishment of a start-up may be limited due to cluster s lines of business activity. Also the fact that a cluster is not recognized on a global market not necessarily means that it does not have a significant competitive position on the national market. It should however be stated that the studied clusters usually do not have such a position. They are not always recognizable on the national market and even among enterprises from the same line of business. The activities initiated by clusters so the limited activity in terms of joint offer, distribution or one standard product of a cluster to a limited extent influence the improvement of competitive position. Even joint activities in terms of marketing are rather aimed at the promotion of a cluster than directly at the influence of the improvement of the situation of its members. Thus, the small results in terms of the improvement of competitive position are the effect of a small number of initiatives taken up in this field. Due to the above attracting new members to a cluster is limited. It is mainly influenced by a low sense of advantages by the present, potential and future cluster members. The declared benefits concern more the cooperation or human resources development than the improvement of the enterprises results. In this situation the durability, at least of some cluster structures, can be endangered. Respondents indicated cases when members withdrew from a cluster when they recognised that the acquisition of calculable benefits requires own contribution (time and financial contribution). Therefore, the activities concerning the acquisition of new members should be intensified. The main factor motivating, increasing the force of attracting new members would be the improvement of competitive position of current cluster members. Another solution is the application of direct promotion activities towards potential members (although without the indication of benefits attracting them will not be easy). The most important factor building the potential of Polish clusters are active coordinators who are striving to increase the competitive advantage of clusters. As the results of the cross-section analysis indicate, there is a relation between the amount of acquired external funds by a cluster and the improvement of its competitive position. Clusters having external funds at their disposal can in an easier way attract new members encouraging to participation in joint projects. A similar relation occurs between the innovativeness level of a line of business and the competitive position in more innovative lines of business there is a higher probability of start-up establishment. However, during the interpretation of the results one should remember about the limitations which are the applied indicators which to a small extent are directly connected with the competitive position of a cluster.
135 8.3. Improvement of innovativeness Under the sub-area Improvement of innovativeness the analysis included the following indicators 71 : Number of innovations under legal protection introduced in a cluster during the last 2 years. Share of expenses on R&D in the expenses on innovative activity in entities constituting the cluster core (during the last 2 years). The number of joint projects implemented (submitted) co-financed from EU resources. The number of joint international research projects, financed from other external sources. Below there is a summary of results for the sub-area Improvement of innovativeness. Chart 64. The average value and the highest value of the indicator under the subarea Improvement of innovativeness Benchmark value for the sub-area The average value for the sub-area Improvement of innovativeness Improvement of innovativeness 5,25 1,31 6 The indicator the number of innovations introduced in the last 2 years by entities operating under a cluster was withdrawn from the study due to the difficulties with acquiring reliable information.
136 Similarly as in the case of the improvement of cluster competitiveness the results in terms of the improvement of their innovativeness are low. The referential cluster gained a benchmark value equal to 5.25 while the results average amounted to 1.31 on the scale Such low values of indicators are connected with a small number of activities initiated by clusters in terms of improvement of innovativeness. A small number of clusters took under legal protection the drawn up innovations, similarly there were not many participants of international research projects. Expenses on research and development among innovative activities are higher from the average for the whole economy while part of clusters doesn t conduct research and development activities at all. Only the number of joint projects implemented from EU funds is not low although the participation in them is for many clusters limited due to difficulties connected with the provision of own contribution. Below there are the results for particular indicators under sub-area Improvement of innovativeness. The studied clusters represent very different lines of business from traditional production and services to high tech industry. Due to this fact a division of clusters was carried out considering the innovativeness level of the line of business in which they operate, measured by the R&D intensiveness level in a given sector of production or services. Each cluster has been assigned to one of the following categories: Clusters operating in highly innovative lines of business among the studied population there are 15 such clusters. Clusters operating in lines of business of medium innovative level among the studied population there are 19 such clusters. Clusters operating in low innovative lines of business among the studied population there are 13 such clusters. Number of innovations under legal protection The general number of innovations introduced by clusters which are under legal protection can be evaluated as low. Among the analysed clusters the great majority as many as 40 of them during the last two years did not put under protection even one innovation while the maximal recorded result were 5 patented solutions. It should however be indicated that the low number of innovations under legal protection can also be the result of reluctance of innovations authors to the revelation of solutions through the publication of patent claims. Because of that the lack of formally admitted patents and other forms of legal protection cannot be the base for categorical statement about not drawing up innovations by a cluster.
137 Chart 65. Number of innovations under legal protection introduced in a cluster during the last 2 years. The fact that all clusters which in the analysed period put under protection the intellectual property drawn up by them were qualified to the group of those whose businesses show medium or high innovativeness level can prove the correlation of the level of the business s innovativeness in which the cluster operates with the number of solutions reserved by the cluster. Also the best two results that is 4 and 5 reserved innovations were put under legal protection by clusters operating in businesses with the highest level of innovativeness. Nevertheless, it should be indicated that the majority of entities assigned to this group in the analysed period did not manage to put under legal protection any solution drawn up by it. The number of recorded patents under legal protection in 2008 amounted to At that time in Poland about 3.7 million of economic entities were operating and thus one out of about 2.5 thousand entities received legal protection of the recorded patent. During the last two years 14 innovations were put under legal protection so 7 per year. Taking into account the number of enterprises operating in clusters included in the study amounting to 1469, one per about 210 enterprises recorded its innovation and acquired a patent. It indicated a much more often registration of patents than in the case of enterprises which aren t the members of a cluster. It is an observation indicating the improvement of enterprises innovativeness due to the membership in a cluster although the study indicators do not directly show it. It is difficult to unequivocally define the direct impact of the reception of external resources by clusters on the number of modern solutions drawn up by them. From among 5 clusters which reserved themselves the rights for developing innovations, three gained external financing. Expenses on R&D The results of interviews showed that two thirds of clusters devotes for research and development less than 10% of the budget devoted for the support of innovative activity and 7. Education and technique in Poland in 2008, Central Statistical Office, Statistical Office in Szczecin, p. 245
138 among them 13 clusters do not devote any funds for this activity because they don t conduct it. Among the remaining the biggest number is represented by clusters devoting for this purpose up to 30% of resources. Whereas, a small group was constituted by clusters for which the activities connected with research and development constituted the majority of budget allocations devoted for innovative activity. The biggest two shares are 75% and 85% respectively. Nevertheless, it should be indicated that even those two clusters did not succeed in the last two years in putting under legal protection any innovation developed by them. In this category, with five reserved solutions, the leader was the cluster devoting for research and development only 20% of its budget for innovations. The average level of expenses for this purpose among all respondents amounted to 14%. Production enterprises in Poland devote on average 8.1% 73 of costs connected with innovative activity to research and development. In the case of service enterprises the share is 7.4% 74. In comparison with the above results the studied clusters devote a much bigger part of their expenses connected with innovative activity to research and development. Those expenses should translate into a higher level of innovativeness of enterprises being cluster members than those not belonging to those structures. Chart 66. Share of expenses on R&D in the expenses on innovative activity in entities constituting the cluster core (during the last 2 years) The analysis showed that the share of financing research and development in the expenses on innovativeness is partially dependant on the level of innovativeness of cluster s line of business. From among 15 respondents devoting for this purpose more than 10% of its budget on innovative activities, two thirds belonged to the group operating in the lines of business with a high level of innovativeness. Additionally, the average share of expenses on research and development in this group (27%) 8 Innovative activity of enterprises in , Information Note, Central Statistical Office, Industry Department, Statistical Office in Szczecin 9 a.b.
139 was almost twice as big as the average for all clusters (14%). The issue of external funds turned out to be also important. Only three out of 15 mentioned clusters did not receive any external financial support. Thus, if the goal of the policy of clusters support is also the increase of innovativeness of cluster members which can happen through the increase of expenses on research and development, the external financial support is important for the achievement of the assumed goal. It should however be noticed that the amounts of the total budget devoted for innovative activities differ in particular clusters so in the case of some of them devoting even relatively small percentage of those resources for research and development may translate into high nominal amounts of research activity financing. As it was already mentioned many times before, still a low share of expenses on R&D may result not only from financial limitations of the clusters but also from the lack of ideas concerning such studies for the line of business in which the entity operates. The number of joint projects co-financed from EU resources From among the participants of the study almost a half implemented joint projects cofinanced from European Union resources. On average all the analysed entities implemented at least 1 joint project and the best of them conducted as many as 14 such activities. Clusters which had the biggest number of joint projects were the entities qualified to the group operating in businesses with a high level of innovativeness. Each of them implemented on average 2 such activities. Projects implemented by clusters most often included the implementation of trainings and financing of external advisory services and activities aimed at tightening cooperation among cluster members. They also concerned the initiation of research and development activities and export activities. Very rarely they were aimed at the purchase of new technologies. Chart 67. The number of joint projects implemented (submitted) co-financed from EU resources Also the size of clusters was correlated with the number of joint projects. The highest average of jointly implemented activities was characteristic of respondents gathering more than 60 entities. Nevertheless, the example of a cluster which implemented the biggest number of joint projects shows that also small clusters (having up to 30 members) can successfully
140 cooperate during the implementation of projects co-financed by European Union. Additionally, clusters also very often supported their members in preparing applications for projects encompassing selected actions. Clusters reported many difficulties connected with the process of the preparation of applications as well as with the complicated procedures of gaining resources from programs financed from European Union resources. They also indicated insufficient support in terms of trainings and advice on the part of institutions giving such support and the business surrounding institutions. As it results from the conducted interviews clusters showed little activity in international research projects financed from other external sources than European Union funds. Only 9 of them conducted such activities (more than 1 such a project was implemented only by 2 clusters). Clusters conducting such projects mostly belonged to the group of lines of business with high level of innovativeness but at the same time clusters significantly differed with each other by the number of gathered entities. Chart 68. The number of joint international research projects, financed from other external sources Summary An average grade for the sub-area Improvement of innovativeness' amounted to 1.32 and it was the lowest average among all the studied areas and sub-areas except for Cluster financial resources. Benchmark value for the discussed sub-area amounted to Cluster which gained this value is the cluster which gathers less than 30 entities, received external resources in the amount below 1 million PLN and it operates in a highly innovative line of business. In this sub-area there are two out of three the worst evaluated indicators under the study that is the number of innovations under legal protection introduced in the cluster in the last 2 years and the number of joint international research projects financed from other external sources. A large number of clusters does not initiate any activity (or it is minimal) in terms of research
141 and development activities. As many as 7 clusters received zero value for all the indicators so those clusters in the last two years did not introduce any innovations under legal protection, do not devote any expenses on research and development and they did not implement joint projects co-financed from EU funds or other international research projects, financed from other external resources. However, it does not mean that they did not introduce any innovations in their activity. Also the indicator concerning the number of jointly implemented projects financed from European Union funds is one of the worst evaluated indicators under the study. Respondents indicated many difficulties connected with the preparation of applications for cluster projects and acquisition of grants as well as with accounting the granted funds, including: the lack of clear criteria and conditions for acquiring financial support, Adjudicating contests or their total annulations without giving any reason by institutions implementing particular programs past the deadline, lack of foreseeing the decisions made by the bodies giving grants and constant changes in the financing principles, Project regulations requiring the participation of all cluster members (even when a project includes only a part of entities in a cluster) or the durability of investment for at least 5 years, requiring a too high own contribution and at the same time reluctance of entities to co-financing of projects, especially at the beginning of cluster activity, complicated and laborious accounting of de minimis aid, the obligation of giving detailed data about particular companies of the cluster, not taking into account applications and beneficiaries propositions in terms of changes concerning contests. As the results of the cross-section analysis indicate, there is a direct relation between the amount of acquired external funds by a cluster and the improvement of its innovativeness. A similar dependence occurs between the level of innovativeness of cluster line of business and the improvement of innovativeness. It is not surprising that clusters operating in more innovative lines of business devote bigger amounts for research and development. Undoubtedly, the area of the improvement of innovativeness should be included in the area whose improvement requires both the initiation of clusters activities but also the support of external public institutions. Despite the low benchmarking values and the average of indicators worth noticing is the fact that in terms of the improvement of innovativeness, enterprises being clusters members do better than other Polish enterprises (although Polish companies present poorly against the background of European Union). The share of expenses for research and development is higher and also relatively more innovations were put under legal protection. This observation can be surprising taking into account small infrastructure resources of clusters and also small number of activities taken up in terms of the introduction of innovative solutions. However, it should be taken into account that some of the projects implemented in clusters co-financed from EU funds required granting a proper amount for research and development or placing such a criterion in the project evaluation.
142 8.4. Clusters internationalization Under the sub-area Clusters internationalization the following indicators underwent analysis: Number of foreign markets (countries) where the enterprises from a cluster are present 75. The share of export in the structure of the sale of cluster s products. The number of formal agreements on cooperation of a cluster with foreign entities. Number of participation in fairs, international exhibitions, cluster trade missions in the last 2 years. Number of publications in a foreign language (business materials, the press) in the last 2 years. Below there is a summary of results for the sub-area Clusters internationalization Chart 69. Average value and the highest value of indicator under the sub-area Cluster s internationalization Benchmark value for the sub-area Clusters Average value for the sub-area Clusters internationalization internationalization 7,60 2,04 10 in order to facilitate the analysis and also increase the reliability of the received data the number of countries during scaling for the calculation of the benchmark was changed into the number of continents
143 The value of the benchmark connected with clusters' internationalization is quite high in comparison with the remaining discussed in this area results of clusters. However, the much lower average value indicates big differences between clusters connected with their international activity. Products offered by clusters members are present on many foreign markets although in the majority of cases the share of export in the structure of a cluster's products sale is not high. The majority of the studied clusters are focused on the sale on the national market and not many of them seek for the possibilities of the expansion of outlet markets e.g. through conducting research on demand abroad. There are significant differences between the studied clusters in relation to the number of formal agreements on cooperation of a cluster with foreign entities. A large part of clusters (19 entities) have not participated for the last two years in international events (fairs, study visits, trade missions). 75% of the studied clusters have at least one publication prepared in a foreign language while the initiation of activities of cooperation with foreign units requires each cluster to have such a publication about themselves. Low values of the studied indicators are connected with the low rank improvements of international competitiveness of a cluster among its strategic goals. Below the values of particular indicators under the sub-area Cluster s internationalization are presented. Number of foreign markets where the enterprises from a cluster are present The large amount of foreign markets where the enterprises being members of the studied clusters are present should be positively evaluated. Only in seven clusters there are enterprises operating only on the national market while the members of the remaining clusters also possess foreign recipients. The most popular direction of export were the European countries however a large part of clusters operates also on other continents. Chart 70. Number of foreign markets (continents) where the enterprises from a cluster are present
144 As many as 6 clusters can boast about global presence which can prove the high involvement in international cooperation of the entities associated around them. Those clusters were mainly included in the group operating in businesses with the highest level of innovativeness and their members were, with one exception, at least 30 entities. The correlation between the innovativeness level of a cluster s line of business and the range of cluster s activity can also be confirmed by the fact that all the analysed clusters whose lines of business are characterised by the highest level of innovativeness had their foreign outlet markets. As many as two thirds of them exported their products to at least three continents. The share of export in the structure of the sale of cluster s products The high international activity presented on chart 56 is confirmed by data on the share of export in the total sale of clusters products. As many as 17 respondents admitted that they sell abroad over 10% of their products and the average value for all analysed clusters is 20%. Also this summary confirms a better international position of clusters whose lines of businesses were classified as highly innovative. Six out of seven best results that is export on the level of from 50 to 95% belonged to entities operating in the most innovative lines of business. Also the number of entities associated under clusters was significant here. The highest share of export was characteristic of the most numerous of them. Chart 71. The share of export in the structure of the sale of cluster s products Although the products coming from Polish clusters are not well recognizable in the global economy, the share of export in the structure of cluster s sale is important. For some clusters it is the basis of activity of its members. The presence of cluster s members on many international markets indicates their high potential connected with the possibility of increasing the sale of its products. Foreign experiences of entrepreneurs are also important for the international cooperation for example in terms of technologies transfer. Export of products by cluster s companies enables them to get new experiences, including, among others, better noticing of clients needs which can also influence the innovativeness and improvement of the products quality. The export activity also decreases the susceptibility to
145 the economic situation on the national market. Due to the above the sale of products by cluster s members on international markets is an enriching experience which should be shared by the biggest possible number of companies in a cluster. The number of formal agreements on cooperation of a cluster with foreign entities The results of interviews show that except for the international contacts of purely commercial nature clusters also develop cooperation on partnership rules, directed, inter alia, to the exchange of knowledge. Such activities were recorded in 22 respondents and each of them had on average at least 4 agreements on cooperation with foreign entities. Among them the strongest group was constituted by clusters involved in only one agreement but also the result of 28 signed agreements and deals was recorded. Chart 72. The number of formal agreements on cooperation of a cluster with foreign entities Among respondents having no agreements on international cooperation the majority was constituted by entities with relatively low size and those which do not take advantage of external financing. Whereas, among the signers of more than two of such deals the clusters whose lines of business are characterised by high level of innovativeness are most numerously represented. However, signing the agreement on cooperation with a foreign entity and most often de facto with a foreign cluster does not mean the initiation of a real cooperation. Clusters, sometimes at their own request sign agreements on cooperation. However, they do not end up with the initiation of joint activities. In the meantime, supranational cooperation with under clusters can bring many benefits:


146 exchange of experiences which can suggest possible further directions of development or the way of implementation of technologies transfer, exchange of knowledge, e.g. through joint trainings, the possibility of better understanding of foreign markets and clients needs, searching for the possibility of joint production and separate sale (in the majority of cases Polish clusters are not competitive for foreign clusters), joint applying for external financial resources, increase of cluster s prestige. The examples of achieving the above advantages are the presented below cases of clusters cooperation with other clusters on national and international level. Best practice 19. National and foreign cooperation with other clusters Aim: Increase of cluster s prestige and the increase of the possibilities of its activity (financial, organizational, marketing activity) Active cooperation with other clusters from the same line of business increases the influence of knowledge, recognition (also international), exchange of experiences and the possibility of access to research and development units. An example of cluster cooperation in the country is the cooperation of a small Polish Cluster of Renewable Energy with a relatively huge Baltic Eco-energetic Cluster. The effect of this cooperation is meetings in the Polish Cluster of Renewable Energy with the representatives of universities from outside of the cluster - two-hour trainings on the subject chosen by the cluster. Additionally, the members of the cluster are assured the contact with other entities operating in the same line of business. Thanks to that their activity increases and new ideas for activity are born. Silesian Water Cluster initiated international cooperation with a Spanish cluster with similar profile of activity. The cooperation was formalized by the signing of a letter of intent between the water cluster coordinator and Catalan Water Partnership in Barcelona. Despite the short cooperation between clusters it is reach in the exchange of experiences. Under the cooperation meetings are organized which are aimed at the initiation of cooperation with entrepreneurs from waterworks industry. Also a joint waterworks panel at the International Economic Congress was prepared. Another good example of cooperation with foreign entities is the West Pomeranian Chemical Cluster Green Chemistry. It initiated contact with a German agency Zukunfts Agentur Brandenburg in Frankfurt upon Oder and the German cluster Kunststoff - Verbund Brandenburg Berlin (KuVBB). Cooperation between entities translates into the
147 exchange of experiences between entrepreneurs which, above all, is conducted during conferences and cooperation exchange Chemika, co-financed by the German partner. Effect: Trainings on the subject chosen by the cluster, meetings and exchange of market information, exchange of experiences in terms of the activity of the Polish cluster s equivalent abroad, increase of prestige through the maintenance of contacts with the foreign cluster, division of costs of joint undertakings. Amount of participation in fairs, international exhibitions, trade missions In the last two years the majority of the study s participants decided to promote and develop contacts through the participation in at least one international event of commercial nature. Among them the most numerously represented were clusters gathering over 30 entities and those which managed to gain financial funds from external sources. Chart 73. Amount of participation in fairs, international exhibitions, cluster trade missions in the last 2 years Large number of travels was financed from external sources. In this case important was also the level of cluster's business's innovativeness. From 26 respondents who in the analysed period participated in international event of a business nature only 6 belonged to the group operating in lines of business with lower level of innovativeness. Number of publications in a foreign language The conducted interviews showed that over 75% of clusters published during the last two years at least 1 publication in a foreign language. However, it should be indicated that almost a half of them managed to publish only one such document and results at the level higher than 5 publications were recorded by only 3 clusters. Between those extreme groups
148 there is a relatively numerous group of 17 respondents for whom the number of publications in the analysed period was in the range between 2 and 5. Those publications are usually folders and leaflets of a cluster translated into other languages for trips to trade missions, study visits or fairs. They also include articles on clusters published in external press (paper and internet). Among the clusters which did not publish in any foreign language are mainly those associating up to 30 entities and those which did not receive any external financial resources. What is interesting, for 11 clusters in this group as many as 9 were characterised by medium or high level of innovativeness of their line of business. Chart 74. Number of publications in a foreign language (business materials, the press) in the last 2 years Despite the fact that part of the cluster members participates in international commercial exchange, 11 clusters do not have any information about themselves prepared in a foreign language and some of the remaining clusters have only leaflets in one language containing basic information. The lack of this information hinders contacts with international clusters. It can also have negative impact on potential trade expansion of the cluster beyond the country. Due to this fact clusters should prepare marketing materials also in at least one foreign language. Especially considering the fact that the majority of them received good grades in terms of marketing and PR. Summary An average grade for the sub-area Cluster s internationalization amounted to In the cross-section of the whole area Cluster s results the average does not seem to be low. However, it indicates huge shortages in cooperation of a cluster with foreign entities both at the level of individual members of a cluster which to a large extent focus on the national market and at the level of the whole clusters which rarely take advantage of the possibility of cooperation with foreign entities. Often the possibility depends on the reception of external financial resources. The presence in a cluster does not have a big influence on the creation of new, foreign outlet markets and such a possibility should be used by clusters. Also cooperation with foreign entities is often only a cooperation on the paper. However, it could
149 initiate real actions giving the clusters members benefits in the form of new clients or contractors. Benchmark value for the discussed sub-area amounted to Cluster which gained this value is the cluster which gathers over 60 entities, received external resources in the amount above 1 million PLN and it operates in a highly innovative line of business. As the results of the cross-section analysis indicate, there is a relation between the amount of acquired external funds by a cluster and cluster s internationalization. Similar relation occurs in the case of the level of the business s innovativeness. However, nothing stays on the way and clusters operating in traditional less innovative lines of business have taken up more actions on international level. Similarly, the issue of financial resources should not be a problem at least in relation to cooperation with other clusters. Many cluster members participate in international commercial exchange. However, clusters themselves put a limited value to the cooperation with foreign units. Initiated actions in terms of internationalization (and in many cases not initiated) and also low evaluation of the strengthening of international position of a cluster as a goal of strategic activity indicate that this area, from the clusters point of view, is not very significant and poorly appreciated. However, the active actions of some clusters on this field bring calculable effects exchange of experiences, the possibility to participate in international projects or the acquisition of better information of foreign markets. Because of that it seems that clusters lack the awareness in terms of the possibility of using foreign experiences in their activities. The increase of this awareness would surely cause a better evaluation of clusters in terms of internationalization and also the use of those possibilities. The effects could be the increase of cooperation in terms of research, transfer of technologies from abroad, increase of export or finding cheaper suppliers of raw materials from other countries, better integration of cluster members and many more.
150 9. The growth potential of clusters The next area covered with the benchmarking analysis was the growth potential of clusters. This area involved verification of factors (both internal and external) influential to the cluster s development. Information analysis within this area allowed to evaluate conditions favouring the development of individual clusters in Poland and having influence on restricting their activity. The area of the growth potential of clusters consists of the following sub-areas: Sub-area: Regional predispositions" Sub-area: Public authorities policy in favour of the development of the cluster Sub-area: Institutional surrounding Sub-area: Leadership in the cluster The summary of benchmark values and average values for area of the growth potential is shown below. Chart 75. Average values and benchmark values for area of the growth potential Benchmark value for area "The growth potential" Average value for area "The growth potential" The analysis of the above results indicates that there is divergence between researched clusters in area the growth potential. These divergences may have several causes to high degree they will depend on the geographical location of the cluster as much as three of
151 the researched sub-areas (apart from leadership in the cluster) are strongly connected with regional development and local policy. Benchmark values received are quite high. It appears that the growth potential of clusters is quite high especially the possibility to use regional predispositions and activities of the coordinator and members of the cluster in leadership. Quite high benchmark value and average value was noted in the case of sub-area Regional predispositions. It covers geographical and environmental predispositions, region s traditions and infrastructure. Education and accessibility of qualified workers is also important. Especially the last two points were subject to animated discussion during interviews. The respondents pointed out that there are substantial differences between market demand for experts and what Polish career opportunities can offer. It concerned all levels of education vocational, technical and higher education. There were also large differences in evaluations in area of "regional predispositions". Voivodeships in the western part of the country came out the best, especially: Dolnośląskie, Kujawsko-Pomorskie, Opolskie and Śląskie. Regional predispositions for the cluster s development in eastern voivodeships were evaluated much worse, especially in Podlaskie, Świętokrzyskie and Mazowieckie voivodeships. Sub-area: Public authorities policy in favour of the development of the cluster was given the lowest average value. In addition, there were huge differences in the evaluation given by clusters. On one hand, some clusters praise their cooperation and assistance from public authorities, especially from self-government. On the other hand, other clusters pointed out it were self-government that made it hard for them to create the cluster. This discrepancy, similarly to many other cases in area of the growth potential is to a large degree connected with the cluster s geographical location. Particularly low evaluations regarding the influence of public authorities policy on the cluster s development were given by clusters in voivodeships: Mazowieckie, Lubelskie and Świętokrzyskie. The cooperation with authorities and their influence on the growth potential of the cluster was given the best mark in voivodeships: Śląskie, Kujawsko-Pomorskie and Warmińsko-Mazurskie. Clusters that received external funds took a more positive standpoint on the influence of public authorities on the cluster s development. Likewise, higher evaluations in the discussed sub-area were given by clusters operating in sectors having medium and high innovation. In sub-area Institutional surrounding average value is rather high and benchmark value is relatively high. Indicators used in this sub-area refer mostly to the cooperation with R&D institutions, business support institutions, as well as all entities influencing the activity of the cluster as a structure concentrating economic entities (banks, insurers, et al.). Large regional differences were also found in this area clusters located in border voivodeships in western, southern and northern Poland evaluate the influence of this cooperation on the cluster s development much better than clusters located in central and eastern Poland. The lowest evaluations were given by clusters operating in voivodeships: Lubelskie, Mazowieckie and Opolskie; whereas the highest in Dolnośląskie, Pomorskie and Zachodniopomorskie. The best result in the growth potential of clusters was in sub-area Leadership in the cluster, both in the case of benchmark value and average value. Therefore this area is placed quite high as a potential one to be used to ensure permanent growth for clusters. However, you have to consider high subjectivity, especially in that sub-area.
152 9.1. Regional predispositions The value of the following indicators was studied within sub-area Regional predispositions : The potential and economic traditions of the local environment. Availability and mobility of highly qualified employees. Investment attractiveness of the region (developed areas, investment offers, municipal infrastructure, etc). Openness of the entrepreneurs environment for cooperation. Availability of the natural resources (including raw materials). The summary of the results for sub-area Regional predispositions are shown below Chart 76. Average value and highest value of the indicator within sub-area Regional predispositions Benchmark value for sub-area Regional predispositions Average value for sub-area Regional predispositions Within sub-area Regional predispositions the highest result 10 points - was given to 3 indicators, whereas 2 indicators did not receive the highest assessment in any clusters. Within this sub-area the best result came out for the indicator of the potential and economic traditions. However, the potential of individual regions was not assessed as high by all clusters, and so this indicator did not reach benchmark value. A similarly high result was obtained by the indicator concerning Investment attractiveness of the region, which makes it possible to
153 conclude that the infrastructure available in Poland is assessed quite high. The indicator related to the availability of the natural resources (including raw materials) looks worst, which seems obvious due to diverse cluster sectors in Poland and their locations. Particular attention however must be drawn to the result for the indicator referring to entrepreneurs openness for cooperation. The maximum evaluation in this respect amounts to 8 points which means that still among entities in Poland limitations of the possibilities to start cooperation are visible. A detailed analysis of indicators within sub-area Regional predispositions is presented below The potential and economic traditions of the local environment The chart below visibly shows the dependence between the growth potential of the cluster and historical and economic traditions of its location. Almost 80% of clusters chose score 6 or more; therefore according to the respondents the traditions of the local environment influence the growth potential of the cluster (some even referred to the interwar tradition). Cooperation experiences which favour mutual trust in these regions where this cooperation lasts for decades are particularly important to the development of clusters. The decisive factors named were an established industrial culture, the lie of the land, raw materials available and the R&D base. Average evaluation for this indicator was One cluster granted the highest evaluation. Chart 77. The potential and economic traditions of the local environment Score from 1 to 10 The analysis of results allows to infer that economic traditions of individual regions had a direct influence on the creation of over 60% of clusters in Poland. Some entities utilized a longstanding cooperation history which was started before the decision to create the cluster was taken. Certain entities utilize traditions connected with advantages of a given region (e.g. the promotion of regional dishes, tourist attractions) or its history. Using the said potential of individual regions was often mentioned as a success factor of the cluster. In some clusters the attention was drawn to the importance of earlier connections of the present cluster members as an important factor of creating trust and reinforcing the current cooperation. Undoubtedly the utilization of the potential and economic traditions of the local environment is one of the
154 factors facilitating ties of cooperation and it decides about success of a given cluster structure. This process proceeds much more difficult in the case of entities which do not utilize such potential. The examples of best practices connected with utilization of the regional potential for the cluster s operation is shown below. Best practice 20. Utilizing the regional potential to create market offer for the cluster Cluster of Restaurateurs and Hoteliers Aim: Broaden the offer of products utilizing a special region s potential The members of the Cluster of Restaurateurs and Hoteliers broadened the scope of dishes offered by regional dishes. Initially they collected information about dishes typical for the region, and then chose a few of them and officially registered their names. The cluster appears at outdoor culinary events several times in the year and promotes its products. During these meetings the cluster s members also run workshops on cooking regional dishes. Such activities on one hand promote the culinary sector, and on the other they strengthen the value and importance of national regional products which helps promote knowledge about the Lublin cuisine. Result: Make a better opportunity to promote the cluster s products by associating its activities with what is unique in the Lublin region. Best practice 21. Utilizing the advantages of the natural environment for the benefit of the cluster s activities Vistula River Renewable Energy Cluster Baltic Eco-Energy Cluster Aim: Utilize natural conditions to develop clusters and strengthen the eco-energy sector The creation of the Vistula River Renewable Energy Cluster is strictly connected with rich natural resources present in this region. Due to the location in the Vistula catchment area, the cluster s members benefit from the access to hydropower, from natural incidence of coppice used to produce biomass, as well as due to its location in one of the most windy regions of Poland they use wind energy. The concentration of companies from the renewable energy sector is the best proof of high potential of the natural environment. Natural resources of the region are also extremely important for the Baltic Ecoenergy Cluster. The cluster deals mostly with the development of technologies using renewable energy and biomass sources. The location of the cluster makes it possible to produce energy using energy sources available in the region (solar, wind, hydro, geothermal and biomass).
155 Lublin Eco-Energy Cluster The Lublin Eco-Energy Cluster was formed in the region in which excellent natural conditions favour the development of the cluster s specialization. The greatest biomass potential in Poland is located exactly in the Lublin voivodeship; also in this region the greatest number of grant applications for the energy crops production was submitted. In order to facilitate the activity of the cluster, two thematic groups were sectioned from it: biomass for the needs of professional energetics, local boiler houses and individual farms, biomass and production waste to develop biogas plants. The cluster s activity in this respect was appreciated by the Advisory Team on Renewable Energy in the Board of the Lubelskie Voivodeship by inviting the cluster s representatives to a meeting on energy and biogas. The potential connected with renewable energy was also recognized by the remaining cluster s members who are involved in numerous meetings in the groups mentioned. Result: The formation and development of companies operating in eco-energy who jointly act within the cluster s structures. Availability of highly qualified employees According to the respondents evaluation, the availability of the qualified staff is important to intensive and full development of the cluster. The availability of highly-qualified staff was many times mentioned by the respondents as one of the decisive factors for the creation of a given structure in a given region or allowing to achieve successes by clusters. Respondents also mentioned the necessity to adjust curricula to the needs of the labour market. Only one cluster was given the maximum evaluation. Average for the collection of 45 clusters is There were no entities which did not appreciate the importance of having the right staff in the range of evaluation 0-2 there was only one cluster. The importance of the factor Availability and mobility of highly qualified employees increases with the level of innovation of the cluster s sector.
156 Chart 78. Availability and mobility of highly qualified employees Score from 1 to 10 Clusters often indicated that the access to technical staff and experts from chosen domains was made difficult. According to experts, professional education in Poland requires thorough changes. in their opinion workers who graduate from vocational schools or have technical secondary education are definitely not prepared to do their job the number of hours dedicated to practical exercises is very small; the technology presented in the course of schooling are often outdated. Theoretical approach prevails even in schools or technical universities. Clusters undertook initiatives to improve technical and practical preparation of experts, as well as technical promotion of schooling directions. Postulates to change the teaching policy in Poland frequently came up in the conversations. Many subjects attempted to enter into cooperation with universities of technical schools. Persistent efforts to that effect resulted in the curricula changes on the level of technical schools and universities, as well as in the creation of best practice programmes. However, examples of initiatives that failed due to the lack of interest on the part of educational institutions are mentioned by respondents more often. The reason given for their failure was the same each time the lack of motivation on the part of an institution to introduce changes which are a time-consuming and long-term process without direct benefits. The next problem raised in this area was the outflow of highlyqualified staff to other regions and foreign entities. The conducted analysis shows that accessibility of highly-qualified workers for the needs of clusters bears direct influence on its development. Clusters often have ready-made ideas concerning changes necessary to improve the state of the art in education. The postulates of clusters to create proper schooling directions on the vocational, technical and higher level should be used to introduce necessary changes by institutions responsible for creating policy in Poland, e.g. the Ministry of National Education or the Ministry of Science and Higher Education. It would contribute to better development of the cluster structures in Poland.
157 Investment attractiveness of the region The indicator Investment attractiveness of the region covered the state of infrastructure, access to office and lab space, the rent of office space. For 20% of clusters investment attractiveness of the region is of minimum or very small influence on the cluster s development. 47% of respondents indicate good access land works, access of business premises, communication infrastructure or close proximity of research centres. They also stress the role of special economic zones which make it possible for clusters to use special conveniences. 8 clusters treat investment attractiveness as a key element to success (evaluation 9-10). The hindering factor was the lack of land planning documents and proper infrastructure. Average score for this indicator amounted to 6.20 which is a consequence of low score for the influence of investment attractiveness of the region to the development of the cluster s development given by 20% of clusters. Chart 79. Investment attractiveness of the region Score from 1 to 10 Investment attractiveness of the region is a more important factor, favouring the cluster s development, for those clusters which operate in more innovative sectors. It is connected with the accessibility to proper research infrastructure. Many clusters mentioned increased investment attractiveness of the region due to infrastructural investments, as well as the creation of special economic zones. On one hand, respondents often evaluated infrastructural resources very well. On the other hand, they pointed out that there the rent of office and lab space is high which hinders the actual use of the provided infrastructure. Clusters whose members are located close to each other e.g. in a technology park point out the fact of closeness makes cooperation easier (problems and ideas are discussed more easily and effectively in a tête-à-tête than on the phone). It also allows to cut operation costs for companies as they may jointly use deliveries, e.g. of office products or Internet access. Therefore, the existence of technology parks raises investment attractiveness and supports the cluster's activities. Respondents, especially those representing clusters associating micro and small enterprises, indicated the necessity to create entities of that
158 type. It results from the fact that the clusters are often unable to prepare so costly an infrastructure and rooms where member companies might be located. Openness of the entrepreneurs to cooperation The openness and eagerness to cooperate were recognised as very important factors of the cluster s success which is confirmed by the chart below. The scores for this factor were between 4 and 6. It is worth noting that there are no respondents for whom cooperation has no influence on the increase of the cluster and those for whom it would be a condition of maximum importance. Clusters undertake initiatives for the formation of common trust of the cluster s members. They include the use of tools aiming at integration of the cluster s members; e.g. the introduction of a cooperation system consisting in fair treatment of all members, organizing meeting and integration events or writing ethical codes for the cooperation in the clusters. The application of such solutions highly influences the growth in trust among the cluster's members towards each other, the increase of the willingness to cooperate and strengthening of the process of knowledge and experience exchange. Chart 80. Openness of the entrepreneurs environment for cooperation Score from 1 to 10 Average score in this area reached the level of Considering that the cluster s users often compete with each other, it should not be surprising that among comments there were some about distrust and distance to jointly undertaken initiatives. It makes cooperation on equal terms much harder and slows the cluster s development. Coordinators often stressed how difficult it is to pull new entities to the cluster. They also mentioned time-consuming and longterm process of building mutual trust between the cluster's users. Because of that coordinators and active cluster members need to take action to build mutual trust. The change of the ensuing situation is a long-term activity. The level of mutual trust is higher in the clusters where there was mutual cooperation (e.g. in the form of a cooperative) before the cluster s structures were founded. Examples of best practices connected with building equal relations and trust in the cluster are shown below.
159 Best practice 22. building equal relations and trust in the cluster Coppersmith Cluster Aim: Promote cooperation between companies in the cluster. Increase mutual trust between cluster members Practices aiming at building equal-term relations, the reduction of antagonisms and strengthening of trust among users were identified in four clusters; as a consequence it contributes to improved cooperation between the cluster s members. Printing and Advertising Cluster in Leszno Chemical Cluster Green Chemistry in Zachodniopomorskie Innovative Industrial Cluster Casting Components Association KOMCAST In the Coppersmith Cluster a cooperation system was worked out between entities from a sector in which entrepreneurs as a rule are highly distrustful to each other. The system is based on treating every member equally and not favouring anyone. A tool used on the cluster s website may set the example; every time the website reloads the order in which members are listed changes. Moreover, during preparations before going to the trade fair, the cluster selects representatives from member companies. The representatives, apart from the opportunity to present their own products, promote not just common cluster s products, but also those of their market competitors that belong to the cluster. Each election of different representing companies for the representatives of the cluster strengthens cooperation between members and favours integration. This practice has been in use for 2 years. In the Printing and Advertising Cluster in Leszno the cluster s coordinator organises annual half-open integration events for the cluster s members, their families and friends. Meetings of this type strengthen informal relations of the cluster s members and increase their mutual trust. The cluster organises open events too; these have free admission for everyone. Such events not only aim at integration but also promote the cluster outside and give an opportunity to learn about the cluster s activity, to make new contacts and cooperation bonds. Also in this cluster meetings are organised once a month (each time at a different cluster member) which aim at getting to know the technical backing which is at the disposal of every member to increase trust and willingness to cooperate among users. In the Chemical Cluster Green Chemistry in Zachodniopomorskie so-called business teas are organised which allow for thematic talks between cluster members and invited guests (e.g. business angels). Such talks are an opportunity to establish new business contacts and strengthen the existing ones. These meetings also have an integration function and allow to discuss current problems. In order to better know the users, in the course of general meetings concerning the majority of cluster members a few minutes are devoted to present the activity of individual cluster member companies. In the Innovative Industrial Cluster Casting Components Association KOMCAST there are unwritten ethical rules that all members abide by. They consist in not intercepting clients from cluster s partners that go through temporary financial problems and are threatened by losing an agreement. This rule is applied even though cluster partners are in direct cometition.
160 Result: Increase of mutual trust between cluster members, increase of willingness to cooperate and the awareness of benefits resulting from common actions, the exchange of knowledge and experience. Availability of the natural resources Due to sectors where clusters are active, the availability of natural resources is of marginal importance for many of them. For 20 entities this factor is unimportant, for 4 others of little importance. For 37% of respondents the closeness of raw material base is rather important, and it does not only concern raw materials such as shale gas or biomass, but also mineral water, honey, high solar exposure of the area or wind characteristics of the area. Average score for this factor amounted to Chart 81. Availability of the natural resources (including raw materials) Score from 1 to 10 The availability of natural resources is of special importance for the development of these clusters which operate in renewable energy, environmental protection, culinary or tourism brands. In other case the access to these raw materials is unrestricted and does not influence the increase in the cluster s potential. Summary Average score for five factors discussed above amounts to The cluster with the highest result in the form of average value of indicators in this area reached the result on the level of It is located in the Śląskie voivodeship. To sum up the results in sub-area Regional predispositions one can say that the most important for the cluster s development in Poland is the potential and traditions of the local environment. More than half of the entities were based on economic or historical traditions of
161 their region. The utilization of the potential and economic traditions of the local environment is one of the factors facilitating ties of cooperation and it decides about success of a given cluster structure. This process proceeds much more difficult in the case of entities which do not utilize such potential. The availability of qualified staff and the willingness and openness of the academic circles to cooperation is also very important to clusters' development. However, the analysis of the information received shows that educational system in Poland to a high degree diverges from the cluster s needs. Vocational, technical and higher education requires thorough changes which should lead to the preparation of the right staff to do the job. Currently the problems mentioned are connected with the access to properly qualified staff that could start working without further training. Clusters undertook initiatives to improve technical and practical preparation of experts, as well as technical promotion of schooling directions, but many of these eventually failed. According to respondents, the lack of interest on the part of the educational institutions results from the lack of motivation of the institution to introduce changes which form a time-consuming and lengthy process. Therefore a systemic change on the level of policy making in Poland is necessary (i.e. in the Ministry of National Education or the Ministry of Science and Higher Education which should use postulates of clusters to introduce the necessary changes that could contribute to better development of the cluster structures. The investment attractiveness was evaluated quite highly by the Polish clusters. In their opinion it is not a factor conditioning their development in absolute terms. Still in the case of clusters operating in sectors having high innovation level, the access to research institutions or technology parks constitutes a motivating factor to create cluster structures. The availability of natural resources, on the other hand, which was restricted mostly to the energy sector in the area of renewable resources was of little importance. Both clusters which did not receive external funds and those who did, the most important factor for the growth of the cluster is the potential and economic traditions of the local environment. It is similar in the case of clusters, irrespective of their sector s innovation level or size. The investment attractiveness of the region turned out to be more important only for clusters with the number of members between 31 and 60. The map below shows average potential scores of the clusters' development in the given voivodeships as for regional predispositions. Large discrepancies can be seen in the evaluation of the potential between the east and the west of the country. Voivodeships clusters are in which evaluate their development potential as higher than average are: Dolnośląskie Voivodeship Kujawsko-Pomorskie Voivodeship Łódzkie voivodeship Małopolskie voivodeship Opolskie Voivodeship Podkarpackie voivodeship Pomorskie Voivodeship Śląskie Voivodeship Zachodniopomorskie Voivodeship.
162 Map 2. Average scores from sub-area Regional predispositions by voivodeship Despite good natural conditions in the western Poland (including soil, nature, clean environment, natural conditions for the development of renewable energy such as wind), these voivodeships were given lower scores than those in the western part of the country. It may be related to low quality of infrastructure in these regions and lower trust of entrepreneurs towards each other.
163 9.2. Public authorities policy in favour of the development of the cluster Within sub-area: Public authorities policy in favour of the development of the cluster the value of the following indicators was inspected: Promotion of the cluster by public authorities Financial support of the development of the cluster by public authorities Training, educational and organizational aid for the cluster Influence of the regional innovation policy (through RSI) on the development of the cluster The cluster s cooperation with self-government public authorities Adjustment of the changes in the educational system to the needs of the cluster. The summary of results for subarea Public authorities policy in favour of the development of the cluster is shown below. Chart 82. Average value and highest value of the indicator within sub-area Public authorities policy in favour of the development of the cluster Benchmark value for sub-area: Public authorities policy in favour of the development of the cluster Average value for sub-area: Public authorities policy in favour of the development of the cluster

164 Within sub-area: Public authorities policy in favour of the development of the cluster only one indicator (adjustment of the changes in the educational system) reached the result on the level of 10 points. The worst in this sub-area is the indicator concerning financial support for the cluster s development by public authorities and training, educational and organisational assistance for the cluster. The indicator on cluster s cooperation with selfgovernment public authorities was the best in this sub-area. However, it still decidedly diverges from the benchmark value for the whole sub-area. A detailed analysis of indicators within sub-area Public authorities policy in favour of the development of the cluster is presented below Promotion of the cluster by public authorities Scores for the promotion of clusters by public authorities are shared unevenly. It does not have to result from the evaluation of the importance of this factor to the cluster s development, but rather from wrong evaluation of promotional activities undertaken by public authorities. Since such activities do not take place, they have no influence on the cluster s development (7 inspected clusters revealed such situation). For 35% of respondents the popularisation of information about the cluster is insufficient, whereas 40% of them are rather happy about the current level of support given in promotion. The average score for this criteria is Promotional activities consist mostly in cooperation with self-government city, poviat, and above all marshal offices post information on the clusters on their websites, invite cluster users to conferences, meetings, organise visits for foreign delegations at the cluster s representatives. Chart 83. Promotion of the cluster by public authorities Score from 1 to 10 Larger clusters, that can be described as more innovative, as well as those that received financial support from external sources, evaluate the influence of cluster s promotion by public authorities better which seems logical considering the notable profits received by the clusters.
165 The clusters also indicated actions taken on the central level aiming at the promotion of the clustering idea. However, they often expressed dissatisfaction from the fact that public entities organise trainings covering issues on benefits from the creation of the cluster structures which are not necessary at the stage of their development. The popularisation of basic knowledge on the cluster structures should cover education among entrepreneurs which perhaps could become potential members of such structures cluster coordinators indicated problems related with encouraging new companies to join the cluster. Therefore, basic knowledge about clusters should be popularised by institutions when other activities are done for the entrepreneurs e.g. in the form of short informative leaflets on what the cluster is and what benefits being its member gives or short speeches at various conferences organised for entrepreneurs, press releases, etc. Financial support for the cluster According to more than half of respondents, there is not enough of financial support from public authorities to develop clusters. 21 clusters gave the score 0 saying that either they receive no financial support from public authorities or the support is imperceptible to the cluster s growth. Only for 5 clusters public programmes are the main source of financing. The average score for all clusters covered in this study for this indicator is Financial support of the cluster is more visible to clusters that operate in sectors with higher innovation level. Clusters gathering a larger number of members also evaluate better the influence of this indicator on the cluster s development. Chart. 84. Financial support of the development of the cluster by public authorities Score from 1 to 10 While analysing the possibility of financial support of the clusters you must take into account the risk it entails. The experience of other countries show that too high a level may cause that economic entities join the structure only for financial gain, without real involvement and identification with a given solution. However, the level of financial support that is too low in the first stage of developing new initiatives (currently about half of the clusters are undergoing that stage) or the lack of consequences in granting support may discourage entities from taking action. The possibility to receive financial support from the EU funds by
166 particular initiatives to implement the desired goals will constitute a very important factor making the development of these initiatives more dynamic. The basis for preparing the right support instruments should be detailed analysis of the clusters needs. The programmes prepared often do not take into account basic needs of the clusters (e.g. ensuring stable operation for the cluster through financing the cluster s office). According to respondents, the policy of cluster support in Poland should be based on foreign experience. Among the proposed solutions was financing a several years series of the cluster s development since the moment the initiative is formed through common creation of the cluster s structure until the time when common projects are prepared and implemented. The funds become smaller each year (which in the beginning is communicated to the clusters) which aims to stimulate the cluster members to increase their financial contribution to the structure. In the first period which is characterised by high financial support the cluster members could see the results and gains of the participation in this structure which should be motivating enough for their involvement (also financial). Thanks to that it would be possible to decrease support each year. Consequently, the cluster would have external guarantee of its activity and the certainty of stability of the structure thanks to the earmarked funds. Once the embryo stage is finished, the funds could be spent only on the implementation of specific projects prepared in the clusters. Such a solution suggested by the clusters themselves should be discussed by public institutions that could influence cluster policy making in Poland. It would ensure stability for the operation of cluster structure in the first years of their operation and would prepare them gradually to act on their own. Also in terms of educational and organisational encouragement from public authorities they are not evaluated as enough. Almost 85% of clusters indicated note below 5 points which means that the assistance is deemed as insignificant or very small, of little influence on the growth potential of the cluster. The average for an inspected indicator was Respondents claimed that trainings and seminars organised by public authorities concerned mostly clustering and innovative projects as well as regional promotion, whereas specialised courses would be necessary. The representatives of the clusters claimed that they are aware what a cluster is, and now they would like to receive more practical information, e.g. what form of cooperation should the cluster assume; what are the possible organisational solutions, etc. The use of foreign experience was suggested. It was also signalled that the majority of educational initiatives were taken by business environment institutions, but not by public authorities. 7 clusters gave scores between 6 and 8, public training was important to them. They stress the attractiveness of e.g. trips abroad. The analysis of the received information makes it possible to say that the training and educational assistance is not adjusted to the clusters' needs. Also as far as organisational issues are concerned, clusters may count on support from public authorities only in a very limited fashion. Respondents often mentioned the lack of people in public entities they could turn to when they were facing problems. Another difficulty was also the lack of support e.g. in the form loaning rooms for official meetings of the cluster in the situation when the cluster did not possess such rooms.
167 Chart 85. Training, educational and organizational aid for the cluster Score from 1 to 10 The training and organisational assistance and its influence on the cluster's development received much better scores than clusters which received external funds. It may be connected to financing external courses organised for the needs of the cluster. The clusters signalled the lack of proper tools to support their action. The tools / documents which could support the clusters' development could be: specific legal solutions related to organisational form of the cluster, but also e.g. common settlements of projects or productions, support in the analysis of the potential and preparations for the cluster s strategy, including the possibility of expansion to foreign markets, solutions in relation management in the cluster, methods of cooperation with academic institutions (legal and organisational solutions), tools making it possible to seek foreign partners and cluster associations in the world. Influence of the regional innovation policy Over 95% of clusters were accounted for in the regional innovation policy. However, according to respondents, it does not entail any specific supportive actions of the authorities. 24% of all scores are the worst ones. 36% respondents think that regional innovation strategies overlap with clusters strategies to a small degree. It was stressed many times that the cluster becomes part of the Regional Innovation Strategy, but there is a lack of any actions related to it. On the other hand, 22% of respondents thought that the effect of regional innovation policy is very noticeable, e.g. through inviting the cluster to the strategy consultation, supporting cooperation connections. In this category the maximum grade was not awarded. Average score for all clusters was 3.56.
 on the development of the cluster Score from 1 to 10 Respondents also pointed out that there is a direct connection between putting the")
168 Chart 86. Influence of the regional innovation policy (through RSI) on the development of the cluster Score from 1 to 10 Respondents also pointed out that there is a direct connection between putting the cluster in the Regional Innovation Strategy and the possibility to receive co-financing from regional programmes. However, although most clusters covered by the study are accounted for in the regional innovation policy, they do not receive any tangible gains for that reason. It causes negative attitude of entities to use strategic documents which do not translate directly into effectiveness in the form of the entities included in such documents receiving public support by e.g. awarding bonuses to entities which are important for the development of a given region. An example of best practice related to supporting sectors important for region s development by self-government is presented below. Best practice 23. Self-government s support for sectors important for region s development Pomeranian ICT Cluster Baltic Eco-Energy Cluster Aim: Increase the possibility of cluster s development by recognising the cluster s sector as a strategic sector for the region's development Clusters in the Pomorskie voivodeship had the opportunity to participate in a contest to be given a key cluster status by selfgovernment of the Pomorskie voivodeship. The clusters had to abide by the contest regulations which covered i.e. cooperation with academic institutions and the growth potential of the cluster. The final decision to award the key cluster status was taken by the Board of the Pomorskie voivodeship. Both clusters used this opportunity and submitted applications to this contest. The gains

169 for the clusters resulting from receiving such a status are i.e. additional points won during the evaluation of projects applying for co-financing from the Regional Operational Programme for the Pomorskie voivodeship and the Operational Programme Human Capital (regional component) in operations selected by the Board of the voivodeship. Each key cluster had a chance to receive cofinancing of a total of up to PLN 16 million. Moreover, the Pomeranian ICT Cluster undertakes additional actions so that a separate development strategy is created for its own sector. Selfgovernment sees this initiative positively. The expression of this invitation for the cluster by self-government to consultation in the process of forming development innovation strategy for the Pomorskie voivodeship. Result: Greater possibility to receive funds for the cluster's development and a possibility to influence the sector s development strategy in the region. Cooperation with public authorities Respondents appreciated cooperation with public authorities, especially self-government. Almost half of the clusters (49%) gave scores higher than 6. The sympathetic response, openness of the authorities, lobbying for the clusters or the participation of self-government in commonly implemented projects were named as important actions. However, respondents also mentioned the negative experience of clusters connected with the cooperation with self-government. Respondents indicated situations in which the current cluster members were being encouraged to start cooperation in an organised form and received promises of support from the authorities, but the administration later withdrew it. These extreme evaluations of public authorities policy show that there is a lack of rules used in particular regions and no possibility to make use of experience of the best evaluated self-governments. The next conclusion is the lack of a coherent strategy implemented for the clusters in Poland and the lack of coordination in the support granted. Chart 87. Cluster's cooperation with public authorities Score from 1 to 10 On the other hand, in the case of cooperation with the government, it is small or almost
170 nonexistent. Clusters try to take action, mostly for their own sector, on the governmental level. Unfortunately, in many cases they bring no result, because they are not partners on equal terms. The clusters representatives are often invited to meetings or asked to give an opinion but the public administration does not give any response as to how cluster s proposals were considered. According to respondents, the communication in this matter is usually one-way, and so this cooperation as a rule was evaluated negatively. Four entities could not create communication planes with self-governments, whereas 15 entities described the influence of cooperation on the cluster s development as either minimal or small. Average result was Respondents indicated in interviews that public administration often makes promises it does not keep. They gave an example of the recruitment for contests that were later cancelled without explanation. There were also information that actions taken by the government do not take into account the needs and specificity of the Polish clusters. These actions concerned e.g. the manner in which funds in operational programmes are shared. It all leads to a situation in which the clusters' representatives do not think they are important partners for public organisations and that their opinions are not taken into consideration. However, cluster's activity in this regard is not significant. The interviews show that only the chosen clusters undertake formalised actions to draw the attention of public entities to the problems of functioning clusters or their sectors. It results to a large degree from the conviction about low effectiveness of such actions. That is why clusters rarely systematically following the actions of the government and take formal initiative of consulting the documents prepared or decisions taken by the government on the central or local level. The conclusions from the analysis of cluster s cooperation with public entities allow pointing out the necessity to act both on the part of the clusters and above all public authorities, without whom improved cooperation could not be possible. Detailed recommendations in this regard were presented in Point 11.2 Conclusions and recommendations addressed to coordinators and entities functioning in clusters; and Point Conclusions and recommendations addressed to the government s policy entities. Changes in the educational system The clusters too active steps to adjust the education system to the cluster s needs. 42% of respondents achieved first successes. The project was submitted to create new studying fields; talks were held with the Ministry of National Education about vocational education; ideas emerged to create postgraduate studies or special profile classes in secondary schools. At the same time, 33% of entities gave very low scores (in the range 0-3) which proves that in their opinion there was no adjustment in educational system to their needs. The average score was 4.40.

171 Chart 88. Adjustment of the changes in the educational system to the needs of the cluster Score from 1 to 10 It is important to stress that many actions related to adjusting educational fields or educational system to the cluster s needs, and, in practice, the sector of the cluster s members are taken by the cluster. It is rare that an initiative stems from the other side from educational circles. In general, clusters have a very negative evaluation of the system of technical education in Poland. An example of best practice for adjusting changes in the educational system for the needs of the cluster is shown below. Best practice 24. The cooperation with public authorities to change curricula Innovative Industrial Cluster Casting Components Association KOM- CAST Aviation Industry Entrepreneur Group Association "Aviation Valley" Aim: Change curricula to adjust them to the cluster s needs The cluster decided to take a series of actions towards public authorities to launch a study field for the needs of the sector it operates in on the level of secondary education. The cluster participated in. al. in numerous official meetings at universities where it obtained support of the academics and in meetings organised in education offices to create secondary technical schools. Thanks to the actions of the cluster, the Eugeniusz Kwiatkowski technical schools complex in Rzeszów launched a new study field foundry technician. To further encourage the youth to study it, 3 companies belonging to the cluster declared to reimburse travelling costs for students commuting to school from outside Rzeszów. Practical exercises and vocational practice will take place in plants that reimburse travelling costs. Alumni have the opportunity to get a job on attractive conditions in the plants where they had practice with the possibility to continue studies at the Rzeszów University of Technology and the AGH University of
172 Science and Technology in Kraków. The "Aviation Valley Cluster put forward an initiative to the education office to coordinate curricula in technical schools with the actual needs of the industry. The education office approved which resulted in signing an agreement and adopting new curricula by 10 schools in the voivodeship (in. al. the General Anders Mechanical School Complex in Rzeszów, the Father Zwierz School Complex in Rapczyce, the Staszic Upper Secondary School Complex in Krosno, the Technical School Complex in Mielec, the General Dąbek School Complex No 4 in Stalowa Wola). The CEKSO Centre of Operators Education was also founded. The aim of CEKSO is to train future workers of industrial companies in the Podkarpacie region on the secondary education level, mostly CNC machines operators. The Centre is supported financially by selfgovernment. Result: Obtain support from public institutions which allowed creating study fields adapted to the cluster s needs. Summary The average score for sub-area Public authorities policy was The potential for further improvement can be looked for in such areas as financial support, training assistance or putting the cluster's needs within the regional innovation strategy. The cooperation with selfgovernment and adjustment of the educational system received average scores, and so they are on a satisfactory level with a tendency for further growth. The highest value for the discussed sub-area (benchmark value) was It was given to the cluster associating over 60 entities; it received external funds amounting to over PLN 1 million. It also operates in a highly innovative sector. It is located in the Podkarpackie voivodeship. Two trends were visible in large-scale research. According to the first, higher innovation level of the cluster s sector improves the evaluation of the policy towards it (it may be connected with greater sympathy of the authorities towards entities that introduce innovations). A similar phenomenon can be observed when you consider the size of the cluster as measured by the number of entities. The more entities were associated in the cluster, the easier it was to enter into dialogue with public administration. Of course, clusters which received external funds indicated a higher influence of the public authorities policy on the cluster s development than those clusters that did not receive financial support. The map below shows average potential scores of the clusters' development in the given voivodeships as for the public authorities policy. Scores given in individual voivodeships are completely different. It may be a hint for the voivodeship s self-government on how to perceive the policy for supporting clusters. The lowest rate for financial support of clusters by public authorities was given by clusters located in voivodeships: Mazowieckie, Lubelskie, Podlaskie, Lubuskie and Łódzkie. A very low score given by clusters operating in these voivodeships results to a high degree from low evaluation of financial support for clusters by public authorities. Very low grades by clusters in the voivodeships discussed were also given for sub-areas concerning organisational and
173 training assistance from the authorities for the cluster and the influence of the Regional Innovation Strategy on the cluster. Map 3. Average scores from sub-area Public authorities policy in favour of the development of the cluster by voivodeship Voivodeships in which there are clusters evaluating the influence of the public authorities policy on the cluster s development as being above average are: Dolnośląskie Voivodeship Kujawsko-Pomorskie Voivodeship Małopolskie voivodeship Opolskie Voivodeship Podkarpackie voivodeship Pomorskie Voivodeship Śląskie Voivodeship Świętokrzyskie Voivodeship Warmińsko-Mazurskie Voivodeship Wielkopolskie Voivodeship Zachodniopomorskie Voivodeship. In the case of voivodeships which received the highest rates, it resulted mostly from very good evaluation of financial support for the clusters and the influence of the Regional Innovation Strategy on the cluster s development. Regional analysis of results in the public authorities policy to the cluster s development indicates the lack of a uniform national approach to cluster support. Financial support of the clusters requires harmonisation and implementation of the Regional Innovation Strategy and its influence on the growth potential of cluster structures. It is therefore necessary to properly formulate and implement a coherent support policy for the clusters in Poland which would be implemented in all voivodeships. Detailed recommendations in this regard were presented in Point 11.3 Conclusions and recommendations addressed to the government s policy entities; and Point Conclusions and recommendations addressed to the entities of selfgovernment s cluster policy.
174
175 9.3. Institutional surrounding In sub-area Institutional surrounding respondents evaluated the following indicators: Availability and quality of research for the needs of the cluster Quality and availability of advice, training and information services Readiness and openness for cooperation of business related organizations and research and development organizations Organization of the transfer of technologies (in the country and from abroad) Availability of funds supporting the cluster s development Availability of the market infrastructure of the business surrounding (inter alia banks, leasing, etc.). The summary of the results for sub-area Institutional surrounding is shown below Chart 89. Average value and the highest value of the indicator within sub-area Institutional surrounding Benchmark value for sub-area Institutional surrounding Average value for sub-area Institutional surrounding Within sub-area Institutional surrounding only one indicator reached the highest result of 10 points (Readiness and receptiveness of business-related as well as scientific and research institutions to cooperate) for whom average score of the clusters covered by the study is also the highest. The worst result in this sub-area was given to the indicator concerning the
176 availability of market infrastructure of the business surrounding (inter alia banks, leasing, etc.) for which the highest value is the weakest within the whole study. The indicators concerning the availability of funds supporting the development of the cluster and the organization of the transfer of technologies (in the country and from abroad). A detailed analysis of indicators within sub-area Institutional surrounding is presented below. Availability of research for the needs of the cluster 42% of the clusters evaluated positively the availability and quality of research for the needs of the cluster, giving notes between 6 and 8. They think that access to research is satisfactory and they are of good quality. However, financial considerations often form the barrier for their use. 8% of clusters use their own research which was performed by research entities belonging to the cluster. In one third of cases the fact that the research is not used resulted from no need to use external studies or them being unavailable on the national level. The average of the studied indicator was For the majority of clusters the availability is on the right level. However, it does not mean that clusters use that potential. No cluster evaluated the importance of the factor discussed as a key factor for the growth potential of the cluster. Chart 90. Availability and quality of research for the needs of the cluster Score from 1 to 10 During interviews there was information to the effect that research and knowledge do not always respond to the cluster s needs. Clusters in highly innovative sectors use international research because on the national level such studies are unavailable. Few clusters mentioned the lack of access to research on their sectors or that such data given in publications is highly vague. The sought after studies are also publications about clusters showing models for the cooperation and management of the clusters. To sum up, one can say that the quality and availability of external research is evaluated well by clusters. The main barrier concerns mostly financial aspects. Clusters could more often use or commission the preparation of special studies for their needs if they gained access to financing that kind of expenses. The analysis also proves that over 30% of entities do not see the need to use these types of instruments to support the process of cluster management. It may result from the lack of awareness about the need to use management supporting tools. The analysis also shows that the availability and quality of research is of greatest importance to clusters which operate in highly innovative sectors.
177 Availability of consulting and training services Average of indicator Quality and availability of advice, training and information services was % of respondents do not see the influence of these services on the cluster s development. 33% of respondents evaluate the availability as satisfactory, but they do not use support of external institutions, the reason being mostly financial constraints and varied quality of services or too high price. Clusters often have among their members companies that provide advisory or training services, even though 57% of entities claimed that external consultancy is important for their operation. The large-scale analysis shows a positive relationship between the level of innovation of the cluster s sector and the importance of advisory and training services for its development. Chart 91. Quality and availability of advice, training and information services Score from 1 to 10 An exemplary use of external advisory services is the support in preparing strategies, legal advising and preparing applications for project financing. Advisory services are used more often, although there are situations when trainings in the cluster are run by its members or partners, especially by research entities. Clusters pointed out that the access, especially to the training offer, can be discernable thanks to financing such activities from the EU programmes. Several respondents drew attention to the fact that such services are often available only in big cities and do not always fit the specific needs of the cluster. Cooperation with business-related and R&D organizations Readiness and openness for cooperation of business-related organisations and R&D organizations is one of key factors for the cluster s development which is reflected in the average score of Although 8 clusters claimed that the cooperation of business-oriented and R&D institutions is of minimum importance for the cluster s development, still for 62% it is important. 3 clusters chose the maximum score. Two of them operate in a highly innovative sector, and one in one with an average level of innovation.
178 Chart 92. Readiness and openness for cooperation of business related organizations and research and development organizations Score from 1 to 10 Many respondents evaluated the possibility of cooperation with R&D entities as very important for the cluster s development, even if they evaluated the cooperation negatively. There was a frequent opinion that the education support system in Poland, especially in higher education, does not favour cooperation with entrepreneurs. The conducted research rarely reflects the entrepreneurs needs and are not focused on their implementation. According to respondents, award system for research workers is mostly based on the number of publications and addresses which discourages workers from seeking new solutions that are possible to use in practice. Representatives of the clusters often emphasised great involvement of people working at universities in the cooperation with the cluster, but they complained about institutional / bureaucratic barriers restricting this cooperation. The cooperation with R&D entities concerns first of all: transfer of knowledge, joint projects (e.g. studies and implementations of new technology or products), discussion about the cluster s and sector s development. The relationship between the level of innovation of the cluster sector and the importance of cooperation with R&D entities to develop the cluster is visible. It is likewise for entities that received external funds; that cooperation has greater meaning than that for clusters which did not receive such support. Conversely, the cooperation with business-related institutions is most of all the support for clusters in legal counselling and the possibility to use EU funds. This cooperation often involves also promotion through events organised jointly with the cluster aiming at the increase of region s recognisability, mostly the sector. An exemplary best practice in cluster s international cooperation is shown below.
179 Best practice 25. Transnational cluster s cooperation Aviation Industry Entrepreneur Group Association "Aviation Valley" Mazovian Aviation Cluster Aviation Mazovia Transfer of technologies Aim: Spread information about cluster s activity on the international arena The Aviation Valley Cluster and the Mazovia Aviation Cluster are members of the European Aerospace Cluster Partnership (EACP). The EACP aims at initiating active information and knowledge exchange between all partners to build a stronger and more competitive position of Europe on the world aviation market. Due to the establishment of such cooperation the cluster promotes its activity in the international environment of the aviation sector. The membership in EACP gave the cluster the opportunity to make use of actions implemented by the Partnership both in cluster promotion and in using knowledge and experience of the European partners e.g. in finding funds for the activity of aviation clusters. Result: Recognisability of the cluster in the international environment and the opportunity to start cooperation with the European partners. Average score in area of the transfer of technologies was significantly lower than in the case of openness of business support institutions and amounted only to Over 25% of all clusters gave the lowest scores for this indicator. 9 clusters use transfer of technologies to a small degree or not at all. This transfer occurs in an average and high degree and is important for the development of 16 studied entities. It concerns mostly the use of foreign technologies. According to the clusters, a barrier hindering the transfer of technologies is the lack of institutional support. Chart 93. Organization of the transfer of technologies (in the country and from abroad) Score from 1 to 10 The evaluation of the importance of the transfer of technologies for the development is
180 affected by the innovation level of the sector where the cluster operates. For clusters from traditional sectors, with low innovation, the transfer of technologies is of marginal importance (average score was 1.91). Together with the increase in the innovation level in a sector, the importance of the transfer of technologies in the cluster s development rises companies operating in highly innovative sectors evaluated the importance of the discussed factor at 5 points. Despite that, this process is not universal in the Polish clusters only 9 entities actively participate and implement the transfer of technologies. Most often the transfer of innovation between cluster members happens through the simplest tools and channels of imitative behaviour as well as through the exchange of information in the form of informal and formal meetings. The transfer of technological solutions is much rarer. However, there are some cases showing the importance and undertaking actions in this regard. An exemplary best practice in the cooperation within cluster s transfer of technology is shown below. Best practice 26. Internationalisation aiming at supporting transfer of technology in the cluster. LifeScience Cluster in Kraków Aim: Improve efficiency of the transfer of technology LifeScience Cluster formed a company in the USA to make contacts with foreign enterprises and make the transfer of technologies easier. It should contribute to the increase market stance of the companies from the cluster and the creation of products that will be competitive in the world. The company which is a non-profit organisation works in cooperation with the authorities of North Carolina. The functioning of this institution should be made possible by learning from more experienced partners and contribute to a more efficient transfer of technologies. The aim of the institution is also to develop cooperation between enterprises from various countries, as well as encourage companies to invest in partner countries. In May this year during the Bio International Convention in Chicago an offer was presented containing the main assumptions and operating schemes of the organisation. The presentation was received with great interest by conference guests. Result: The formation of foreign contacts with enterprises of a similar business profile, the exchange of knowledge and experience, faster process of learning by the organisation. Availability of funds supporting the cluster s development The availability of external funds was evaluated by clusters very low; over 60% awarded it less than 4 points. The information received in the interviews shows that this type of funds is very rarely used by clusters because they are often inaccessible and more expensive than other instruments financing the clusters operations. The average for the presented indicator was Chart 94. Availability of funds supporting the cluster s development
181 Score from 1 to 10 Respondents said that private funds are not easily accessible due to the requirements in guarantees. Some clusters, due to difficulties related to guarantees, even tried to establish their own credit and warranty funds. Therefore, clusters look for other financing schemes for their members activity because the funds available on the market are unavailable for them, especially if the cluster includes micro and small enterprises. Clusters with more than 30 members gave the worst evaluation of the availability of such financing instruments. About 20% of clusters did not have any knowledge on the possibility to use such funds. The above analysis shows that clusters need financial support for their development because external financing available on the market is often too expensive or unavailable for the cluster structures. It is connected with the lack of the right guarantees, as well as with the lifecycle of the clusters. Over 70% of clusters operate no longer than 3 years and at the current development stage is unable to generate financial guarantees necessary to use such type of financial instruments. On the other hand, own funds available in the clusters to a small degree allow maintaining the cluster s office, to say the least about using these funds to implement joint projects. The results in the above area confirm that funds (like venture capital etc.) cannot stay on the current development stage of the Polish clusters and constitute an alternative project financing. It is necessary to support clusters financially from the public funds until it is possible to gain financial independence of young clusters. Additional institutions with funds should carry out an information campaign among the Polish clusters on the rules for using their support because the knowledge in this respect is very limited. Availability of the market infrastructure of the business surrounding The current market offer of business surrounding does not fulfil the expectations of respondents. Three lowest scores constitute over half of all evaluations. Average score was only None of the clusters chose the score higher than 6. The most frequent arguments

182 were high price of the suggested products and the lack of an offer fully adjusted to the cluster s needs. It is also visible that companies offering business support services and administrative services rarely profile offers to specific cluster s needs. Only in rare cases the clusters received an offer specially tailored to their needs, but just as rarely they asked for such an offer on their own. The received scores for the indicator discussed are not dependent on the cluster s size, on the amount of external co-financing granted or the innovation of the cluster s sector. They result from individual experience of the separate clusters (separate coordinators). Chart 95. Availability of the market infrastructure of the business surrounding (inter alia banks, leasing, etc.) Scoring from 1 to 10 An example of how the cluster operates for the benefit of its members is presented below. It aimed at influencing public authorities and business-related institutions. Best practice 27. Cluster s cooperation with local and national institutions Cluster of Restaurateurs and Hoteliers Aim: Increase possibilities of cluster s influence on the shape of a local economic policy The cluster directs its operation towards the development of cooperation with local authorities. The result of such cooperation is e.g. successful initiative to convince local authorities to lower rent for pavement cafes in exchange for making restaurant toilets available for all tourists in town. Moreover, negotiations were held with ZAiKS to lower fees for a possibility to broadcast records in restaurants. Result: The costs of running operations were lowered for the cluster members. Summary
183 Respondents of the study evaluated institutional surroundings on an average level of 4.22 point. The evaluation of the sub-area was much diversified. The availability and quality of research, the offer of advisory and training companies but also (or above all) the cooperation with research institutions have important influence on the potential of the studied entities. The research showed that clusters very rarely use external funds (such as seed capital, venture capital et al.) and market infrastructure of the business surrounding. The availability of external research is evaluated well by the clusters but still the main barrier in wider use of this instrument is the cost of preparing such research. The analysis also proves that over 30% of entities do not see the need to use both internal and external research which shows the lack of awareness of these entities regarding the possibility to use such instruments to support the process of cluster management. The evaluations related to quality and availability of advisory, training and educational services are quite varied. One third of entities evaluate the accessible support in this regard as sufficient. A large share of entities possess entities as cluster members which perform advisory and training roles or they use the knowledge of R&D entities from the cluster. The limitations in the access to this type of support, as well as research, resulted from restricted financial resources of the clusters. Several respondents drew attention also to the fact that services are available only in big cities and do not always fit the specific needs of the cluster. The area of readiness and openness of business-related and R&D institutions was evaluated positively regarding the openness to cooperation, but the quality of that cooperation was evaluated significantly worse. Firstly, it is clusters that initiate cooperation, whereas R&D entities are interested in the situation when it entails additional financial opportunities. There was a frequent opinion that the education support system in Poland, especially in higher education, does not favour cooperation with entrepreneurs, because it does not award bonuses for innovative solutions, but for theoretical knowledge instead. As regards the transfer of technologies, the main barrier hindering the implementation of this process is the lack of institutional support. In Poland most often the transfer of innovation between cluster members happens through the simplest tools and channels of imitative behaviour as well as through the exchange of information. On one hand, there are no good examples concerning the implementation of the transfer of technologies. On the other, there is a great demand for knowledge in this regard among the clusters. The situation related to knowledge of funds supporting the clusters development looks similar (seed capital, venture capital, etc) which is very restricted. Moreover, clusters in Poland on the current stage of development are not able to use such financial instruments because they require high level of financial security. Benchmark value for sub-area Institutional surrounding amounted to 7.00 points. The best scores for institutional surrounding was given by the cluster operating in a highly innovative sector with over 60 entities which received external funds to the amount of over PLN 1 million. The analysis of results allows saying that higher level of innovation in the cluster s sector requires better institutional surrounding to its development. It is connected with both the access to modern research, transfer of technology, and most of all the cooperation with universities and R&D institutions. The map below shows average potential scores of the clusters' development in the given
184 voivodeships as for institutional surrounding. Scores given in individual voivodeships are totally different. The discussed area is to a large degree related with cooperation with R&D entities or the transfer of technology. Actions aiming at using the existing potential or strengthening it may be taken by the proper authorities and institutions both on the national and regional level. Therefore, the map below should be an indicator for public authorities regarding the perception of the cooperation of business with science. Map 4. Average scores from sub-area Institutional surrounding of the cluster by voivodeship A large discrepancy in the score for the potential between north-east-centre and south-west of the country can be seen. Voivodeships clusters are in which evaluate their development potential in institutional surrounding as higher than average are: Dolnośląskie Voivodeship Kujawsko-Pomorskie Voivodeship Lubuskie voivodeship Małopolskie voivodeship Podkarpackie voivodeship Pomorskie Voivodeship Śląskie Voivodeship Warmińsko-Mazurskie Voivodeship Zachodniopomorskie Voivodeship
185 9.4 Cluster leadership In the subarea Cluster leadership the respondents evaluated the following indicators: Strength and position of coordinator in the cluster Strength and position of other cluster members in initiating shared cluster activity Strength and position of the cluster relative to its environment (ability to gain funding, lobbying) The coordinator s ability to initiate cooperation (internal and external). A summary of the benchmark value and values of indicators for subarea "Cluster leadership" is presented below. Chart 96. The average and the highest value of the indicator within the subarea Cluster leadership In the Cluster leadership subarea, the indicator related to strength and position of coordinator in a cluster achieved the best results and it also deviates slightly from the highest value of average assessment of all the clusters surveyed. In this subarea, the weakest indicators are those which relate to strength and position of cluster relative to the environment and strength and position of other cluster members in initiating shared
186 cluster activity. Average assessment of all the clusters was 6.36, which is a relatively high result compared to other subareas. A detailed analysis of indicators within Cluster leadership is presented below. Strength and position of coordinator in a cluster For strength and position of coordinator in a cluster more than 75% of respondents awarded 7 points or more. The coordinator s strength is measured based on efficiency of actions and attendance at meeting organised for cluster members. It should be noted that many coordinators do not receive a salary for their work. As many as 12 entities are convinced that the cluster s performance is to large extent dependent on the leader. The average number of points awarded was On the one hand, this shows that the cluster members experience in cooperation with the coordinator is very positive. On the other hand, the associated entities should also use other methods of cluster management in addition to appointing a coordinator in order to ensure durability of cluster structure even in a situation where another person becomes a coordinator. Chart 97. Strength and position of coordinator in a cluster Score from 1 to 10 The coordinator is an important success factor in clusters as it is his involvement and charisma that allow cooperation between market competitors to happen. Many interviews with leaders contained a statement that many joint projects would not have been implemented if it was not for the coordinator. Cross-section analysis shows that the larger the cluster, the better the assessment of the coordinator's position in the cluster and its impact on cluster development. In a large majority of clusters, coordinators work as volunteers for the cluster and need to reconcile this function with their main professional responsibilities. This does not allow them to focus on tasks related to the cluster operations, which has an impact on
187 efficiency of its operations. This situation is largely due to no possibility of funding administrative management of the cluster from state funds. This is of particular importance to young clusters (and these represent more than 70% in Poland), which did not develop relevant instruments that would make it possible for them to finance the costs related to office management. Introducing membership fees frequently discourages entities from joining a cluster it is difficult to convince them to cooperate even without this element. For this reason, some clusters decide against introducing such a mechanism. Also, until tangible results are achieved, entities associated in clusters are not interested in paying the coordinator's salary or financing office management. It is therefore necessary to support coordinator s activities because he/she is not able to be fully committed to the cluster s operations. In many clusters, the problem of the necessity of decreasing the coordinator's workload was solved by establishing additional authorities within the clusters' structure to support cluster operations (i.e. working groups, academic boards, etc). Such practices should be used more often in Polish clusters where it is not possible to finance administrative management from cluster's own funds. Possible ways of supporting the cluster management process by using different management structures are discussed below (as a best practice). Chart 96. The average and the highest value for the subarea "Cluster leadership"

188 Objective: Optimization of cluster management in activity planning and implementation Clusters have different structural functions. The most frequently present bodies within clusters are: Cluster Board, Cluster Board Committee, Steering Committee, the Board and Task Forces. It should be emphasised that there is no universal formula which would fit with every cluster and guarantee effective management. The functional solutions adopted should be based on the needs of a given organisation. It should, however, be emphasised that for clusters with many members appointing additional bodies which support management considerably facilitates execution of the cluster's tasks at operational level. In the majority of cases, the Cluster Board is there to shape opinions and set development trends. Operational and executive measures are mainly the responsibility of the Steering Committee. In Pomorski Klaster ICT, the Cluster Board was appointed consisting for the main part in enterprise representatives (9 out of 11 members).owing to this solution, entrepreneurs are actively involved in cluster operations. They also have knowledge of processes in the cluster and its operations, which may be useful when the cluster coordinator is replaced and ensure continuity of the cluster's operations. In Optoklaster, the entity in charge of operational management and cluster operations is not only the coordinator but also the Steering Committee. It is composed of several people consortium members representatives (the cluster s legal form is that of a consortium), both of research units and entrepreneurs. Their task is to organise the work of research teams, establish cooperation, seek sources of funding and take key decisions for the cluster. In Małopolsko-Podkarpacki Klaster Czystej Energii the most important managing bodies are: Cluster Partner Board and Steering Team. In addition, there are units in charge of promotion, information, education and training funding sources, constructing an energy conversion laboratory and organisational matters Effect: Increased efficiency of task implementation in the cluster by splitting the responsibility between the coordinator and supporting bodies by means of specialisation.
189 Strength and position of cluster members So as to be able to carry out all the activities, the cluster s coordinator, considered an authority, should have a group of entities which will be actively involved in cluster operations. Such a situation is present in 28 clusters, in which the assessment of the indicator of strength and position of cluster members amounted to at least 6 points. The participants commitment manifests itself in submitting new ideas and initiatives and accepting responsibility for their implementation. The analysis reveals that the companies within clusters have the largest impact on cluster operations. They are usually most active and willing to undertake new initiatives. Average assessments by clusters for this indicator amount to Chart 98. Strength and position of other cluster members in initiating shared cluster activity Score from 1 to 10 The amount of entities which are active in the cluster ranges from a few (2-3) to about a dozen and this is no more that 20-3-% of entities operating in the cluster. Several clusters undertook activities aimed at, on the hand, adapting the clusters activity to the needs of particular groups of associated entities and aimed at activating them, on the other. Not only does such a solution increase the effectiveness of cluster management but it also contributes to increased cooperation within groups of entities and a definite increase in the level of trust. This has an impact on future cluster development prospects. Little activity of cluster members is frequently related to the fact that they do not identify themselves with the activities undertaken by the cluster, and they are only cluster members because they expect future benefits. It is frequently the case that cluster membership is first and foremost associated with EU funding opportunities intended for this aim. Frequently companies joining a cluster expect quick effects but do not really want to contribute their own financial and time resources. Analysis of two charts above shows that activity, development path, actions taken are usually due to the coordinator's activity than that of
190 cluster members. One of the important coordinator s tasks in this area is therefore making cluster members aware of the fact that achieving results of shared activities of associated entities depends on the commitment of its members and it is a long-term process. Clusters should also seek ways of activating cluster members and strengthening the role of leaders in the cluster. This is essential in order to ensure continuity of cluster's activity when the coordinator resigns. It is therefore helpful here to use solutions involving enterprises in tasks carried out by the cluster and building leadership skills. Best practices in this area are discussed below.
191 Best practice 29. Improving cluster management mechanisms
192 Aim: Optimization of working time A good practice identified in several clusters in operations is the creation of thematic groups which enables the clusters to better organise their work and involve persons who have the broadest knowledge in a given field. The thematic groups also facilitated Communications between cluster members thanks to a focus on implementation of specific objectives. The division of task between the constituent members of the cluster increased its efficiency. In Klaster Euro-Centrum 4 thematic groups were created: heating pumps, solar systems, IT, steering systems and architecture and planning, which has a more strategic role. In Bydgoski Klaster Przemysłowy there are 7 groups dealing with different domains, and each has their own modern. In Lubelski Klaster Ekoenergetyczny due to a large diversity of industries and interests and objectives, four industrial groups in which working meetings are organised. Pomorski Klaster ICT implemented the formula of group meetings based on ideas of entrepreneurs, who become project coordinators in order to manage them in line with their vision. This formula facilitates work and helps appreciate those who show not only conceptual initiative but also implementation one. Klaster Medycyna Polska appointed 5 task forcers, including the R&D group, the consulting group, the medical group, public administration and health group. Klaster Bielizny created the following thematic groups: the financial group, marketing and management in order to implement a joint project. The frequency of group meetings maliny depends on current cluster activities. The structure of task forces is different for different clusters and usually depends on the number of members in a given group. For small clusters, the groups usually have one member from each cluster company and their structure is complex. In the larger ones (Klaster LifeScience) interdisciplinary units are appointed with a precisely defined role. Another important issue is the different function of particular companies within the cluster, which may specialize in a given field. The decisions made during the meetings are taken in a democratic manner. The thematic groups are appointed not only because current activities need to be discussed but also in order to work jointly on a product/service/ technology and also for implementation purposes. Effect: Better decision making processes in given thematic areas of cluster s operations.

193 Best practice 30. Strengthening the role of leaders in a cluster Objective: Activating the cluster members Klaster Grono Targowe Kielce uses the principle whereby the person who is the originator of a given initiative submitted by cluster members later creates a task force responsible for implementing the idea. Such a unit is composed of the persons chosen by them. The person who has initiatied the action becomes the coordinator of the unit. Implementation of the cluster members initiative largely depends on the person who invented a given concept. Their motivation and commitment to performing their own activity increase the chances that the idea will be implemented. Effect: Increased competencies of cluster leaders in terms of leadership, ensuring continuity of coordination (it is no longer dependent on one person - the cluster coordinator). Strength and position of cluster relative to the environment Clusters feel that their position compared to external entities (public administration, universities, the government, etc) is relatively strong. It is only in three cases where this position is really strong, firm and the cluster is able to gain funding and deal with lobbying. The majority of entities (75%) scored between 4-7 and therefore their position is considered to be good or average. The entity s strength is mainly evidenced by its ability to cooperate with the authorities, efficiency in lobbying activities, gaining a strong political position, good reputation and being perceived by external partners as a stable element in the region that attracts new members. Average assessments by clusters for this indicator amount to 5.24
194 Chart 99. Strength and position of cluster relative to the environment (ability to gain funding, lobby) Score from 1 to 10 The larger the number of cluster members and the more innovative it is, the better the assessment of the cluster s strength and position relative to the environment. Still more than 40% of clusters consider their position to be weak due to lack of achievements as a result of implementation of shared activities. As the Polish clusters and cluster membership will grow, the number of points awarded for strength and position of cluster relative to the environment will increase. The coordinator s ability to initiate cooperation In the eyes of other members, the coordinator s position depends on their ability to initiate coordination. The average for this indicator was % of the respondents awarded more than 6 points. In this group of respondents, 66% were of the opinion that the coordinator s organisational skills have a large impact on cluster position. However, 17% feel that this role plays the most important part.
195 Chart 100. The coordinator s skills in terms of initiating cooperation (external and internal) Score from 1 to 10 Initiating cooperation within the cluster mainly involved motivating and activating the members to take action. However, outside the cluster, coordinators promoted the cluster, lobbied, initiated cooperation with other clusters or units, and this was also done abroad. More points were awarded to coordinators in those clusters in which external funding was obtained which goes to show that coordinators are judged in terms of efficiency of the activities that they undertake. Coordinators were frequently aware of skills gaps related to the function they performed. Lack of time due to heavy workload related to the cluster operations made it impossible for them to enhance their own skills. However, the coordinators awareness of the necessity of developing their own skills was at a high level. An example of best practices in terms of strategic thinking in undertaking activities is discussed below.

196 Best practice 31. Strategic thinking Objective: Adopting a strategy for cluster operations In the early days of the cluster s operations, its members clearly defined their objectives, which they decided to formulate formally as a document. In partnership with an external company, during 8 joint workshops a joint strategy for cluster operations was developed. These meetings enabled them to define realistic detailed objectives. This gives additionally a fuller picture of its internal structure. While developing the strategy, an analysis was made which allowed the cluster coordinator to evaluate the cluster's condition objectively as well as planning of its further development. Also, an external cluster expert was employed, who provided professional support with coordination of activities, development of organisational and marketing solutions and obtaining EU funds facilitated the coordinator s work and enhanced their knowledge in the above mentioned areas. Effect: undertaking activities in line with the set objectives. More coherent and focused character of cluster activities. Summary Leadership is one of the most highly valued subareas the average being 6.38 and the benchmark value Such a positive assessment is due to representatives of a large cluster which received external funding of more than PLN 1 million and operates in a highly innovative industry. An analysis of the four indicators discussed would suggest that the coordinator s position is strong and that his importance for cluster development is considerable when activity of cluster members is much less intensive. The problem of lack of activity of cluster entities is quite common and there are already clusters which use special tools to increase their members' commitment to cluster operations. More and more frequently working or thematic groups are used and these deal with selected areas of cluster's operations thus making the coordinator s workload less heavy. Such solutions are necessary in Polish clusters, considering the wide range of cluster's operations and also the coordinator's social commitment to cluster operations. It is physically impossible for the coordinator to be involved in all tasks carried out by the cluster, especially when the cluster is active in many fields. It is therefore necessary to create additional managing authorities within clusters to enable the coordinator to perform, in particular, strategic planning and enhance their skills. Such a solution also has an impact on the number of leaders, which ensures continuity in the cluster when the coordinator is replaced.
197 The data gathered during the interviews would suggest that clusters are still seeking ways to activate their members. They may use the experience of other Polish and foreign clusters and also try to build a strong position of the cluster relative to the environment - i.e. encourage to join the cluster thus motivating to undertake actions. Each organisation performs wells when it has a strong leader and committed members and when it can build a strong position outside. According to survey findings, higher subsidies make the coordinator's position stronger and shape the image of a strong cluster. Similar trends were revealed by an analysis of relationships between a given industry s innovation level and leadership in the cluster and the size of cluster enterprises and leadership. In both cases, larger clusters with more entities which operate in more innovative industries were perceived as superior and better managed. On the one hand, leadership in a cluster is an important success factor for it. An efficient and effective coordinator may considerably enhance the development of the organisation they are running. It is important that such a person be charismatic, experienced, knowledgeable and able to cooperate and motivate others. On the other hand it is essential to constantly involve cluster members in activities which the cluster undertakes to enhance the leaders skills and ensure continuity of leadership in the cluster.
198 10. Cluster strategies Developing and implementing a strategy is one of many key factors contributing to the success of activities carried out by entities, regardless of the type of activity. Thanks to this, their activities are not random but stem from focussed thinking concentrated on achieving particular results in the long-term. This is done through implementation of strategic, long-term objectives indicating what the entity wishes to achieve. As entities operating in the market, consisting of many enterprises, clusters, as well as their members, should define their strategic objectives to be able to achieve their intended results. Short-sightedness may lead to taking careless decisions which might result in the end of the cluster s operations. More than a half of entities surveyed have a formal development strategy, but in the case of the other ones only a small part initiated discussions on formulating the cluster's strategy. Despite this, all respondents answered the questions on the importance of particular factors for the cluster's strategic objectives (on a 0-10 point scale). The factors investigated were classified into the following subareas: Subarea Economies of scale Subarea Creating a network of knowledge and innovation Subarea Impact on business environment Subarea Impact on the natural environment 76 Below is a summary of the benchmark value and average values for the area Cluster strategy. An analysis of the data does not reveal any important discrepancies between the clusters investigated in the cluster strategy area. In this area, a high benchmark value was noted and also a large average value which amounts to approximately 75% of the benchmark value. Such high values are due to the fact that clusters have judged many of the factors raised to be their strategic objectives (to a large or a very large extent). Having considered all the assessments performed by the respondents, it may be said that the main strategic objectives of cluster activities are: an increase in market importance of the cluster s and the region s brand possibility of obtaining funding for the cluster, knowledge transfer and innovation diffusion through informal contacts possibility of lobbying in favour of the cluster s activity (industry) a better position of the cluster as a partner to the environment, attracting new talents (experts, specialists, etc.) to the region The subarea natural environment" was added to the questionnaire during the survey
199 Chart 101. Average and benchmark values for the subarea: Cluster strategy In the Economies of scale subarea, the clusters awarded many points to the indicators, which resulted in a high average value and a high benchmark value. In terms of the cluster s strategic objectives (located in this subarea), obtaining funding for the cluster as well as lobbying in favour of the cluster and the industry are of particular importance. They are similar to the clusters operations objectives in chart 9, e.g. industry promotion and development, better project opportunities and cluster companies promotion and development. High assessments are also present in the subarea Creating a knowledge and innovation network. Informal knowledge and experience sharing in the cluster is very important in this case. In the subarea Impact on business environment, the clusters achieved a slightly higher average and benchmark value. Such high assessments stem mainly from the fact that most of the indicators surveyed are part of important strategic objectives of clusters operations. This is the reason why maximum values were assigned to them. This concerns in particular the increase in importance of the cluster's and region's Brand, as well as the better position of the cluster as a partner for the environment. The average value of the subarea: Impact on the natural environment is smaller than for the other subareas discussed. This is due to the fact that these objectives are mainly
200 important for clusters operating in industries related to environmental protection or benefiting from the natural environment, such as renewable energy or tourism. The objectives indicated in this subarea are also important for the clusters which attempt at entering new markets. In line with worldwide trends, environmentally-friendly products are increasingly more popular with consumers, which is why clusters, also the ones operating in traditional industries, try to take advantage of these trends and offer more and more environmentally-friendly products, e.g. products which use less energy. The majority of respondents consider many factors to be the cluster s strategic objectives. However, not all of these are reflected in the outcomes of cluster operations in Poland. This is evidenced for instance by high values of the results in the area discussed which are much higher than cluster processes or performance. For instance, many clusters considered joint creation of innovative solutions to be an important or very important strategic objective for their operations. However, the research findings concerning the processes or creating knowledge and innovation in a cluster or cluster performance in terms of increased innovation would not suggest that this is an important objective for clusters' operations. Of course, while considering strategic objectives, a longer timeframe should be taken into account in this case. Despite this, the majority of factors indicated as strategic objectives for clusters' operations are not even accompanied by attempts at development planning in a given area. It would therefore seem that many of the main strategic objectives indicated in this area are examples of clusters' wishful thinking rather than realistic objectives for their operations.
201 10.1. The benefits of scale The sub-area The benefits of scale comprises the following indicators: The opportunity to acquire funding for a cluster Increasing bargaining power against suppliers Coordinating the buying market The opportunity to lobby for a cluster (industry) Increasing a cluster s competitive advantage A summary of results for the sub-area is presented below. Chart 102. The mean and the highestscores for the indicator in the sub-area The benefits of scale Value of benchmark for sub-area The benefits of scale Average value for sub-area The benefits of scale The cluster which received the mean of the indicators equal to the benchmark value concluded that the factors related to the benefits of scale are its strategic objectives to the maximum or almost the maximum extent. All the objectives included in the sub-area The benefits of scale are important to the clusters. The opportunity to acquire funding for a cluster was given a particularly high meanscore. An important objective, albeit to a lesser extent, is the opportunity to lobby for the activities of a cluster (industry), as well
202 Number of clusters as increasing a cluster s competitive advantage. Further, the respondents pointed to objectives such as coordinating the buying market and increasing bargaining power against suppliers. Opportunity to acquire funding All the clusters consider acquiring funding to be an important strategic objective of their activity. Almost 80% of the clusters stated that being given that opportunity was their objective at least to a very large extent (8-10). For 6 clusters, acquiring funding is, to an average or large extent a strategic objective (5-7). The opportunity to acquire funding plays a minor role in the long-term plans of only 4 clusters. Noscores of 0-2 were noted. The mean ofscores for the clusters for this indicator was Out of all the indicators in the sub-area, this is the most important strategic objective of the clusters. It ranks second of all the possible strategic objectives of the clusters activity, regardless of the sub-area. The clusters also undertake many activities in this field (62 projects financed from external sources have been implemented since the clusters came into being). In addition, 56 rejected applications were filed. In total, the clusters made 118 applications to participate in projects financed from external sources. This gives a result of 2.5 applications for a cluster. A crosssection analysis points to a direct relationship between the level of innovativeness of the cluster s industry and its size, and the importance of the opportunity to acquire funding presented in its strategy. Chart 103. The opportunity to acquire funding for a cluster Score from 1 to 10 The clusters participating in the study do not have their own funds which would allow them to maintain the clusters' offices and to undertake joint activities, e.g. to cooperate on a common product. Only seven clusters (out of those which did not receive external funding) have their own funds varying from PLN 7,000 to 57,000. These funds are sufficient, at best, to run the clusters offices but not to undertake joint activities. Some of the clusters have difficulties even to acquire the funds required to provide their own contribution when applying for the implementation of projects co-financed by the European Union. The clusters members are unwilling to participate in the costs of maintaining those structures. Even low membership fees are met with very negative reactions from the participants of a cluster. Due to the above, the opportunity to acquire funding for a cluster is a very important strategic
203 Number of clusters objective. For the majority of the surveyed clusters, these funds are a means to attain other objectives (e.g. innovation boost), although for the rest, acquiring additional funding is the most important benefit resulting from cluster membership. Because of that, financial assistance for clusters, which is necessary, should include an appropriate motivational system to achieve other goals than just acquiring funds. Bargaining power against suppliers The clusters gave varyingscores to the factor increasing bargaining power against suppliers. For 7 of them, this factor is of little importance. For another 15, increasing bargaining power against suppliers is one of strategic objectives, but to a little or average extent (3-5). More than a half of the surveyed clusters gavescores of 6 and higher in that category, which means that improving negotiating position against suppliers is important or very important for them. The meanscore of the clusters for this factor was It is therefore a factor of average importance. Chart 104. Increasing bargaining power against suppliers Score from 1 to 10 That factor is particularly important for clusters operating in industries with little innovation and those with few members (up to 30). This may be related to traditional activity of those entities in the clusters, which is largely based on external products/semi-products. From that perspective, increasing bargaining power against suppliers thanks to cluster membership may lead to lowering the prices of commodities and thus increasing the mark-up for cluster members. The measures taken by the clusters in Poland do not indicate that this objective has a strategic importance for them. The results achieved by the clusters within the joint orders section are small. Only 9 clusters carry out operations related to joint orders. However, the clusters results in this area are related to determining increasing bargaining power against suppliers as a strategic objective of a cluster. The clusters which achieved better results in terms of joint orders indicate that this objective is more important from the point of view of their long-term development. Correlation between those two measures is 27%. However, the clusters have used the opportunity to influence suppliers only to a limited extent. This area
204 Number of clusters provides many opportunities to take measures leading to achieving the effects of scale. Joint orders can be related not only to commodities supplies but also administrative and clerical services. The costs of purchase are lower thanks to one order filed by many entities at the same time, which points to the effect of scale being achieved. Buying market coordination The clusters scores varied in relation to the significance of the buying market in the context of their strategic objectives. Almost 20% of them gave that factor fewer than 4 points. For another 13 clusters, the buying market coordination is their strategic objective to an average extent (4-6). However, the majority of the clusters (24 out of 45) gave a score of 7 or more to the significance of the factor (in a scale of 1 to 10). The mean score of the clusters for this factor was 6.00, therefore it is, to a great extent a strategic objective of the clusters operations in Poland. The clusters take certain measures aimed at achieving the set objective. They consist in preparing a common offer by a cluster (29 clusters work out a common offer, although rarely does it comprise the majority of cluster members) or a common distribution channel (14 clusters have it, at various development stages). However, it is hard to call those measures, which are composed of minor activities and are seldom related to working on a common product or market expansion, buying market coordination. As the clusters results show, the membership of a network structure has little impact in terms of boosting the sales of the companies products. Chart 105. Coordinating the buying market Score from 1 to 10 A cross-section analysis indicates a positive correlation between the amount of acquired external funding and the level of innovation in a cluster s industry, and the significance that was given to the buying market coordination in a cluster s strategy. Also, the clusters with more members gave higher scores to the importance of the buying market coordination among the clusters strategic objectives. It may be related to the fact that a cluster with a greater number of members may have a larger impact on the market because it has a larger
205 Number of clusters share in the sales on that market. It is worth noting that none of the surveyed clusters has a dominating position in the sales of their industry in Poland. Due to that fact (despite adopting the buying market coordination as an important strategic objective), attaining this objective will not be possible without increasing the critical mass of the clusters through attracting new members. The opportunity to lobby Almost all the clusters consider the opportunity to lobby for the clusters' (industries') operations to be a strategic objective. According to about 85% of the clusters, this plays an important or a very important part (7-10). For 4 clusters, the opportunity to lobby is a strategic objective to an average extent (5-6), and for only 2, to a little extent (3-4). No 0-2 scores were noted. The average score of the clusters for this factor was This is one of the five most important strategic objectives of the clusters operations in Poland. It is true that the clusters have undertaken certain activities in the area of lobbying in particular, for their industries. Only 5 clusters do not undertake any lobbying activities involving the authorities. However, those activities seldom have a formal framework. Activities on the regional and national level are undertaken. Examples of lobbying activities for the clusters and industries include meetings with central and local government representatives, inviting parliamentary committees to visit a cluster or participating in drafting development strategies for the industries in voivodeships. Chart 106. Score from 1 to 10 The clusters, which were given higher scores for lobbying activities, also consider the opportunity to lobby to be a more vital strategic objective. The correlation ratio between those two indicators is 47%. The clusters which considered cluster-related government policy to have an important impact on its development potential, at the same time considered the opportunity to lobby for clusters to be a very important strategic objective. In this case, the correlation ratio is 80%. High scores related to the impact of government policy on cluster development were given in the clusters where that policy was assessed positively. Therefore, those clusters are more willing to engage in lobbying activities. This leads to a conclusion that
206 Number of clusters the clusters which negatively assess government policy related to the cluster development (which may result from their own experiences) consider the opportunity to lobby to be a less vital objective of their operations. As the lobbying activities undertaken by the clusters up until the present did not bring anticipated results, the clusters are unwilling to take new measures in this area. However, for public authorities cooperation with the clusters, including receiving their opinions or taking part in social consultations, should be important because the clusters are, in a way, representatives of industries and regions. Due to the above, measures should be taken to improve the relations between the clusters and government administration. The administration should build its positive image also in terms of cluster-related measures. Conclusions and recommendations in this area are presented in the next chapter. Competitive advantage Gaining competitive advantage means that the products/services of a company are preferred in relation to the products/services of competitive companies. As far as clusters are concerned, the products/services of its members can be considered. Competitive advantage may be gained by means of, among other things, innovation launching an innovative product, which stands out with its functionality or design, market niche companies sell products for which demand is low, although they have monopolies and significant market position on those small markets, product quality a product stands out with a positively high quality compared to competitive products, other features - e.g. energy efficiency, manufacturer s reputation, etc. The clusters do not undertake significant activities which increase their competitive advantage. Innovation boost, to some extent, has taken place among most of the surveyed entities, but providing legal protection for implemented innovations only in several ones. The clusters aim to ensure high quality of their products, e.g. through adopting manufacturing standards or joint implementation of quality certificates. Currently, it is impossible to conclude that the clusters have a reputation which, on its own, would assure customers about the high quality of their products. Chart 107. Increasing a cluster s competitive advantage
207 Score from 1 to 10 Despite few measures taken in the area, increasing the competitive advantage of a cluster is a vital objective in many clusters strategy. Over a half of them stated that increasing competitive advantage is at least their important strategic objective (8-10). In case of 12 clusters, it was considered to play an average or large role in their long-term plans (5-7). About 15% of the clusters gave scores of between 0 and 4 for this indicator, which means that increasing competitive advantage is not, or is only to a little extent, their strategic objective. The mean score for this indicator was High scores given to that strategic objective indicate that clusters would like to be structures which provide their members with increased competitive advantage. However, they do not have the resources or abilities required to attain that objective. They might be lacking awareness of the opportunities in that area. Due to the above, the clusters require training and consulting assistance which would show them the methods of gaining competitive advantage, e.g. through boosting product innovation. Summary To sum up, in the sub-area The benefits of scale, the mean score of the five discussed indicators for all the clusters was Two clusters with the highest scores achieved a score for 9.40 in this sub-area. These clusters combine two common features they were not granted external funding and they have up to 30 members. Gaining the benefits of scale is particularly important for the clusters which operate in less innovative industries and those comprising fewer entities. The clusters which are active in more innovative industries aim their operations elsewhere - towards creating knowledge and innovation networks. The clusters also take certain measures which enable them to take advantage of the benefits of scale. First of all, this is preparing (to a great extent) a joint offer of a cluster and lobbying the authorities. More rarely do the measures include joint orders, or else, sales is done through a common distribution channel. Also with regard to increasing their competitive position, the clusters do not make a good impression the dynamics of their development is low (only about 25% of current members were added to them in the last two years), and only in five clusters there have been start-ups in the last two years. Despite all that, the clusters attach a lot of weight to the benefits of scale. They consider any related factors to be their strategic objective; predominantly those relating to the opportunities to acquire funds for a cluster or lobbying for a cluster (industry). The clusters awareness of the opportunities to achieve the synergy effect through joint manufacturing or commodities purchase is still quite small. An important strategic objective is that the surveyed clusters gain the benefits of scale. These benefits result from the following effect: the more entities in a cluster, the bigger impact it can have on the buying/customer market; it may have more lobbying power or sufficient resources to gain competitive advantage. These objectives are particularly important for the clusters of more than 30 participants. Due to the small number of their members, these clusters can enjoy the benefits of scale only to a limited extent. Thus, one of the main measures which may lead to attaining the discussed objective should be increasing the critical mass of clusters through admitting new members. New start-ups may take place in the clusters, although this is largely independent of the clusters. An average Polish cluster (considering the results of the clusters which took part in the survey) has 42 members, of which 12 have been admitted in the last 2 years. Therefore, the dynamics of cluster development is low. The clusters will struggle to achieve the effect of scale if it remains on a similar level in the future.
208 10.2 Creating a knowledge and innovation network The subarea Creating a knowledge and innovation network covers the following indicators: Increased possibilities of market research Developing competencies through life-long learning (e.g. training, studies, etc.) Knowledge transfer and innovation diffusion through informal contacts Diffusion of technology within a cluster Common creation of innovative solutions Establishing common technical standards A summary of indicators for the subarea discussed is provided below. Chart 108. Average and highest indicator value for subarea Creating a knowledge and innovation network Both the benchmark value as well as the average value for the subarea Creating a knowledge and innovation network are very high. All the objectives within the subarea discussed are relevant for the clusters. Knowledge transfer and innovation diffusion through informal contacts achieved a particularly high average value. To a lesser but still an important extent, developing competencies through life-long learning is an important objective, as well as common creation of innovative solutions. Next the respondents mentioned such objectives as increasing the possibilities of market research and establishing common technical standards. Possibilities of market research
209 For many clusters increasing the possibilities of market research plays an important part. For 35% of clusters, this possibility is considered to be a strategic objective to a large or maximum extent (8-10 points). However, for 21 clusters it plays a medium or important role in their strategy (5-7 points). 4 clusters declare that the factor discussed is of little (3-4) and minimal (1) importance for them respectively. The average assessments by clusters for this indicator is Chart 109. Increased possibilities of market research Score from 1 to 10 Clusters which did not receive external funding consider increased possibilities of market research as their strategic objective to a much lesser extent. This is due to the fact that they have enough funds for market research or purchasing relevant analyses. It has also been observed that increased possibilities of market research are more frequently considered as a strategic objective among clusters whose areas of operations are less innovative. Since the indicator covers market rather than technological research, clusters operating in traditional industries see a demand for adequate identification of their target market and even for searching new markets. Only some clusters undertake activities aimed at achieving the objective in question e.g. analysis of cluster potential or purchase of market analyses. In the major part of clusters market information is shared. However, it is frequently information and knowledge sharing between member enterprises and much less frequently purchase of industry analyses or direct outsourcing of such analyses. The main reason for this is not small importance of obtaining market data for clusters but absence of adequate funds for research, e.g. related to assessment of cluster potential or possibility of entering new markets. The activities which are carried out are not systemised. It is also not possible to claim that these are large scale activities. In addition, among factors having an impact on cluster development potential, availability and quality of research are of little importance for its needs. Developing competencies
210 Developing competencies through life-long learning (e.g. training, studies, etc.) is ranked high in the hierarchy of clusters' strategic objectives. As many as 60% of clusters declare that this is a very important objective in their strategy (8-10 points). Another 17 clusters feel that life-long learning plays a medium or very important role in long-term planning (5-7). The average assessment for this indicator was Developing competencies through life-long learning is in top five of strategic objectives for clusters operating in low or medium innovation industries. For their members, participation in a cluster is a chance for improving skills of their staff. As can be deduced from the results on human resources development, activities undertaken in clusters have an impact (however limited) on enhancing the knowledge and skills of cluster members' staff. Owing to cluster structures, 6700 people were trained in the last two years (approximately 2.4% of cluster staff). However, the awareness of how external trainings can be used for the benefit of cluster members is very limited among cluster members and even the coordinators. At present, a part of EU funds is used for financing training, courses or postgraduate studies. For this reason, their prices are considerably lower than the market ones. It seems essential to help clusters in obtaining information on trainings available and encourage them to participate. In such a case a cluster would not only be a training organiser but also a centre for developing competencies through passing on relevant information to interested entities. Chart 110. Developing competencies through life-long learning Score from 1 to 10 Knowledge transfer and diffusion of innovation Knowledge transfer and diffusion of innovation through informal contacts were ranked high by clusters in their strategic objectives. Almost all clusters (95%) declare that this factor is to a lesser or larger extent their strategic objective (6-10 points). The average assessment by clusters for this indicator was It is one of the five key strategic objectives for clusters operations. Within the clusters, measures are taken which are aimed at transfer of knowledge i.e. meetings of cluster members, joint trainings, cooperation with R&D units, etc. Among the activities undertaken for this aim, meetings and trainings in clusters seem to be relatively
211 frequent. Transfer of knowledge is rarely based on using Intranet only 15 clusters have a highly developed internal network. Fewer activities are therefore undertaken to enhance innovativeness i.e. 25 clusters carry out joint work on products and technologies but these rarely cover the majority of cluster members. Joint innovations were also introduced in 20 entities and transfer of technology was present in 22 clusters. These are, however, activities of limited scope, covering a small proportion of cluster members only. They do not impact to any considerable extent on performance in terms of improving innovation. The activities taken and their impact on clusters performance is small compared to the importance of the strategic objective discussed. It would seem that transfer of knowledge and diffusion of innovation (at least upon analysis of activities undertaken) are of greater importance. Enhancing innovation is an area in which clusters' performance is poor and that despite the fact that it is better than the average for enterprises in Poland. However, it should be noted that Poland is well behind other European Union countries in terms of innovation. According to the results of the European Innovation Scoreboard 77, only Russia, Turkey, Bulgaria, Latvia, Romania and Croatia perform worse in this respect. According to the Scoreboard, human resources, company investments and economic results are the strong side of Poland's innovation, its weakness lies in cooperation links, enterprise, innovations protected by property rights and the number of companies launching innovations to the market. It is worth emphasising that in the context of strategic objectives, transfer of knowledge and diffusion of innovation through informal contacts are more important for clusters operating in more innovative industries. Therefore activities that they undertake could serve as an example for clusters operating in less innovative industries. Another conclusion that could be drawn is that enhancing innovation becomes, to an increasing extent the aim of European Union s economic policy as well as that of Poland (which as indicated above, does not perform very well) the policy of public authorities should support clusters in transfer of knowledge and diffusion of innovation. This need is especially important now that activities undertaken in clusters rarely allow them to achieve this goal. 77 European Innovation Scoreboard (EIS) 2009, PRO INNO Europe Paper No 15, 2010
212 Chart 111. Transfer of knowledge and diffusion of innovation through informal contacts Score from 1 to 10 Diffusion of technology In the context of diffusion of technology within a cluster, nearly 85% of clusters declare that this aspect plays at least a medium role in their strategic objectives, granting it 5 points or more. For 2 clusters diffusion of technology within a cluster is not a strategic objective at all; for the two that follow it is strategic but only to a limited extent (2-3 points) and for the remaining 3 it is strategic to a relatively small extent (4 points). The average assessment by clusters for this indicator was As an important strategic objective of clusters activities, transfer of technology is reflected in the processes undertaken in them i.e. about a half of clusters have made a transfer of technology. The transfer of technology in progress is partly due to cooperation with R&D units and partly due to internal cooperation of cluster members while developing joint products. This work cannot happen without transfer of knowledge and technology between the members. For this reason, for clusters working on a joint product, diffusion of technology is an important objective of their operations. The correlation between those two indicators is 38%. This objective is also related to the previous one. Enterprises for which transfer of knowledge and diffusion of innovation through informal contacts is an important strategic objective, usually consider diffusion of technology as important as well.
213 Chart 112. Diffusion of technology within a cluster Score from 1 to 10 As expected, diffusion of technology as a strategic objective is most important for clusters operating in the most innovative industries. The remaining clusters seek new methods of cooperation such as enhancing professional skills of their workers or seeking innovative solutions which are not related to diffusion of technology. Companies from more traditional industries tend to perform the transfer of technology much less frequently but at the same time they seek innovative solutions to a much lesser extent. For this reason, they carry out few external activities (i.e. cooperation with R&D units or purchasing ready-made solutions) and internal ones (e.g. research and development in the company). As regards enterprises operating in high innovation industries, they transfer technology using both methods mentioned. At present, clusters are seeking relevant legal solutions that would allow them to transfer technology effectively. These solutions concern both cooperation with R&D units as well as enhancing cooperation among cluster members. There are doubts as to what diffusion of technology may look like among companies which cooperate in some areas and compete in others. It is, however, possible which is evidenced by numerous examples of clusters developed abroad. This is why clusters need good models of this and support, including support for protection of intellectual property rights and transfer of these rights. Common creation of innovative solutions Almost all of the clusters surveyed consider common creation of innovative solutions as an aspect of lesser importance, having granted it points ranging from 1-4. The average assessment by clusters for this indicator was Some clusters, which granted fewer points to
214 the factor discussed, pointed out that they consider it more important to jointly implement innovative solutions than to create them. Chart 113. Common creation of innovative solutions Score from 1 to 10 Creation of innovative solutions in a cluster may be related to the previously discussed objective, namely that of diffusion of technology. However, solutions may also be created by means of methods of creative thinking, such as brainstorming or through ideas coming from product users (the so-called user-driven innovation). These solutions are an important element of the country s economic growth and are an important point in economic policy. An example here is a report prepared by the Ministry of Economy: Tendencies in increasing innovation of the economy According to this document, strategic support areas include: developing life-long learning, exchanging personnel between R&D and entrepreneurs, adapting learning syllabi to the needs of modern economy and promotion of enterprise and innovation. A large part of these tasks is being carried out in Polish clusters already especially in terms of life-long learning (one in three workers of a cluster company enhanced their professional skills in the last two years) or adapting learning syllabi. In the latter case, some clusters made attempts at cooperation initiatives with universities aimed at promotion of technical faculties and adapting the teaching to the needs of the cluster. However, it should be borne in mind that these initiatives came from the clusters rather than the entities responsible for education. However, in the remaining areas which are relevant for increasing innovation of Polish economy, the clusters undertook few activities. These areas include economy-oriented research, intellectual property management, patent protection outside Poland and facilitating the process of obtaining protection in Poland and access to capital for innovative ventures, supporting the creation of enterprises based on modern technologies and tax incentives aimed at encouraging to undertake innovative activity as well as the development of business environment institutions, strengthening clusters and cooperation between enterprises and research as well as promulgation of the use of information 78 Tendencies in increasing innovation of the economy for , Ministry of Economy, Warsaw 2006
215 technologies. Clusters mention the difficulties in terms of managing intellectual property. And also with respect to capital for innovative ventures, clusters do not use risk funds (such as e.g. seed capital). Therefore, despite relatively large importance of creating innovative solutions for clusters, these are externally limited (lack of funds, difficulties in terms of cooperation with research units) as well as internally (low creativity, little cooperation within the cluster). In order for clusters to be able to achieve their aims, they need support (at least in the form of consulting on cooperation with R&D units). Also a system of incentives should be developed which would encourage them to allocate funds and, first and foremost, the time and human resources to activities related to creating innovative solutions. Attention should also be drawn to the reasons, mentioned by enterprises in the report by the Ministry of Economy 79, for which innovations tend not to be introduced so that instruments of support can be developed to increase the number of innovative solutions. These include e.g.: absence of funds, lack of access to external funding or absence of technical infrastructure that would allow introduction of innovative solutions to happen. These reasons were frequently raised by clusters as important obstacles to innovative activity. As expected, cross-section analysis reveals a positive correlation between innovation level of cluster's industry and the weight which was assigned in the cluster s strategy to common creation of innovative solutions. A similar correlation is noted in terms of variation in the amount of external funding and the number of entities within a cluster. The clusters which received external funding, regardless of its amount, consider common creation of innovative solutions as one of five most important strategic objectives for them. Common technical standards The clusters surveyed vary greatly in terms of recognising common technical standards established as a strategic objective. For 6 clusters this is not part of their strategy at all and the next 9 declare that it plays a small part (1-4 points). For about 35% of clusters establishing common technical standards plays an important role (5-7 points) and the remaining 14 declare that it is their strategic objective to a large extent. The average assessment for this indicator was This is the least important of all of the clusters' strategic objectives even taking into the account the aims related to the environmental impact, which, due to specificity of their industry, are irrelevant to some clusters. Common technical standards are more important for clusters operating in traditional low-innovation industries. Technical standards are usually related to the industry in which the cluster operates and frequently are a direct result of activity in a given industry. In such a case, establishing common technical standard will not be the cluster s objective. The respondents mentioned that establishing quality standards is of greater importance to them standards that would allow a cluster to become a recognisable brand and its products made by its members to have a quality mark. The clusters surveyed are implementing such standards (e.g. ISO). For this reason, establishing common technical standards is not as important a strategic objective for clusters as the other ones analysed in the present research. 79 as above, p.18.
216 Chart 114. Establishing common technical standards Score from 1 to 10 Summary In the subarea Creating a knowledge and innovation network, average assessment from the six indicators discussed for all clusters is The cluster with the highest performance in this subarea has a result of 9.5. It is a cluster operating in a high-innovation industry which received considerable external funding (more than PLN 1 million). The clusters performance shows that the higher innovation level of a cluster results in a higher rank of creating a knowledge and innovation network in the hierarchy of strategic objectives. It is similarly the case with the amount of external funding received - i.e. the clusters which have received more external funding assigned more points to indicators in the subarea discussed. The most important objective of all the discussed objectives is transfer of knowledge and diffusion of innovation through informal contact and developing competencies through lifelong learning. In other words, clusters aim at enhancing innovation to a large extent through human resources development. This is done to a lesser extent by means of purchase or transfer of technological solutions or cooperation with R&D units. This area requires some improvement as transfer of knowledge and diffusion of innovation should happen at many levels so that the solutions developed are comprehensive. Cooperation with research units still seems to be an unused potential for clusters development and that despite their membership in the cluster. This cooperation should therefore be supported, mainly by increasing cluster participants awareness of how joint activities could be undertaken with R&D units. Clusters should also have adequate resources that would allow them to transfer knowledge and diffuse innovation. These resources, in addition to the aforementioned human resources, include finance and infrastructure. Both of these areas require support. The clusters do not have sufficient funds to carry out tasks related to increasing innovation -i.e. even their own funds are sometimes insufficient to contribute own capital to projects. In other words, external funding that clusters have used to date may turn out to be insufficient. Research institutes may also require financial support to be able to purchase appropriate
217 software or research tools. Infrastructure in the form of laboratory space is available to cluster members but is rarely used by them. It is necessary to increase clusters awareness in terms of the possibility of using the laboratories available in research units.
218 10.3. Impact on business environment The sub-area Impact on business environment covers the following indicators: Improved international competitiveness of the cluster Attracting new contractors (domestic and foreign) Attracting new talents (experts, specialists etc.) to the region Increased market importance of the cluster and the region Enhanced position of the cluster as a business partner Below there is a summary of the results for the examined sub-area. Chart 115. The average and the highest value of the indicator under the sub-area Impact on business environment Improved international competitiveness of the cluster Average value of the indicator The highest value of the indicator Enhanced position of the cluster as a business partner Attracting new contractors (domestic and foreign) Increased market importance of the cluster and the region Attracting new talents (experts, specialists, etc.) to the region Benchmark value for the sub-area Impact on business environment Average value for the sub-area Impact on business environment The objectives connected with impact on business environment are among the most important strategic objectives of clusters activity in Poland, which is reflected in very high benchmark values and a high average value. The indicator which received a particularly high average value is Increased market importance of the cluster and the region. Another objective which is essential, though to a lesser extent, is importance of the cluster as a business partner as well as attracting new talents to the region as well as attracting and

219 Number of clusters gaining new contractors (domestic and foreign). Improved international competitiveness of the clusters is significant only in a moderate manner. International competitiveness The surveyed clusters assessed improved international competitiveness as their strategic objective in a various way. 4 clusters practically do not consider it a part of the strategy (points 0-1) and for the other 10 it is important only slightly (points 2-4). Improved international competitiveness is perceived as an important element of the strategy (points 5-7) by approx. 35% of clusters and the other 15 declare that it is one of their very important strategic objectives. The average number of points assigned to this indicator amounted to 5.73 which is a relatively low value when compared with other indicators. On the other hand, this objective has more significance for clusters operating in more innovative sectors and to those which comprise a greater number of entities. Chart 116. Improved international competitiveness of the cluster Score on a scale of 1 to 10 The results indicate that most clusters in Poland are focused on their activity on the domestic market, with particular consideration of regional conditions. Most clusters have not achieved yet the critical mass which would allow them to compete with similar structures in other countries. However, also some small clusters undertake certain actions they conduct surveys concerning the demand on the foreign market or search new markets for their products and services through participation in fairs. Low assessment in this regard does not mean that the clusters do not undertake international activity at all cooperation with entities (often with clusters) from other countries is usually aimed at exchange of experience, strengthening of project opportunities and search for new markets for their products and services or for new contractors. Improved international competitiveness of the cluster is not that significant since the surveyed entities are in majority not recognisable outside Poland.
220 Number of clusters Attracting new contractors For almost all clusters the issue of attracting new contractors (both domestic and foreign) constitutes a rather important strategic objective. Almost 85% of participants in the survey assigned to this factor 7 or more points. Only one cluster considered this objective as of low importance. The average value assigned by clusters to this indicator amounted to Members of clusters take actions which in a long-term perspective are supposed to result in attracting new contractors. Such actions include: attracting new companies to the cluster (often through active participation of the members of the cluster's structure) the number of new members attracted within the last two years in relation to the current number of members amounts to about 25%, which points to low effectiveness of such actions, participation in trade missions or study visits however, these activities rarely take place if the cluster receives no co-financing from external resources, promotion of the cluster through activities related to marketing and PR and also through their members - promotion of the clusters on the domestic market is rather positively assessed, particularly among those clusters which have received financial resources for promotional activities; however, the number of marketing activities pursued outside Poland is small as well as the number of clusters having information on their activity prepared in a foreign language. The clusters need to increase the number of activities and their effectiveness in order to gain new contractors. This may be achieved through preparation of higher quality information materials or websites on clusters as well as by means of social networks. Also participation in fairs and exhibitions would contribute to achievement of the discussed objective. Chart 117. Attracting new contractors Score from 1 to 10
221 Number of clusters Attracting new talents The surveyed clusters try to attract new talents to the region. The lowest numbers of points assigned to this indicator amount to 5 and 6 points and were selected by 7 clusters. In case of the remaining approx. 85% of clusters, the issue of attracting new talents to the region is to a large extent or even to a very large extent a strategic objective (7 points or more). The average value assigned by clusters to this indicator amounted to Chart 118. Attracting new talents to the region Score from 1 to 10 Potential future employees of the clusters operating in innovative sectors are concentrated mainly in several larger academic centres in Poland. Some clusters undertake activities aimed at attracting new employees (graduates) to the region. Such activities include promoting the cluster at universities, offering students traineeships or the possibility of writing their diploma theses on the subject of the cluster and its participants as well as exerting influence on the fields of study within technical education. Attracting new talents is, however, limited to persons who enter the labour market, while the results of surveys indicate that the clusters do not undertake activities aimed at gaining experts and experienced employees. It is rather preferred to invest in the already existing human resources, by offering a system of trainings, workshops or postgraduate studies. The results in relation to development of human resources are satisfactory. Attracting new talents to the cluster is one of the five most important strategic objectives, among others, for the clusters which comprise more than 30 participants and for those which operate in more innovative sectors. For such type of clusters having appropriate personnel is one of the key factors determining their success and, thus, it is of high importance for them.
222 Number of clusters Market importance of the cluster and the region Increased market importance of the cluster and the region was considered a strategic objective by all surveyed clusters. According to the respondents, it is the most important among all strategic objectives of the cluster activity in Poland. Only one of the clusters assessed this objective as less significant (4 points) but for the remaining 44 clusters this objective plays an important role. As many as 25 clusters assigned the highest number of points (9-10) to this indicator. The average number of points amounted to The clusters undertake activities aimed at achieving the discussed strategic objective. These include both small-scale actions promotion in the press or presentations during conferences, as well as activities with wider reach organisation of fairs or lobbying for the cluster. All surveyed clusters conducted at least one of the above-mentioned activities. The outcomes of marketing processes and activities in the field of public relations conducted in the clusters are significantly higher than for other types of processes. Such high importance assigned by the Polish clusters to the strategic objective consisting in the increased market importance of the cluster and the region may also indicate that, according to the respondents, the importance of clusters in Poland is slight. They perceive that they have no real impact on the policy towards clusters in the region or on the policy towards the sector at the country level. Some clusters are also not known to a wider public due to the lack of real benefits resulting from the membership in such cluster or due to a low number of members, with majority of companies from the SME sector. Chart 119. Increased market importance of the cluster and the region Score from 1 to 10 The cross-sectional analysis points to the negative correlation between the amount of the received external resources, the level of innovation in the cluster s sector and importance given to the increased market position of the cluster and the region as specified in the cluster's strategy. The clusters which want to develop their activities in order to build the
223 market importance of the cluster and the region are mainly those which operate in traditional sectors and have not received external financial assistance. Additionally, it may be noticed that this factor is more important to those clusters which comprise more entities. The clusters undertake activities aimed at increased importance of their brand also in terms of efforts to become a sign of quality. However, the number of activities targeted at increased importance of the region s brand is smaller. The conclusion from the above statement is that more activities could be undertaken together with self-government administration. These could lead to increased importance of the region s brand and at the same time could promote the cluster as an important element of the region. Enhanced position of the cluster as a business partner Also enhanced position of the cluster as a business partner is one of the most important strategic objectives for the clusters. It is ranked at the fifth place among all strategic objectives examined in the survey. More than 85% of clusters assigned to this indicator 7 points or more, which means that increased importance of the cluster in this regard is for them a significant or a very significant element of their strategy. Other 5 clusters assigned to this indicator 5 or 6 points and another one - 2 points. The average value assigned by clusters to this indicator amounted to The discussed objective is in a certain way similar to the previous one, except that increased market importance includes, first of all, activities aimed at recognisability of the cluster, while increased importance of the cluster in its environment points to the activities targeted at strengthening the cluster's impact on its environment, particularly the non-market environment public institutions, centres of expertise, scientific and research entities or business environment entities. At the present stage of development most clusters do not have the equivalent position in relation to its environment and are not treated as important business partners. The clusters have no significant influence on the self-government politics, allocation of financial resources, educational changes or the region's infrastructure. Their influence on the central government s politics is even less significant. The clusters, being aware of their weak position in relation to their environment, try to undertake activities aimed at increasing their importance in this regard. These include, mainly, cooperation with the selfgovernment but also with other clusters, including foreign ones. However, it should be underlined that the outcomes of these activities are limited. The strength and position of the clusters in relation to their environment is assessed as moderate (average number of points assigned at the level of 5.24).
224 Number of clusters Chart 120. Enhanced position of the cluster as a business partner Score from 1 to 10 The clusters search for new opportunities to increase their influence on their environment by means of building on foreign experience or through joining the activities conducted by other clusters, including those operating outside Poland. However, they still have no appropriate instrument which could increase the clusters influence on their environment. A solution which could help overcome this problem is increased cooperation among clusters within the region or within the sector in order to lobby for such region / sector. Another proposition consists in creating an entity which would represent the interests of clusters at the national level. Summary To sum up, in the sub-area of impact on business environment the average value of points assigned to the five discussed indicators for all clusters amounts to According to the respondents, it is the most important sub-area comprising strategic objectives of the clusters. Two clusters which assigned the highest numbers of points within the discussed sub-area achieved the results amounting to The analysed clusters comprise more than 60 entities and have received external co-financing. None of them operates in the sector with low level of innovation. The points assigned indicate that the clusters operating in more innovative sectors attach more importance to their impact on business environment. The clusters undertake certain activities aimed at increasing their impact on business environment. These include, first of all, cooperation with self-government administration entities, scientific and research entities and other clusters. The clusters undertake also activities related to marketing and PR. These should help the clusters achieve the most important objectives related to the discussed sub-area: increased market importance of the cluster and the region and enhanced position of the cluster as a business partner. These
225 elements constitute weaknesses of the clusters and therefore the clusters efforts to strengthen their position and recognisability will be more intensive. The most important among the discussed objectives is increased market importance of the cluster and the region as well as enhanced position of the cluster as a business partner. Thus, the clusters aim at improvement of their position and recognisability, both among business entities as well as among public institutions. This is being achieved by means of marketing and lobbying activities. Achievement of the above-mentioned objectives is to a lesser extent being pursued through improvement of the innovative character of the cluster which would strengthen the cluster s brand. What should be improved is first of all cooperation with public administration entities. Only some clusters undertake formal activities in order to make public entities aware of the problems concerning the functioning of the clusters or the sector in which they operate. To a large extent this is due to their belief that such activities will not yield any significant results. The conclusions from the analysis of the clusters' cooperation with public entities allow emphasising that this area of the clusters activity requires more work, both on the part of the clusters and the authorities. Unilateral activities in this area will not give any results. The clusters should also search for new approaches to the issue of strengthening their importance, both on the market as well as among the institutions from their environment. This may consist in using new media and social networks for promotion purposes, searching for strategic partners (e.g. large enterprises from the cluster's environment, institutions providing support or well-known foreign clusters), as well as promoting clusters in unconventional manners. Increase in the number of such activities, conducted in cooperation with public administration, would improve relations between the clusters and such public entities and would lead to increased importance of the region Impact on the natural environment The sub-area Impact on the natural environment covers the following indicators: Promoting ecological behaviour Development of technologies using renewable energy sources Increased cooperation (external and internal) in relation to environmental protection Below there is a summary of the results for the sub-area Impact on the natural environment. Chart 121. The average and the highest value of the indicator under the sub-area Impact on the natural environment
226 Promoting ecological behaviour Average value of the indicator Highest value of the indicator The highest value of the indicator The highest value of the indicator Increased cooperation (external and internal) in relation to environmental protection Development of technologies using renewable energy sources Benchmark value for the sub-area Impact on the natural environment Average value for the sub-area Impact on the natural environment The sub-area "Impact on the natural environment is the least important among the strategic objectives of the clusters, when taking into consideration the average values of indicators for this sub-area. However, this is related to the fact that only some of the surveyed clusters operate in sectors connected, directly or indirectly, with environmental protection. The most important among the three discussed factors is promoting ecological behaviour. Less importance is attached to development of technologies using renewable energy sources and to increased cooperation in relation to environmental protection. These objectives are only moderately important for development of the clusters. Ecological behaviour The surveyed clusters present various attitudes towards promotion of ecological behaviour. It should be highlighted that only several clusters are directly involved in activity connected with ecology - these which deal with ecological energy industry or environmental protection. Activity in this regard is significant also for those clusters which use the advantages of clean natural environment or which try to enter new markets and, following global trends, aim at reducing energy consumption of their products. For 20% of clusters promoting ecological behaviour does not constitute a strategic objective or is a strategic objective of low importance (points 0-3). Another 10 clusters assigned to this factor medium scores from 4 to 6 points. In the case of the majority of participants in the survey, promotion of ecological behaviour is an important or a very important element of their strategy (points 7-10). Among them as many as 10 clusters assigned to this issue the highest possible number of points The average value assigned by clusters to this indicator amounted to 6.36.
227 Number of clusters Chart 122. Promoting ecological behaviour Score on a scale of 1 to 10 Not many clusters undertake activities connected with the discussed objective though there are some cases of campaigns promoting ecology organised by a cluster or in cooperation with the authorities. For some clusters dealing with production of ecological goods, promotion of ecological behaviour belongs directly to their area of marketing and sales of products. Technologies using renewable energy sources For a significant part of clusters (almost 30%) development of technologies using renewable energy sources is not a strategic objective of their activity at all or is important for their development strategy only to a minor extent. For another 5 clusters it constitutes a factor of low importance. The other 26 clusters assigned 5 or more points to the discussed indicator, including 10 clusters which gave it the highest number of points. The average value assigned by clusters to this indicator amounted to 5.38.
228 Number of clusters Chart 123. Development of technologies using renewable energy sources Score from 1 to 10 Similarly as in the case of the above-mentioned indicator, for clusters operating in the sector of renewable energy, development of technologies using renewable energy sources is connected with their current activity and constitutes a fundamental target. Cooperation in relation to environmental protection For 12 clusters increased cooperation in relation to environmental protection does not belong to the strategy of operation or belongs to such strategy only to a minor extent (points 0-3). For another 12 clusters it constitutes a strategic objective only in a moderate manner (points 4-6). More than 45% of clusters assigned 7 or more points to this indicator, including as many as 10 clusters which gave it the highest number of points. The average value assigned by clusters to this indicator amounted to 5.89.
229 Number of clusters Chart 124. Increased cooperation (external and internal) in relation to environmental protection Score from 1 to 10 Some activities undertaken by the clusters, aimed at increasing their market importance or income, additionally contribute to promotion of environmental protection or saving natural resources. However, not many clusters undertake activities targeted at increased cooperation in relation to environmental protection itself. Summary In conclusion, the average number of points assigned to the three discussed indicators in the sub-area "Impact on the natural environment" for all clusters amounted to The clusters with the highest results in this sub-area achieved similar results at the level of 10. These clusters include not only entities connected with environmental protection or energy-saving technologies but also clusters which operate in traditional sectors and seek new markets for their products through production of ecological goods. The results achieved by the clusters indicate that the amount of received external resources does not translate into the issues connected with impact on the natural environment. There is also no visible relation between the innovative nature of the cluster's sector or its size and the points assigned under this sub-area. The clusters undertake certain activities aimed at increasing their impact on the natural environment. Such activities are undertaken mainly by the clusters operating in the sectors related to ecological energy industry or environmental protection. Such activities include campaigns advertising ecological behaviour since such behaviour comprises also purchasing products and services offered by the cluster. The clusters operating in traditional sectors of
230 industry conduct research in order to produce environment-friendly goods. Demand for such products is increasing and, additionally, strategic documents of the European Union underline the growing importance of ecology in the economic policy of the Community, which results in promotion of ecological products and discouraging from purchasing products with adverse effect on the natural environment. 11. Conclusions and recommendations Analysis of the information received at the survey makes possible formulating conclusions and recommendations for different cluster policy entities in Poland. Conclusions and recommendations have been presented according to the following categories: 1. Results and conclusions of the survey. 2. Conclusions and recommendations from the survey addressed to coordinators and entities functioning in clusters; 3. Conclusions and recommendations from the survey addressed to entities shaping cluster policy at national level 4. Conclusions and recommendations from the survey addressed to entities shaping cluster policy at regional level. 5. Methodological conclusions and recommendations, improving the methods and tools of cluster analysis and cluster benchmarking Conclusions of the survey The survey covered cluster resources and processes. It also included the development potential of clusters and their strategic objectives. Also the results of the clusters related to the implemented measures were presented. These results illustrate the efficiency of cluster functioning, as they enable a simple deduction how cluster resources are relevant for the real added value, i.e. the improvement in innovativeness, competitive standing, internationalisation or development of a cluster s human resources. The results of the survey with the indication of the benchmark's value and average value for all the investigated areas have been presented below.
231 Chart 125. Benchmark value and the average for the analysed areas The clusters covered by the analysis are characterised by diversified level of development of the surveyed areas. It is confirmed both by significant differences in the scope of benchmarks values and by the average value for particular areas. Benchmark values are based upon real values received by cluster, and upon the evaluation by respondents and pollsters (on the basis of respondents answers). Clusters achieved better results where qualitative indicators were used, and worse where quantitative results were used. The lowest results were noted in the areas of cluster resources and cluster results. The results of the analysis of the cluster resources area indicate that entities covered by the analysis do not possess sufficient resources for task implementation. It applies mostly to financial and infrastructural cluster resources. A huge difference between the benchmark value and the average value for all analysed clusters points to a significant differentiation of clusters in this respect. The number of persons employed in entities being cluster members varies from 60 to more than Few clusters have coordinators who are able to fully involve in task implementation related to cluster operation. It results from the lack of financing to cover the costs of a coordinator s activity. This issue is particularly affecting clusters in the initial stage of development. Temporal and financial limitations influence the lack of the opportunity of full involvement of the coordinator in activities for the cluster and the use of many development opportunities. The weakness of human resources largely influences the cluster activity, processes and results. A small number of persons employed in R&D sector is reflected in relatively small innovativeness of Polish clusters. At the same time, a high level of education of cluster employees indicates to high development potential of clusters. Finances clusters have amount from PLN 0 to 23 million, and the surface of accessible laboratories varies from 30 to m2 (considering only the clusters which have such surface). The analysed clusters are mostly small and young structures operating only for a
232 couple of years. In most cases they do not have and cannot get adequate funds. Clusters which did not receive external co-financing during the last two years for the implementation of joint projects had funds amounting to PLN thousand. These amounts are very low compared to the resources clusters got from the external sources. It points to huge difficulties in financing cluster activity from own resources. It transpires from the information received in clusters that the activities undertaken in the area of financing are focused mostly on seeking external sources of financing joint projects. We lack knowledge about alternative sources of financing cluster activity. That is why cluster activity is largely dependent on accessibility of public grants, which is disquieting in the long-term perspective (the fear of making cluster operation depend in a long-term perspective on external funding). On the other hand, though, cluster development in the first development stage is very difficult without the external support. Respondents did not report difficulties with access to laboratory equipment. They rather reported lack of ideas for its use under cooperation with R&D units. It means that the laboratory potential of clusters is not directly equivalent to activities undertaken by clusters in this scope. It transpires from the information gathered at the interviews that in case of many clusters there is no active cooperation between enterprises and scientific units despite the fact, that R&D institutions are officially cluster members. The lack of active cooperation between the R&D and business sectors affects the number of organisational, marketing or product innovations implemented by Polish clusters. Cooperation with universities in many cases is based upon educating future staff or the opportunity of professional workshops in cluster companies, not necessarily at the attempt to implement theoretic solutions developed at universities. The clusters which operate in more innovative sectors (of moderate to high innovativeness) have more resources than the clusters operating in traditional sectors. They have access to bigger laboratory surface and better qualified human resources. The analysis showed positive assessment of cluster processes including knowledge exchange, internal communication and marketing and PR. The differences between clusters result in a large extent from the specificity of the sector they operate in. The differences also result from diverse objectives of cluster activity and from earlier experiences in cooperation of cluster members. Clusters undertake joint efforts of diverse scope of influence. Preparation of a joint product is an example of large-scale activity. A popular smaller-scale enterprise is the development of a joint advertising brochure. Joint activities cover mostly the exchange of information, knowledge and experience among the cluster members, and preparation of joint leaflets and web pages (marketing activities). Cluster members exchange commercial and technology data, information on untrustworthy customers or clients, and provide mutual support in the exchange of information about changes in law, opportunities to apply for joint project implementation or to cooperate with individual cluster members. However, this is not happening in all clusters, as in many clusters limited level of trust among the cluster members is observed. They are reluctant to exchange particularly significant information on such occasions, e.g. information about customers, prices, or development opportunities. According to the survey results it may be concluded that cluster members may communicate efficiently, using different tools to this aim (meetings, events, delegations, the Internet, communication platforms, newsletters etc.) regardless of the amount of the cofinancing, the number of entities in a cluster, or the level of innovativeness of the cluster s sector.
233 However, such types of activity as development of a joint market offer or technology transfer between cluster members are undertaken only by a part of the analysed entities. These results from the introductory phase of cluster development, lack of financial, organisational and legal support, as well as from a limited cluster activity, related mostly to the passivity of their members. The link between the level of innovativeness of the cluster sector, and technology transfer is clearly visible. In case of the clusters operating in sectors of low innovativeness, or traditional sectors of economy, such technology transfers are rarely a condition of optimum activity. However, in the case of clusters which operate in highly innovative sectors, technology transfers are often the main objective. The smaller benchmark value was noted in the areas related to cluster results. The average value of the results of all clusters for this area is also low. Activities undertaken by clusters and their resources do not necessarily influence the improvement of their results. Cluster membership does hot lead to the improvement of competitive standing of companies, but is favourable (though to a limited extent) for improving innovativeness. Nominal results of clusters in this area are low, but it is worth noticing that they exceed average results of Polish enterprises. A conclusion may be risked in this context that the presence of companies in a cluster leads to their improvement of innovativeness, though to a small extent. Despite 1 in 3 analysed clusters operate in highly innovative sectors, the activities related to providing legal protection of the innovations implemented in a cluster are undertaken by the clusters only on a small scale. Cluster members do not make big investments in R&D. Lack of adequate instruments of support for clusters, which would encourage the clusters to increase their research activity and presence on the international scene, is also a significant problem. A separate issue is lack of awareness with respect to the opportunities of undertaking joint activities by clusters. This is a particularly important issue, taking into account the growing importance of innovativeness in economic policy of the State. The activities undertaken by clusters i.e. limited activity with respect to the joint offer, distribution or one flag product of a cluster, have a limited effect on the improvement of competitive position. Even joint marketing activities aim at cluster promotion rather than directly improve the situation of the cluster's members. Therefore low results in the improvement of competitive position are the effect of a small number of initiatives undertaken to this aim. Attracting new members to the clusters is limited. It mostly results from the small awareness of the advantages of the present and potential cluster members. The declared advantages relate more to cooperation or human resources development than to the improvement of the enterprises results. In this situation sustainability of at least some cluster structures may be at risk. The respondents pointed to the cases of the participants withdrawal from the cluster when they realised that own contribution (temporal and financial) is necessary for the success. That is why measures for attracting new members should be intensified. The main motivating factor which increases the force of attracting new members would be the improvement of competitive position of the present cluster members. Another solution is the use of direct promotion for potential members (though it will be difficult to attract them without pointing out the advantages). The most important factor building the potential of Polish clusters are active coordinators, who aim at increasing the competitive advantage of clusters. Many cluster members participate in international commerce. Clusters themselves are remotely interested in cooperation with foreign units. The undertaken measures with regard to internationalisation (not all clusters took such measures) and the low assessment of increasing the international position of a cluster as a strategic activity point to the fact, that
234 the area is not significant or appreciated from the clusters' perspective. However, activity of some clusters in this field brings significant results the exchange of experience, the opportunity to take part in international projects, or getting better information about foreign markets. That is why it seems that clusters lack awareness with respect to the opportunities to exchange foreign experiences in their activity. Increasing this awareness would probably result in a better assessment of clusters in the internationalisation area, and in making use of such opportunities. The effect could be increasing cooperation in research, technology transfers from abroad, increasing export or finding cheaper suppliers of raw materials from other countries, better integration of cluster member and much more. Clusters positively assess their own growing potential. The position and activity of coordinators are assessed particularly well. Additional activities to this aim 80, in progress at the moment, will enable the better use of the growth potential of persons working for clusters coordinators and leaders. The results of the survey indicate the insufficient position of the leaders and insufficient activity of other cluster members. The influence of financial and organisational support by the public authorities and the opportunity to use private external funding were listed among the factors influencing cluster growth potential which received the lowest score. This conclusion is indicative, again, of big problems of clusters related to the financing of their activity. Particularly significant cluster development factors are: investment attractiveness, economic traditions in the region and cooperation with R&D units. Some entities have used the long history of cooperation, which had been originated prior to cluster formation. Some entities use the traditions related to values of a given region (e.g. promotion of regional cuisine, tourism attractiveness) or its history. The use of the potential of particular regions was often listed among the factors influencing a cluster s success. In some clusters attention was paid to the significance of earlier links of the present cluster members, as an important factor building confidence and supporting the present cooperation. The use of potential and economic traditions of the local community is one of the factors which makes it easier to establish a cooperation and determines the success of a given cluster structure. The process is much more difficult in the case of entities which do not use such potential. Some clusters encounter obstacles in cooperation with R&D units. Clusters point to the lack of support system with regard to the way of cooperation and legal and organisational solutions, or in some cases also to the lack of determination to strengthen joint activities both on their part and on the part of the units of R&D sector. Clusters were highly graded (both with respect to the benchmark value and to the average value) in the area of cluster strategy. Three most important strategic aims of the clusters covered by the analysis were: the increase of the market significance of the cluster s brand and the region s brand, the opportunity to get financing for the cluster, information flow and diffusion of innovations through informal contacts. Strategic goals clusters aim to achieve may include taking advantage of the scale effects, influencing the entrepreneurship environment, creating a knowledge and innovation These measures include a.o. free training implemented at the PAED request and financed by the EU Cooperation ties of Polish enterprises
235 network, and influencing the natural environment. Generally speaking, influencing the entrepreneurship environment matters most for the clusters. Therefore, clusters aim mostly at the improvement of their position and recognisability, both among business and public units. The goals relative to the achievement of scale effects are particularly important for the clusters active in traditional branches of low level of innovativeness. What matters least is achieving goals relative to influencing natural environment, as they are largely related to the sector of the cluster's activity. Clusters take already certain steps which will enable them to use the scale effects. First of all they develop a (largely) joint offer of the cluster and conduct lobbying activity toward the authorities. Joint commissions or sales by joint distribution channels are less often. Also with regard to the improvement of competitive situation clusters do not have good results the dynamics of their development is slow (only as little as 25% of the present members were included in clusters during the last two years) and only in five clusters start-up enterprises were founded. Still, clusters value much achieving of scale effect. They consider factors related to it their strategic goal, mostly with regard to the factors related to the opportunity of receiving funds and lobbying to the cluster (or the sector). The awareness of the clusters as to the opportunity of achieving the synergy effect through shared production or purchase of raw materials is still small. The flow of knowledge and diffusion of information through informal contacts, and the development of competence through lifelong learning are among the important goals. Clusters aim therefore at increasing innovativeness largely through the development of human resources. It is implemented on a smaller scale through purchase or transfer of technological solutions or cooperation with R&D units. The area wants improvement, as the flow of knowledge and diffusion of innovation should happen on many levels so as to develop complex solutions. Cooperation with scientific units, despite their membership in a cluster is the unused cluster growth potential. Therefore, a support for this cooperation is necessary, mainly through building awareness among the cluster members concerning the opportunity to undertake joint activities with R&D units. The most important goal among the discussed objectives is the growth of market value of cluster brand and region brand, and the improvement of a cluster s position as a partner of the environment. Therefore, clusters aim mostly at the improvement of their position and recognisability, both among business and public units. It is implemented by marketing and lobbying activities. The achievement of the enumerated goals is done by improving innovativeness strengthening the cluster s brand. The conclusions from the analysis of the clusters cooperation with public units make it possible to indicate this area of cluster activity as the area requiring work both on the part of clusters and authorities. One-side activities in this area will be ineffective. Clusters should also seek new approaches to strengthening their position, both on the market and in the environment of institutions. It may be using new media and social networks for promotion, seeking strategic partners (e.g. big enterprises from the cluster's environment or support institutions or known foreign clusters) and unconventional promotion. Increasing the number of activities carried out jointly with public administration would improve the clusters relationships with these entities, and would enable brand strengthening in the region. C.a. 62% of clusters have formal development strategies, but few entities implement their provisions in practice. In most cases clusters admit that they do not prepare operational
236 working plans and do not have the ability of managing projects. This issue requires improvement so that the declared strategic goals be achieved, and not only remain the wishful thinking on the clusters' part Conclusions and recommendations from the survey addressed to coordinators and entities functioning in clusters Building awareness of the advantages of cluster membership Despite the idea of clustering being promoted in Poland for a few years now, the results of the survey indicate that it is not adequately understood by enterprises. Enterprises associate cluster formation mostly with the opportunity to use the EU funds for this activity. The results of the interviews that have been carried out indicate that entrepreneurs often lack the awareness of other opportunities related to cluster activity. Creating cluster structures provides most of all the opportunity to use the internal potential of particular entities, which achieve the synergy effect through cooperation. Clusters combine the advantages of specialisation, flexibility and competition of independent entities with the advantages of scale resulting from cooperation. Companies acceding to a cluster often seek quick effects without involving their own resources. This tendency is slightly disquieting, as in case of the lack of opportunities of further support of cluster activity from public funds, a significant probability exists of diminishing of this form of organisation of entrepreneurship in Poland. Seen from this perspective, a coordinator plays a very important role in the cluster, at least at the beginning of its activity. The role consists of making the cluster members aware, a.o. that achieving the results of joint activity of the members depends on the involvement of particular members. Entities which accede to a cluster should therefore get to know the advantages of cluster participation, but above all should be aware, that a cluster is a form of cooperation, which requires from them sharing responsibility for the undertaken activities. Cluster participation is also connected with the need of financial, temporal and personal involvement on the part of the members. It is recommended that the coordinator increase the members awareness of the advantages related to the cooperation of enterprises in a cluster. Easier access to the source of financing is an important factor, but only one of all that may be used. It transpires from the information received from the clusters that opportunities of getting funding for projects are currently one of the most important reasons for entrepreneurs' membership in clusters. Only in a few cases the area was not indicated by the respondents as important. Currently this is one of the key strategic goals of cluster activity in their opinion. That is why, using other instruments, the coordinator should build the awareness of cluster members and the entities which are interested in membership, with respect to other than financial advantages of cluster membership and to types of cooperation which foster satisfying results. It may additionally present, on practical examples of other clusters, effects of joint activity as a longterm process, indicating, that the effects cannot be achieved immediately. Providing a high level of awareness among the enterprises in a cluster and its potential participants will enable understanding of cluster processes and contribute to achieving better results in the future. Recommended actions:
237 informing cluster members and potential members by the coordinator (with the use of diverse forms of communication) about the advantages of cluster membership, including non-financial advantages organising/proposing to participate in joint projects to experience the advantages from the cooperation, presenting by the coordinator of the experience and results of cooperation on the examples of other clusters, maintaining sustainable contact with potential cluster members. Building mutual trust One of the most important barriers indicated by clusters is insufficient level of mutual trust among the members. It affects partners cooperation and impedes cluster development. Coordinators often highlighted how difficult it is to attract new entities to join the cluster and how time-consuming and long-term the process of building mutual trust is. Relationships build upon trust constitute one of the most important factors determining the positive results of cooperation in cluster structures. That is why one of the most important elements of a coordinator s work should be strengthening the area of mutual trust. Many important experiences in the area of building mutual trust were presented in the report as best practices which may constitute recommendations for the coordinator and cluster members. These include using tools which aim at building social capital and integration of cluster members, through, a.o. introduction of a system of cooperation consisting of equal treatment of all members, organisation of meetings and integration events or development of the code of ethical cooperation. Using such solutions increases mutual trust of cluster members, the desire to cooperate and strengthens the process of exchange of knowledge and experience. Recommended actions: organisation of integration events, organisation of meetings, at which cluster members present their offers, developing of the code of ethics by cluster members Strategic planning of activities and optimisation of management processes Another aspect of cluster operation which needs improvement is strategic approach to planning of activities and optimisation of management process. Not all clusters have set the development strategy, and even in those who have, it is often informal. What is more, activities on the operations level are rarely planned. In some cases tools of analysis of expectations of particular cluster members are used. Such a situation results from the fact that coordinators often volunteer for cluster activities and have to reconcile this function with their basic professional activity. This results from the necessity to limit expenditure related to administrative activities of a cluster, if there is no possibility of financing such activities from the external sources. Few clusters have coordinators who are able to fully involve in task implementation related to cluster operation, which is directly reflected in the efficiency of their operation. Due to the fact, that the majority of clusters cannot afford to finance specialised cluster animators, it is necessary to organise task division among cluster members in such a way, as to optimise cluster management processes with limited funds.
238 No universal formula of cluster management exists, which would be efficient in all such structures and which would guarantee effective management. The adapted functional solutions should result from the needs of a given organization. It should be pointed out, though, that - particularly in the case of lack of opportunities to involve additional administrative service, operational management may be made easier through setting additional bodies. Increasing efficiency of task implementation under the cluster may be achieved through the division of responsibility between the coordinator and specialised supporting bodies. It is recommended in this context to use the best experiences of Polish clusters with respect to the opportunities of organisation of work in a cluster (recommended actions have been presented below). They enable more efficient decision making in selected areas of cluster activity and facilitate the coordinator s work. Recommended actions: selecting thematic groups to implement selected tasks, which enables better organisation of work and involvement of persons with thorough knowledge in a given field, selecting additional management supporting bodies, i.e. the Cluster Council, the Presidency of the Cluster Council, the Steering Committee, etc. delegating sector groups to implement projects for a given sector Activation of cluster members The opportunities of organisation of work in a cluster are also a means of activating particular cluster members, as they strengthen the role of leaders in a cluster. This is particularly significant, taking into account the threat to maintain continuity of cluster operation, i.e. the change of a coordinator. The charisma and involvement of the cluster leader often determines its success. It was often indicated at cluster verification (in the initial stage of the survey) that a cluster which was dynamically operating in the past, ceased its activity after the coordinator s leaving. The survey also proves that the strength and the position of cluster members in animating joint activity are smaller than the coordinator s. The coordinator s resignation of the function may affect further operation of the cluster structure in this context. Therefore it is recommended that the clusters undertake activities aiming at constant improvement of competences of particular leaders, which will provide their sustainable operation. Using solutions involving particular enterprises in the tasks implemented by a cluster and building leaders competence will be helpful in this respect. An example of such activity is establishing working groups and delegating project implementation to their authors. It enables creating a base of potential coordinators, who will be able to take over the responsibilities of the leader, should the need occur. Moreover, through the involvement of all the cluster members in particular projects, an opportunity exists to build partner relationships and trust, and improvement of internal communication. Recommended actions: delegating project implementation to the authors of the project (the cluster member who proposes the initiative is responsible for its implementation, with the support of other members of a group of members delegated to the task) strengthening of the role of the cluster leader through meetings of leaders, participation in training, building leadership (soft) skills. Database of cluster members
239 The performed interviews and received information indicate that cluster coordinators often lack sufficient knowledge on cluster members. The lack of an up-to-date database on the members (the list of members and contact information) renders contact impossible, hence raises concerns about the efficiency of cluster operation. That is why coordinators should gather basic information about cluster members. Up-to-date knowledge in the form of a list or a database, accessible for all members would facilitate communication, and would enable holistic approach to a cluster as a structure composed of particular members. Recommended actions: creating by the coordinator of a database on cluster members and its updating (in determined periods, e.g. on a quarterly basis), providing access for the cluster members to the database, which would facilitate contact and furthering cooperation Analysis of training needs Training is one of the most often undertaken initiatives in clusters. At the same time only a small part of the employees of cluster companies (ca. 2.4%) could use this opportunity. The training offer is not always responding to the needs of cluster members. At the same time, cluster members use external training only to a very limited extent to improve the quality and qualifications of their employees. Currently, due to co-financing from the EU funds, private companies offer many training opportunities at low prices. Information about the training opportunities is not gathered and analysed by cluster members, though. Therefore it is recommended that the coordinators undertake activities, which would result in the increase in external training participation of cluster members. Recommended actions: analysing training needs of the cluster members, monitoring of the training offer, mostly of the training co-financed from the EU funds and providing information to the interested parties. Financing cluster activity The area of financing cluster activity turned out to be the weakest link in the areas surveyed under cluster benchmarking. As it has already been mentioned, acquiring funds for project implementation is one of the most important objectives of cluster activity. Conclusions from the survey and examples of the activity of the best clusters prove that both substantial and financial support is indispensible for the undertaken initiative. Few initiatives may permit themselves to finance their activities from their own funds. Even small external financing makes it possible to strengthen the coordinator s position in a cluster, and, therefore, to enables them to undertake more activating measures for cluster members. The policy of public authorities, which aimed at activating cluster structures and fostering entrepreneurs cooperation, resulted in the creation of many clusters and cluster initiatives. Through the systems of incentives and support, clusters were convinced that they will bet public-funded, long-term support of their activity. Cluster representatives obtained financial
240 resources both for development of strategic documents and for covering administrative costs. After the opportunity of financing such activities from the EU funds ceased, many clusters ended their activity, as they were not sufficiently prepared for financing their activity on their own. Lack of external financing constitutes the biggest obstacle for many clusters, which evaluate the efficiency of their activity especially at the initial stage of their existence through the perspective of external financing. The main motivation for these entities at the stage of cluster formation was the desire to get the EU co-financing. A recommendation for clusters with regard to finances is creating own mechanisms of financing cluster activity, which will be an alternative for public funds. These mechanisms will guarantee cluster s operation in the situation of lack of external financing. Public funds cannot constitute the sole source of financing the present activity of a cluster, and in time clusters should start to function without public assistance. The use of alternative financing mechanisms would permit clusters to obtain the means for the current activity, including the office and necessary expenditure 194 related to their operation, and could be allocated for cluster development projects. Recommended actions: introducing membership fees (even small, but underlying the value of participation in costs of cluster operation), collecting a percentage from the value of each contract signed by a company due to the cluster membership, collecting a percentage from the value of sales executed by a joint internet platform, reducing cost of cluster operation through execution of joint commissions for the members (e.g. contracts with energy, telecommunications providers, joint accountancy), and allocating thus acquired savings to the cluster activity, attracting a finance institution to become a cluster member (e.g. a bank, a leasing institution), which would offer better conditions of financing than the market offer to the remaining cluster members. Increase in innovativeness One of the areas that got the lowest score results in the cluster benchmarking process is the score for cluster innovativeness (though, due to the difficulties in acquiring reliable data interpretation of the results should be done with caution). Only 13% of the surveyed clusters have legally protected innovations. 28% do not have expenses on R&D. In the case of 40% of clusters the share of expenditure on R&D in the expenses on innovation is slight and amounts to less than 10%. In case of many clusters there is no active cooperation between companies and R&D institutions, even though the latter are often cluster members themselves. No common R&D activities are implemented. There are many reasons for this state of affairs, but the most significant are: the necessity to include an R&D institution in a cluster in order to get co-financing from the EU, even though, practically speaking, no cooperation is established with such a unit, lack of ideas for the area of cooperation, no funds for R&D activity.
241 Such a situation results in a relatively small amount of implemented innovations and limited technology transfer in clusters. Diffusion of technology among the cluster members happens usually with the use of the simplest possible tools and ways of imitation of behaviour. Key innovations implemented by the best Polish clusters require though a big involvement of the R&D units. A conclusion from the situation in this respect is the necessity to increase the share of the sector of science in creating new products/services, which will make possible building competitive position of clusters on the market. Clusters should, however, adequately communicate their needs in this area to public authorities, and increase cooperation in the so-called triple helix. 81 A recommendation for clusters regarding increasing innovativeness is most of all the analysis of opportunities for involvement of R&D institutions in the process of seeking and developing innovative solutions not only with respect to the creation of new products and services, but also to increasing innovations. Using the experience of clusters, whose cooperation with R&D sectors is very dynamic, may be a helpful tool. They could be an example of implementation of particular R&D solutions to the enterprises. Best practices may also be observed in foreign clusters. It is also essential to increase qualifications of cluster members with regard to the legal conditions related to the opportunity to transfer innovations from the sector of science to enterprises and to protect intellectual property. Without these measures and knowledge, improving the current level of innovativeness of clusters will be very difficult indeed. Cooperation of clusters with third sector units, such as technology transfer centres, may constitute an interesting proposition of supporting clusters in establishing partnerships with R&D units. Clusters cooperation with such units (located in bigger academic centres in Poland) could provide clusters access to databases and technological information, technological and patent counselling, intermediation in contacts with technology designers, opportunities to get funding for the development of innovative undertakings, opportunities to seek partnerships and cooperative intermediation, promotion of companies and projects, assistance in certification and legal protection. 82 Recommended actions: establishing contact with clusters (including the foreign ones), where cooperation with R&D sector is well-developed and identifying their best practices in this area, improving qualifications of cluster members with regard to protection of intellectual property clusters cooperation with institutions of the third sector, intermediating in contacts of the world of science with the sphere of enterprises (e.g. technology transfer centres). Information on a cluster in foreign languages Contact with foreign clusters may be limited in the situation, where representatives of Polish clusters do not have command of foreign languages. It is indispensible to prepare cluster members for an international exchange of knowledge, and to provide documents about clusters in foreign languages. Lack of such documents makes it impossible to provide information about the cluster, its products, processes or development opportunities. Even a 81 The triple helix applies to close cooperation between the public sector, academia and the industry 82 What are Technology Transfer Centres? analysis by the Business Support Centre in Gdynia, a local office of the Free Entrepreneurship Association, Territorial Division in Gdansk, the Polish Agency of Enterprise Development, the Regional Development Agency ARLEG" S.A. in Legnica
242 brochure with basic information in English will be a good source of information of the cluster for foreign entities. It is recommended to provide at least short information (a leaflet) on the cluster in a foreign language and its publication of the cluster s web page. Cluster s cooperation with the environment Examples of cooperation of Polish clusters with other clusters home and abroad indicate, that such cooperation results in increasing the transfer of knowledge, recognisability (also international recognisability), exchange of experiences and improvement of cooperation and better access to the R&D units (including foreign ones). It is recommended with respect to cooperation with the environment that clusters use the experience of other entities. Seeking foreign partners or acceding to cluster associations is a cheap and efficient tool, which should be used to increasing knowledge and learning processes of clusters. Recommended actions: Seeking partners among the Polish clusters (not from the same sector or region) and foreign clusters (e.g. through the Polish Innovation Portal - or the European Cluster Observatory - and establishing cooperation, contact with international associations of clusters from a given sector and starting cooperation. Cooperation with public administration The results of cluster benchmarking survey indicate as well, that in many cases cooperation of clusters with public authorities, both government and self-government is evaluated low. It transpires from the information received at the interviews, that only selected clusters undertake such measures to point problems with cluster functioning or its sector out to the authorities. To a large extent this is due to their belief that such activities will not yield any significant results. Respondents highlighted at the interviews negative experiences from cooperation and the impression that a cluster is not an equal partner for a public institution. Hence clusters rarely monitor current activities of authorities and undertake official steps, such as consultations of documents under preparation or decisions undertaken by the government or self-government authorities. The above factors result in cluster's low score for public policy in this respect. Support of public authorities is often limited solely to promotion of the idea of clustering. Clusters are invited to different conferences or meetings, which, in their opinion, do not foster the expected results. Public assistance is rarely related to concrete physical support, i.e. providing office space for a cluster, providing warranties, funds or land for the cluster s needs, etc. Conclusions from the analysis of clusters cooperation with public institutions permit to indicate this area of clusters activity as the one in the need for intensified efforts on the part of both clusters and public administration. Unilateral measures to this aim will not bring satisfying results. Recommendations in this area for clusters apply to the need of formalising activities related to cooperation with public authorities. Examples of clusters which undertook the initiative of certain activities and solutions with respect to public institutions indicate that they were able to build positive relations as a result. Such measures made it possible to get tangible results in the form of e.g. support for the changes of curricula in schools adapting education to the needs of a cluster, or receiving a physical contribution to the activities
243 undertaken by a cluster. Clusters should bear in mind, though, that the process of building relations with public institutions is a long-term one, and rarely brings immediate effects. Establishing an institution (a foundation, or an association) which would represent the interests of clusters in Poland would be an effective solution aiming at strengthening clusters position as a partner in a discussion on the government level. The entity could become a social partner, who would represent the stand and arguments of clusters in front of policymakers and decision makers in economy in Poland and in Europe alike. At the same time, such an entity could give its opinion on the most important issues through the participation in meetings of decision makers and advisory bodies at different levels of public administration, which is not possible at present for particular clusters. Recommended actions: formalising different areas of cooperation with public authorities, exchange of experiences in cooperation with clusters from the similar sector/region, creating a bottom-up initiative of clusters, an institution which would represent interests of clusters in Poland Conclusions and recommendations from surveys addressed to entities shaping cluster policy at national level Cluster support strategy Support for cluster development is an important element of the EU policy aimed at implementation of the basic provision of the Lisbon Strategy which is improvement of the EU economy in terms of competitiveness and innovation. Many crucial documents of the European Commission indicate clusters as a significant factor of growth of economic potential. This includes particularly clusters concentrating small and medium-sized enterprises which have no chance to compete on European or global markets when acting individually. Many countries and regional self-governments formulated and implemented a type of economic policy based on cluster development, seeing in it an important instrument that leads to sustainable increase in the level of competitiveness of the economy in national, regional and local dimensions. The cluster policy in Poland is an element of innovative policy but in spite of it (according to studies) the innovation level of Polish clusters is still very low. Therefore, it is necessary to analyse activities taken so far and identify further directions of development of cluster policy. Comprehensive, adequately formulated and implemented policy of supporting cluster development has not been prepared in Poland yet. Expectations of clusters have been aroused strongly during the programming period of under which financial incentives and support for training and counselling were the main instruments for stimulating creation and development of clusters. According to clusters, in the course of the programming period of continuation of activities initiated during the period of was missing (e.g. for support in preparation of a comprehensive promotional strategy for a cluster) which contributed to disappearance of many cluster initiatives and reduction in activity of many clusters. This affected also negative opinions among clusters on administrative activities conducted in this area.
244 According to respondents, declarations of support for clusters made by administration during their creation, were not followed in many cases by relevant activities in favour of them. There were also opinions that government s actions did not take into account the needs and nature of Polish clusters. These activities included inter alia preparation and allocation of funds under operational programmes. What is more, respondents also indicated in this context that the principle of providing support at national and regional levels change frequently and that they vary depending on the voivodeship. According to clusters, this leads to a conclusion that there is poor coordination of public activities concerning support for them. Furthermore, representatives of clusters feel that they are not important partners for public authorities and their opinions are not taken into account. The main recommendation for the policy-makers at national level is to define the policy model in Poland and prepare a strategy which would take account of the following: development level of Polish clusters, strategic objectives and possible areas of activity, perspectives of developing industries in which clusters operate, levels of cluster innovation and production efficiency. An important decision at the stage of formulating the strategy will be determination whether activities leading to establishing new clusters will be supported, they will focus on development of already existing ones or supporting the most mature structures which are likely to compete on international markets. The strategy should set out priority areas of support and instruments for their financing. It should also be reflected in the range of support programmes for identified clusters. The main aim of cluster policy should be sustainable increase in the level of competitiveness of enterprises, and thus of the entire economy. Activities foreseen in this regard should be long-term but above all consistent. As a result, they would allow clusters to increase capacity to absorb and create innovation. Identification of appropriate tools for implementation of the strategy should on the one hand base on experience gained in other countries in order to avoid erroneous solutions. On the other hand, however, they should take account of specific Polish conditions. Uncritical copying of best practices from other countries could lead to incurring unnecessary costs in the longer time perspective. It is also important to ensure that the prepared strategy relates to both levels - national and regional. Its task should be to define appropriate regulatory framework and instruments of support at both levels. Many actions recommended at central level are also translated into the regional level. Establishing an appropriate system of regional support, linked to the horizontal national system and tailored to clusters in a particular region (largely dependent on their stage of development, size, industry or objectives of innovation activities) requires adequate research at regional level. It would ensure better understanding of a specific situation in the voivodeship and formulate more abundant recommendations in relation to self-governments. It is recommended that cluster policy-makers take into account the opportunity to identify clusters strategic for development of the country's economy. Highlighting key clusters and industries should be preceded by analysis of circumstances and barriers to their development as well as competitive and innovative potential. This would enable identification of areas where companies can be competitive on international markets and ultimately preparation of adequate public support. This would help coordinate public policy carried out in selected
245 areas of the economy, as well as efficiency of granted support by means of prioritisation of its directions. An additional recommendation is active inclusion of clusters and cluster initiatives in development of cluster policy in Poland and thus building social capital in this field. The described approach should not be confined only to the opportunity of hearing proposals and demands, but must take into account two-way communication. Representatives of clusters should receive clear messages from authorities inviting them to the discussion whether and how their suggestions have been considered. The consistency in meeting the adopted assumptions is also significant. Provision of the two-way communication and partner treatment will affect their involvement in activities of public institutions (e.g. participation in research). Recommended actions: identifying the model of cluster policy in Poland and preparing a strategy of clusters support (including the contribution in the strategy development of clusters, local government units, local economic experts and experiences of other countries), distinguishing the key clusters and sectors in the forthcoming strategy, identifying strategic actions at national and regional level with a precise assignment of responsibility for the tasks, identifying an action plan to implement the strategy, improving communication with clusters. Clusters indicated that one of the most important issues for them was support for their activity (especially Support of financial activities). Experience of other countries shows that too high level of financial support for clusters may cause that entities will artificially join a cluster only for financial reasons with no true commitment and identification with the cluster. On the other hand, too low level of support in the first phase of developing new initiatives or no consistency in provision of support may discourage entities to carry out the undertaken activities. The possibility of receiving financial support from European funds could be a very important factor in increasing the development pace of these initiatives. The basis for preparing appropriate instruments of support should be a detailed need analysis arising from the strategy. Therefore the primary recommendation is to identify specific needs of clusters in order to develop particular programmes of support in the long term. The survey results for cluster benchmarking show very different levels of development and maturity of clusters in Poland which determines the diversity of future financial instruments.
246 Taking into account respondents opinions, it is proposed to prepare various forms and instruments of support depending on the maturity of a cluster - different for clusters at the beginning of their activities and in the initial phase of development 83, and different for clusters in the phase of growth, maturity or transformation 84. For clusters that are in the initial phase of development it is recommended to take measures aimed at giving them access to the most basic instruments of support such as: financing cluster s current activity, i.e. administrative and office costs, providing basic counselling services concerning legal solutions connected with creation of organisational structure, providing counselling services (or allocating funds for their purchase) for preparation of an analysis of region s potential and trends for a particular industry, drawing up strategic documents, determination of development directions for a cluster, specific areas of cooperation with scientific and research units and preparation of operational plans for activity, financing costs of employing a professional animator/coordinator of the cluster, financing costs of identifying needs among cluster members concerning training, counselling, development problems, etc. organisation of trainings, meetings, study visits, etc., financing joint cluster promotion, Internet website, etc. Funds for supporting development of cluster s potential and for operational activity in the initial phase should be an element of long-term plan and be reduced year by year. The aim of implementing the mechanism of annual reduction in the amount of obtained support will be to stimulate cluster members to increase own financial contribution. Such motivation should be a result of first effects of cluster s operation obtained with the use of public funds. Subsequent annual tranches should be paid on the basis of the achieved results. For mature clusters which developed specific projects during their development phase, it is recommended to create instruments of support that enable implementation of these projects. Examples of such tools are as follows: co-financing costs of project implementation, co-financing costs of organising technology transfer and legal counselling in relation to this matter, co-financing implementation of organisational, marketing and process innovations in clusters, out of 47 analysed clusters are in the incubation/embryonic phase out of 47 analysed clusters are in the growth/maturity phase.
247 co-financing costs connected with internationalisation of cluster operation, i.e. costs of participation in fairs, international exhibitions, commercial missions, preparation of materials in a foreign language, cluster s formal cooperation with foreign entities, co-financing common research and development projects, co-financing costs of research of market, industry, global trends concerning cluster s operation, co-financing specialised trainings, also foreign ones, for representatives of clusters, co-financing costs connected with obtaining patents and licenses, co-financing administrative management of implemented projects. Most activities mentioned above can be financed under programmes from EU funds at national as well as at regional level. At present access to such resources is much more difficult due to project selection criteria, which often do not include clusters nature. Therefore, an important recommendation is to develop support programmes in a way to ensure that the criteria of project selection include the nature of activities implemented by clusters. Project selection criteria applied by public authorities should also promote cooperation among Polish companies and award bonuses for projects under the triple helix, i.e. spheres of business, science and research plus education and government. Clusters should cooperate by definition with these entities. In practice, however, there is no real cooperation at operational level. The survey results show a large deficit for such activities so it is necessary to establish support mechanisms which will activate entities to undertake this type of cooperation. As already mentioned, direct financing of key cluster projects important for the entire economy is also worth considering. Regardless of activities directly intended for clusters, entities that create governmental policy should support efforts to disseminate knowledge about clusters, addressed not only to clusters. Representatives of clusters often expressed during interviews their dissatisfaction with the fact that public authorities prepared for them trainings on what a cluster is and what benefits of establishing it are. Clusters which formalised their structure, stressed the need of more advanced training and tools that would enable them further development, for example legal advice, access to industry analyses during preparation of strategic documents, etc. Costs of these services make access to them more difficult for clusters. It is also worth noticing that nowadays there is a lot of tools targeted at small and medium-sized enterprises. Clusters awareness of them is, however, low. For this reason it is important to provide more effective promotion of these tools among clusters. Dissemination of basic knowledge about clusters should include education of companies which can potentially form such structures. Knowledge about clusters should also be disseminated on the occasion of other activities carried out for entrepreneurs. Such measures could include publication of short leaflets informing on what a cluster is and what the benefits of participating in it are. Another idea is to organise short speeches during various conferences organised for entrepreneurs. These activities are necessary because of the low awareness of benefits from mutual cooperation Recommended actions:
248 preparing an analysis of needs of support among the clusters, which are part of a strategic cluster policy in Poland, preparing the basic instruments of support for clusters in the early stages of development, including the preparation of long-term plans to support individual clusters, taking into account the reduction of public financial support each year, development of advanced instruments of support for clusters in the phase of growth, maturity, or transformation, related to the implementation of concrete projects, incorporating clusters specifics within the criteria for project selection, taking into account the collaboration with R&D units among the criteria for project selection, dissemination of knowledge among the clusters on the possible tools and instruments in support of their members (e.g. projects offered to companies in the SME sector), dissemination of knowledge about clustering in Poland during the events related to enhancing the entrepreneurship, Tools Apart from the above-mentioned types of support it is also recommended to develop specific tools and make them available in the Internet. They could take the form of knowledge bases about clusters containing not only basic information such as how to initiate a cluster, but also: sample documents, i.e. statutes of incorporation, letters of intent with specific legal solutions, sample documents including examples of organisational structures applied in clusters along with a functional division of tasks, development strategies for various industries, sample documents drawn up in order to manage relations in a cluster, e.g. ethical codes, example schemes of audits of needs for cluster members (in terms of training, counselling, development problems, etc.), examples of best practices of cooperation under the triple helix in Polish and foreign clusters which present the possibilities, forms and results of cooperation,
249 examples of best practices in technology transfer and legal solutions concerning this area, tools to search for foreign partners and cluster associations in the world. It happens very often that clusters cannot finance costs of drawing up a development strategy, preparing and implementing organisational solutions, etc. In this case the central administration could support the following actions: trainings, workshops and counselling for members of cluster structures which would deal with many aspects of cooperation between economic entities and research and development sector, legal counselling relating to main areas of clusters operation provided by representatives of public institutions handling cluster policy, 'ad hoc trainings for animators/coordinators of clusters, support in establishing partner contacts between Polish and international clusters, trainings on use of intellectual property rights and acquiring licences, trainings on modern forms of financing activities, i.e. seed capital, venture capital, etc. Some of these activities could be assigned to territorial self-governments (mainly Offices of Marshals) - according to the national strategy of supporting clusters and regional development strategy. Apart from the aforementioned activities, the government should necessarily implement other measures without which the indicated instrument will not bring expected results. They include development of basic and specialised infrastructure (e.g. laboratory facilities), support for research and development works at universities related to operation of clusters, creating support in the form of technology and industrial parks. What is more, because of the fact that innovation has become a horizontal issue in economic and science policy in recent years, it is necessary to consider how clusters in Poland can contribute to greater innovation of domestic companies. Tools for stimulating innovation should also be prepared. Actions of the authorities should aim at eliminating competition barriers in the local environment and highlight export capabilities of individual clusters. Recommended actions: preparation of specific support tools for clusters that are easily accessible, e.g. on the Innovation Portal (including inter alia samples of strategic documents, examples of best practices relating to, for example, cooperation with R&D units, tools to search for cluster's partners in the country and abroad), creating a database of tools that are already developed and support clusters operation, cluster support through assistance of qualified public employees, offering consulting and training services, providing incentives and tools to stimulate innovation in clusters.
250 Evaluation of activities Conducted interviews were an occasion to collect the opinions of respondents concerning the cluster support policy in Poland. Such a policy, a policy that would be coherent and systematic, doesn't exist. Activities aimed at supporting specific clusters that were carried out, were mainly related to the implementation of programmes co-funded by the EU. At the end of such activities their results were evaluated which allowed for the identification of problems that had occurred. This kind of assessment of implemented activities leads to well-prepared and systematic initiatives carried out by entities shaping the government cluster policy in Poland. Respondents emphasised that in their opinion there should've been an evaluation of activities coherence with relation to clusters both the horizontal evaluation (coherence of individual programmes supporting clusters) and the evaluation of timing (coherence of cluster support programmes in the previous and current programming period). The recommended action is to create a system of evaluation of taken actions that would include not only the individual programmes supporting clusters, but also the entire policy. It is important to ensure the coherence of actions addressed to clusters through their evaluation (before they are taken, as well as during and after the end of their implementation) and also to establish an evaluation system of cluster development strategies in Poland. Education Another important area which requires public intervention is the urgency of adjusting the system of education and its methods to cluster needs. According to the respondents, skilled workers are crucial to a full and intensive development of a cluster. Clusters have a negative opinion about the system of technical education in Poland. In respondents' opinion, vocational education is the weakest element of Polish system and it should be changed. During the interviews, study participants implied that vocational schools didn t provide students with any practical background due to a very limited number of practical classes. It is important to underline that many such measures aimed at adjusting the directions or ways of educating to the needs of clusters, and hence of the entire industry in which such clusters operate, are already being carried out. Clusters made suggestions concerning the creation of new university faculties, held talks with the Ministry of National Education about vocational formation and suggested establishing postgraduate studies and specialised classes in upper secondary schools. Unfortunately, in some cases the suggestions of cluster representatives are met with reluctance and lack of understanding. Clusters also point to the fact that very rarely the initiative of introducing changes to the system of education comes from public administration. Adjusting education to cluster needs is crucial to their development, therefore it is recommended that entities shaping government policy take certain measures in this respect. They should concentrate on ensuring better adjustment of education offer to the needs of economy, both at the level of higher education and the professional level. Clusters suggestions should be submitted to the Ministry of National Education and the Ministry of Science and Higher Education and used as a basis for introducing necessary changes. Recommended actions:
251 change in the system of vocational education, which requires a greater orientation towards fostering practical skills, promotion of technical education (at all levels of education), taking into account the needs and views of clusters when designing changes. Research and Development Results obtained by clusters show that clusters cooperation with R&D institutions is limited. As has been already mentioned in cluster recommendations, it partly stems from their small activity when it comes to carrying out joint actions with scientific units. On the other hand, clusters face a lot of barriers in initiating this kind of cooperation. Usually, university employees are open to sharing knowledge and experiences, as well as to carrying out shared projects. However, the system of remunerating such workers does not facilitate their cooperation with clusters. Academic career is mainly dependent on the number of publications and delivered presentations and not necessarily on the introduced innovations or specific technical solutions. Research on products or services that could be easily implemented is rare. Moreover, a lot of red tape in cooperation with universities discourages clusters from initiating shared actions. The decision process is especially time-consuming in the R&D institutions. Recommended actions: creating a model of cooperation between the clusters and R&D units, defining areas of cooperation and the legal framework, encouraging clusters and showing them the legal aspects and possible areas of cooperation with R&D units, increasing the activity of R&D units in searching areas of cooperation with clusters, facilitating cooperation between clusters and R&D units by cutting the red tape and shortening the decision process, changing academic career criteria by underlining the importance of knowledge transfer and commercialisation, as well as implementing new solutions and obtaining patents Conclusions and recommendations from the study addressed to entities shaping cluster policy at regional level Strategy cohesion The results of the study show that, on the one hand, clusters have a good opinion on the cooperation with the authorities, especially the local ones, and the support they provide but, on the other hand, some clusters pointed to the fact that it was exactly the self-government administration that hindered the development of the cluster. There are stark differences in
252 self-government policy rating in individual voivodeships from a very high in Śląskie Voivodeship to a very low one in Mazowieckie Voivodeship. Such contrasting opinions on public policy point to a lack of systemic rules applied in individual regions, as well as lack of possibility to build on experiences of these self-governments that are considered the best. At the regional level, it is recommended that a regional strategy (regional programme) coherent with the national strategy is prepared and implemented. Each region should define a model of cluster support whether it will include initiating the creation of new clusters, or the development of already existing ones, or maybe it will concentrate on supporting 'mature' structures which have the potential of becoming hallmarks of the region. The recommended action involves creating coherent rules for supporting clusters in each region, linked to national policies to promote clusters described in a relevant strategy. Regional support instruments The level of public authorities involvement in cluster initiatives at the regional level varies from region to region. A lot of regions, both the Polish and the European ones, perceive clusters as structures which can have a positive developmental effect on the enterprises, as well as the entire region. Clusters may not only attract new investors but also increase demand for regional or local products of the enterprises. Recommended actions: analysis of the potential of individual clusters in the region and determining the directions of supporting them, organising meetings and training sessions that build awareness of the benefits of cluster structures, identifying the key clusters in terms of regional development and prioritization of selected structures, creating such selection criteria for projects co-funded by the EU that would promote clusters projects, representing the interests of local clusters at higher levels, development of research and industry analyses in the region and studies on future trends (development of the region / sector), e.g. with reference to the needs voiced by clusters, supporting R&D units in cooperation with clusters, supporting the implementation of changes in education at regional level proposed by clusters.
253 Exchange of experiences Another recommendation related to regional cluster policy-making, concerns building on experiences of those voivodeships whose actions bring measurable results. Moreover, selfgovernments should make use of experiences of European partner regions which have had a lot of experience in this respect, because they have been supporting such structures for many years and they had the chance to test the efficiency of their actions in practice. Recommended actions involve searching by local authorities of possibilities to benefit from the experience of cooperation with clusters among other units of local government in Poland and abroad. What is especially important in this respect is building partnership networks, e.g. by taking active part in training, workshops and conferences organised in order to support clusters. Regional investment attractiveness Another important factor contributing to the development of clusters is the improvement of regional investment attractiveness, especially in the case of clusters of more innovative industries. It is dependent on the accessibility of appropriately developed infrastructure, commercial premises, communications network and the proximity of R&D centres. The role of special economic zones should also be underlined, as they allow clusters to benefit from certain privileges (physical proximity of cluster members). What is important for enterprises belonging to clusters, and hence clusters themselves, is the existence of spatial development plans and the necessary infrastructure. If they don't exist, constructing new laboratories or production plants is rendered more difficult. Recommended actions for enhancing investment attractiveness: creation and strengthening of delimited areas in which cooperation is supported (e.g. special economic zones) and of cooperation with R&D units (e.g. technology parks). improvement of infrastructure (roads, utilities, etc.) and preparation of spatial development plans. Regional Innovation Strategies The majority of clusters taking part in the study have been included in the regional innovation policy Regional Innovation Strategies comprise provisions on cluster support. According to clusters, however, the adopted strategies do not bring measurable results in a given voivodeship. Regional Innovation Strategies (RIS) are not very consistent with cluster strategies. In few regions including cluster development in such a strategy constituted a requirement for obtaining project co-financing in the form of public funds. It is recommended in this respect that provisions of individual strategies are reviewed and a document that would include development directions of clusters in a given region is prepared. It is also
254 important to establish selection criteria for cluster projects co-funded by the EU, projects which are significant for regional development and included in regional strategic documents. Recommended actions: analysing and taking into account the needs of clusters during the RIS update process, implementing RIS, including the provisions regarding clusters. Promotion and support at the regional level The most frequent area of cooperation between the self-government and the clusters is promotion. City or poviat offices post information on clusters on their websites, invite cluster members to conferences, meetings, they organise visits of foreign delegations at cluster representatives. Opinions on the promotion of clusters by public authorities are both very positive and very negative. Although cluster promotion activities of public authorities are noticeable, according to the majority of clusters it doesn t translate into financial support. Training and education activities were also assessed quite negatively. Cluster representatives could participate in training sessions and seminars organised by public administration but they concerned mainly clustering, innovative projects and regional promotion, while clusters need, above all, specialised courses. Business environment institutions and the advisory services they provide don't meet cluster needs either. Recommended actions: dissemination of information and promotion, supporting initiatives undertaken by the clusters, organizational support (e.g. offering a venue for meetings), cluster promotion on foreign markets on the occasion of creating a regional brand, establishing a regional office for cooperation with clusters at Marshal s Offices whose task would be to ensure effective coordination of regional cluster policy and implementing cluster strategy/programme; it would be a point of contact for all clusters in the region Methodological conclusions and recommendations and cluster analysis tools The following conclusions and recommendations stem from the first benchmarking of clusters in Poland. The study allowed the Contractor to collect information and comments relating to both the implementation aspect and the methodological side. Presented information and comments came directly from the respondents (from the first working meeting, interviews and telephone conversations) and also followed from what the Contractor had learnt during this
255 project. The following conclusions and recommendations are aimed at improving the effectiveness of future benchmarking studies, while maintaining the study s objectives. Number of benchmarking indicators The questionnaire submitted by the Ordering Party, applied in interviews with cluster representatives, included mostly questions aimed at getting information on the value of required indicators in a given cluster. Each respondent devoted an average of 2-3 hours for the interview. This amount of time made it possible to collect quantitative data concerning the majority of benchmarking indicators. It turned out, however, that collecting qualitative data, such as information on cluster processes of shared orders, or problems connected with cluster financing, is much more difficult. In many cases, it was due to the fact that respondents didn't have the relevant data. Limited time was also a significant barrier, as the respondents were unable to present additional information other than the benchmarking indicators. Reduction in the number of considered indicators is recommended. Structure of the questionnaire and indicators The benchmarking methodology assumed collecting information about 85 indicators from all clusters participating in the study. During interviews, respondents were asked about such data that are often unknown even to the cluster coordinator. In many cases, collected data are coordinator s estimates. It has a negative impact on the reliability of collected information which, in turn, may influence the study's results. In the course of interviews respondents weren't sure if they understood the indicators correctly, as well as if certain indicators were useful and whether such information is necessary in order to achieve the study s objectives. Many participants had serious doubts concerning the large number of indicators and the length of the interview. The current wording of questions on cluster strategic objectives, in which respondents were asked whether a given objective was important for the long-term development of the cluster, resulted in the fact that respondents often gave very high scores to many objectives. It means that almost all possible strategic objectives of the cluster (enumerated in the questionnaire) are very important. However, in practice clusters don't fulfil such objectives as strategic objectives. A review of the following elements is recommended: the number of indicators, indicators, as regards the correctness of interpretation, indicators, as regards the reliability and objectivity of submitted data, the way of asking questions about the strategic objectives (it could be considered whether not to encourage respondents to select a few key strategic objectives of the proposed list). Comparative analysis of clusters from different industries In the light of experience gained by the Contractor during the benchmarking of clusters in Poland, it seems valid to consider how to carry out an effective comparative analysis of very
256 different cluster structures (industry, objectives, innovation level). That is why, it is recommended to divide clusters, where possible, into functional groups (according to industry and the cluster objective) and try to look for benchmarking values in these groups. It would also be interesting to compare Polish clusters with the foreign ones (e.g. clusters operating in similar industries). Future cluster studies At the stage of preparing the next study, it is important to encourage clusters to take an active part in it. Our task, the most important factor, will be to demonstrate that the results of the present study are taken into account in the process of shaping the cluster support policy in Poland. At the same time, thanks to received information and active participation in the studies, clusters will have the possibility to see that they have a real influence on the way this policy is created. It is in the interest of clusters, cluster policy and the entire Polish economic policy to encourage clusters to participate in future studies. All comments submitted by the respondents during the interviews, as well as comments from the Contractor, will be forwarded to the Polish Agency for Enterprise Development in a report on the project implementation in order to facilitate the organisation of the next edition of cluster benchmarking in Poland.
257 12. English Summary
258 13. List of Tables Table 1. Summary of the recommendations resulting from the Organisation and performance of cluster benchmarking in Poland analysis Table 2. Key cluster benchmarking areas Table 3 Types of cluster initiatives by voivodeship Table 4. Clusters surveyed by industry Table 5. Clusters used for analysis along with the number of clusters in particular groups... 45
259 14. List of Charts Chart 1: Age of cluster Chart 2 Cluster initiator Chart 3 Type of initiative Chart 4. Organisational and legal form of cluster Chart 5. Type of cluster participants Chart 6. Structure of employment in a cluster according to employment size Chart 7. Phase of cluster development Chart 8. Cluster strategy Chart 9. Objectives of cluster operations Chart 10. Cluster success factors Chart 11. Participation of women and men in the survey Chart 12. Average values and benchmark values for the area Cluster resources Chart 13. The average value and the highest indicator value within the framework of the subarea Human resources and know how of the cluster Chart 14. Total employment Chart 15. The number of people servicing the cluster (administrative service) Chart 16. Employment in the research and development activity in the clusters Chart 17. Percentage of employed with higher education Chart 18. The number of jointly implemented projects in the clusters in the last 2 years Chart 19. The average value and the highest value of the indicator for the sub-area Financial resources of the cluster Chart 20. The number of projects implemented by clusters from the external resources Chart 21. Financial resources for the implementation of shared projects in the last 2 years (PLN) Chart 22. Division of resources acquired by the clusters from external resources from the moment of their creation by the amount of granted co-financing Chart 23. External financial resources acquired for cluster projects in the last 2 years (PLN) Chart 24. Share of membership fees in the financial resources for the implementation of shared projects... 64
260 Chart 25. The average value and the highest indicator value for the sub-area Infrastructure resources Chart 26. The area of offices and conference rooms Chart 27. Area of laboratories available for the cluster members Chart 28. Percentage of cluster members using the common internal network (Intranet) Chart 29. Average value and benchmark values for Process in cluster area Chart 30. Average value and the highest value of indicator within Joint market activity of clusters Chart 31. Score for joint supply joint orders Chart 32 Score for joint distribution channels Chart 33. Score for joint offer prepared by the cluster for external recipient Chart 34. Score for market information exchange amongst cluster members Chart 35. Average value and the maximum value of indicator in 'Marketing and PR of the cluster sub-area Chart 36. Assessment of joint cluster advertisement activities Chart 37. Score for joint trade fairs activity of the cluster Chart 38. Score for joint lobbying authorities Chart 39. Score for a common website of the cluster Chart 40. Score for visual identification system of the cluster Chart 41. Score for the cluster s contacts with and attendance in mass media Chart 42. Average value and maximum value for Communication in a cluster sub-area Chart 43. Score for regular meetings of entities in the cluster Chart 44. Score for joint integration events Chart 45. Score for joint communication platform Chart 46. Score for internal press Chart 47. The average and the highest value of the indicator under the sub-area Creation of knowledge and innovations Chart 48. Score for joint works on new products and technologies Chart 49. Score for jointly introduced innovations (organizational, marketing, in services) Chart 50. Score for joint trainings, workshops, conferences, study visits (employees education)
261 Chart 51. Scores for joint data bases Chart 52. Exchange of knowledge and experiences (informal) between cluster members Chart 53. Cluster scores for technologies transfer Chart 54. Average values and benchmark values for the area cluster performance Chart 55. The average value and the highest value of the indicator in the sub-area Development of human resources Chart 56. Increase of employment in entities operating in the cluster core in the last 2 years Chart 57. Clusters according to the number of participants of trainings organized for cluster needs within the last 2 years Chart 58. The number of joint trainings organized in a cluster for the last 2 years Chart 59. The share of persons improving their professional qualifications in the total number of the employed during the last 2 years in entities constituting the cluster core Chart 60. The average value and the highest value of the indicator under the sub-area Improvement of competitive position Chart 61. Number of clusters according to the share of products/services sale in the foreign market Chart 62. The number of clusters according to the number of new participants of a cluster during the last 2 years (institutions and enterprises attracted to a cluster) Chart 63. Number of clusters according to start-ups number in a cluster Chart 64. The average value and the highest value of the indicator under the sub-area Improvement of innovativeness Chart 65. Number of innovations under legal protection introduced in a cluster during the last 2 years Chart 66. Share of expenses on R&D in the expenses on innovative activity in entities constituting the cluster core (during the last 2 years) Chart 67. The number of joint projects implemented (submitted) co-financed from EU resources Chart 68. The number of joint international research projects, financed from other external sources Chart 69. Average value and the highest value of indicator under the sub-area Cluster s internationalization Chart 70. Number of foreign markets (continents) where the enterprises from a cluster are present Chart 71. The share of export in the structure of the sale of cluster s products
262 Chart 72. The number of formal agreements on cooperation of a cluster with foreign entities Chart 73. Amount of participation in fairs, international exhibitions, cluster trade missions in the last 2 years Chart 74. Number of publications in a foreign language (business materials, the press) in the last 2 years Chart 75. Average values and benchmark values for area of the growth potential Chart 76. Average value and highest value of the indicator within sub-area Regional predispositions Chart 77. The potential and economic traditions of the local environment Chart 78. Availability and mobility of highly qualified employees Chart 79. Investment attractiveness of the region Chart 80. Openness of the entrepreneurs environment for cooperation Chart 81. Availability of the natural resources (including raw materials) Chart 82. Average value and highest value of the indicator within sub-area Public authorities policy in favour of the development of the cluster Chart 83. Promotion of the cluster by public authorities Chart. 84. Financial support of the development of the cluster by public authorities Chart 85. Training, educational and organizational aid for the cluster Chart 86. Influence of the regional innovation policy (through RSI) on the development of the cluster Chart 87. Cluster's cooperation with public authorities Chart 88. Adjustment of the changes in the educational system to the needs of the cluster 171 Chart 89. Average value and the highest value of the indicator within sub-area Institutional surrounding Chart 90. Availability and quality of research for the needs of the cluster Chart 91. Quality and availability of advice, training and information services Chart 92. Readiness and openness for cooperation of business related organizations and research and development organizations Chart 93. Organization of the transfer of technologies (in the country and from abroad) Chart 94. Availability of funds supporting the cluster s development Chart 95. Availability of the market infrastructure of the business surrounding (inter alia banks, leasing, etc.)
263 Chart 96. The average and the highest value of the indicator within the subarea Cluster leadership Chart 97. Strength and position of coordinator in a cluster Chart 96. The average and the highest value for the subarea "Cluster leadership" Chart 98. Strength and position of other cluster members in initiating shared cluster activity 189 Chart 99. Strength and position of cluster relative to the environment (ability to gain funding, lobby) Chart 100. The coordinator s skills in terms of initiating cooperation (external and internal) Chart 101. Average and benchmark values for the subarea: Cluster strategy Chart 102. The mean and the highestscores for the indicator in the sub-area The benefits of scale Chart 103. The opportunity to acquire funding for a cluster Chart 104. Increasing bargaining power against suppliers Chart 105. Coordinating the buying market Chart Chart 107. Increasing a cluster s competitive advantage Chart 108. Average and highest indicator value for subarea Creating a knowledge and innovation network Chart 109. Increased possibilities of market research Chart 110. Developing competencies through life-long learning Chart 111. Transfer of knowledge and diffusion of innovation through informal contacts Chart 112. Diffusion of technology within a cluster Chart 113. Common creation of innovative solutions Chart 114. Establishing common technical standards Chart 115. The average and the highest value of the indicator under the sub-area Impact on business environment Chart 116. Improved international competitiveness of the cluster Chart 117. Attracting new contractors Chart 118. Attracting new talents to the region Chart 119. Increased market importance of the cluster and the region Chart 120. Enhanced position of the cluster as a business partner
264 Chart 121. The average and the highest value of the indicator under the sub-area Impact on the natural environment Chart 122. Promoting ecological behaviour Chart 123. Development of technologies using renewable energy sources Chart 124. Increased cooperation (external and internal) in relation to environmental protection Chart 125. Benchmark value and the average for the analysed areas
265 15. List of Maps Map 1. Clusters participating in the research by voivodeships Map 2. Average scores from sub-area Regional predispositions by voivodeship Map 3. Average scores from sub-area Public authorities policy in favour of the development of the cluster by voivodeship Map 4. Average scores from sub-area Institutional surrounding of the cluster by voivodeship
266 16. List of Best Practices Best practices which were possible to apply in individual clusters were included in the dedicated reports together with the description of implementation and expected benefits. 25 Best practice 1. Promotion of the cluster s operation sector on the labour market Best practice 2. Lowering the costs of a cluster s operation Best practice 3. Achieving new financial resources for the current activity of the cluster Best practice 4. Creating infrastructure, strengthening the cluster innovativeness Best practice 5. Creation of products under the cluster's name Best practice 6. Development of a joint comprehensive market offer Best practice 7. Mutual transferring of orders Best practice 8. Comprehensive planning and carrying out promotional campaign Best practice 9. Cluster promotion via bulletin Best practice 10. Use of Internet marketing Best practice 11. Development of marketing actions through sponsoring and patronage during international events Best practice 12. Incentive for the cluster members to create together a website and exchange information Best practice 13. Exchange of information on human resources in the cluster Best practice 15. Regular meetings of the representatives of the education and enterprises sector form a cluster Best practice 16. Exchange of knowledge and international experiences Best practice 17. Investing in practical knowledge of potential personnel Best practice 18. Cluster activities based on needs identification Best practice 19. National and foreign cooperation with other clusters Best practice 20. Utilizing the regional potential to create market offer for the cluster Best practice 21. Utilizing the advantages of the natural environment for the benefit of the cluster s activities Best practice 22. building equal relations and trust in the cluster Map 2. Average scores from sub-area Regional predispositions by voivodeship Best practice 23. Self-government s support for sectors important for region s development 168 Best practice 24. The cooperation with public authorities to change curricula
267 Best practice 25. Transnational cluster s cooperation Best practice 26. Internationalisation aiming at supporting transfer of technology in the cluster Best practice 27. Cluster s cooperation with local and national institutions Best practice 29. Improving cluster management mechanisms Best practice 30. Strengthening the role of leaders in a cluster Best practice 31. Strategic thinking
268 Annex 1. Statistical data
269 Values, average value and the value of benchmark for clusters without external financing Area Sub-area Average Benchmark value value Cluster resources Human resources and know-how 2,17 1,33 1,67 2,83 3,83 1,33 2,17 2,04 3,83 Cluster resources Financial resources 3,67 0,00 3,00 0,33 0,00 0,00 0,33 0,75 3,67 Cluster resources Infrastructural resources 1,33 2,00 0,33 0,33 0,33 0,33 0,33 0,97 4,67 Cluster resources SCORE 2,33 1,17 1,67 1,58 2,00 0,75 1,25 1,45 2,33 Cluster processes Market activity 3,00 1,75 3,75 2,00 6,75 3,50 2,75 2,88 6,75 Cluster processes Marketing and PR 5,83 3,33 6,33 7,67 6,33 5,00 3,50 4,77 7,67 Cluster processes Internal communication 4,75 4,00 4,00 4,50 3,75 4,00 2,50 3,31 6,25 Cluster processes Knowledge and innovation shaping 4,83 3,17 5,33 4,33 3,33 4,83 4,00 4,05 6,33 Cluster processes SCORE 4,75 3,10 5,05 4,90 5,00 4,45 3,30 3,88 5,05 Cluster performance HR development 4,25 2,75 2,75 3,50 2,75 1,50 4,00 3,14 5,75 Cluster performance Improved competitive standing of the cluster (market position) 3,33 1,33 0,67 2,00 1,00 2,67 1,67 1,60 3,33 Cluster performance Improved cluster innovation 0,00 0,25 1,25 0,00 0,00 0,00 0,00 0,58 2,75 Cluster performance Internationalising 0,20 1,60 1,00 1,20 1,20 0,80 0,80 1,69 5,60 Cluster performance SCORE 1,75 1,50 1,44 1,63 1,25 1,13 1,56 1,76 3,19 Growth potential Regional conditions 5,20 5,00 4,00 8,00 5,20 3,80 2,60 5,06 8,00 Growth potential Public policy supporting cluster development 2,50 3,33 2,83 4,50 2,50 3,00 0,50 3,03 7,33 Growth potential Associated institutions 2,00 5,33 3,67 6,17 4,33 4,17 3,67 4,23 6,67 Growth potential Cluster leadership 4,75 5,75 7,75 5,75 7,00 6,25 5,50 6,10 8,00 Growth potential SCORE 3,43 4,76 4,29 6,05 4,52 4,14 2,86 4,44 6,62 Cluster strategy Economies of scale 8,20 6,00 6,60 8,60 7,40 5,80 7,60 6,87 9,40 Cluster strategy Creating knowledge and innovation network 6,67 5,67 8,67 6,83 6,67 5,17 7,67 6,83 8,67 Cluster strategy Impact on business environment 8,28 6,80 9,60 7,80 8,00 5,60 7,40 7,60 9,60 Cluster strategy SCORE 7,75 6,13 8,31 7,69 7,31 5,50 7,56 7,09 8,31
270 Values, average value and the value of benchmark for clusters without external financing Area Sub-area Average Benchmark value value Cluster resources Human resources and know-how 1,33 1,33 1,17 2,83 2,33 1,67 1,17 2,04 3,83 Cluster resources Financial resources 0,00 0,00 3,67 0,33 0,33 0,00 0,00 0,75 3,67 Cluster resources Infrastructural resources 4,67 0,33 0,67 0,67 0,67 0,67 0,33 0,97 4,67 Cluster resources SCORE 1,83 0,75 1,67 1,67 1,42 1,00 0,67 1,45 2,33 Cluster processes Market activity 3,75 5,50 2,50 2,75 2,25 1,25 2,00 2,88 6,75 Cluster processes Marketing and PR 1,83 5,17 5,33 5,83 3,33 1,83 3,17 4,77 7,67 Cluster processes Internal communication 2,75 3,75 4,00 2,25 3,75 2,25 1,75 3,31 6,25 Cluster processes Knowledge and innovation shaping 4,50 3,67 3,67 6,33 3,17 3,33 2,83 4,05 6,33 Cluster processes SCORE 3,20 4,50 4,00 4,65 3,15 2,25 2,55 3,88 5,05 Cluster performance HR development 2,75 2,75 3,00 5,75 3,00 1,00 4,25 3,14 5,75 Cluster performance Improved competitive standing of the cluster (market position) 1,67 1,33 1,33 0,33 1,67 1,00 1,00 1,60 3,33 Cluster performance Improved cluster innovation 0,25 0,00 1,25 2,75 2,25 0,50 0,75 0,58 2,75 Cluster performance Internationalising 3,00 1,00 2,80 0,60 0,60 1,40 5,60 1,69 5,60 Cluster performance SCORE 2,00 1,25 2,19 2,38 1,81 1,00 3,19 1,76 3,19 Growth potential Regional conditions 5,60 5,20 5,40 2,40 5,60 4,00 4,60 5,06 8,00 Growth potential Public policy supporting cluster development 5,67 1,17 2,17 3,50 4,33 0,50 0,17 3,03 7,33 Growth potential Associated institutions 4,67 1,67 4,67 4,83 4,83 3,33 5,50 4,23 6,67 Growth potential Cluster leadership 6,25 3,50 7,75 5,75 6,75 6,00 6,00 6,10 8,00 Growth potential SCORE 5,48 2,71 4,71 4,05 5,24 3,19 3,86 4,44 6,62 Cluster strategy Economies of scale 6,20 9,40 9,40 5,60 7,00 7,80 7,80 6,87 9,40 Cluster strategy Creating knowledge and innovation network 7,67 7,17 6,50 7,00 6,50 8,17 6,83 6,83 8,67 Cluster strategy Impact on business environment 7,60 8,20 7,60 5,60 8,40 7,40 8,80 7,60 9,60 Cluster strategy SCORE 7,19 8,19 7,75 6,13 7,25 7,81 7,75 7,09 8,31
271 Values, average value and the value of benchmark for clusters without external financing Area Sub-area Average Benchmark value value Cluster resources Human resources and know-how 1,67 2,00 2,83 1,33 3,33 2,50 2,04 3,83 Cluster resources Financial resources 3,33 0,00 0,00 0,00 0,00 0,00 0,75 3,67 Cluster resources Infrastructural resources 2,33 0,67 1,00 0,67 1,00 0,67 0,97 4,67 Cluster resources SCORE 2,25 1,17 1,67 0,83 1,92 1,42 1,45 2,33 Cluster processes Market activity 3,25 2,00 1,75 2,25 3,00 1,75 2,88 6,75 Cluster processes Marketing and PR 6,00 4,33 4,83 5,83 4,00 5,83 4,77 7,67 Cluster processes Internal communication 6,25 0,25 3,00 3,25 2,50 3,00 3,31 6,25 Cluster processes Knowledge and innovation shaping 4,17 2,67 5,67 3,67 3,33 4,17 4,05 6,33 Cluster processes SCORE 4,95 2,55 4,10 3,95 3,30 3,95 3,88 5,05 Cluster performance HR development 2,25 2,75 2,50 0,75 5,50 5,00 3,14 5,75 Cluster performance Improved competitive standing of the cluster (market position) 1,00 3,00 2,00 1,00 1,33 2,67 1,60 3,33 Cluster performance Improved cluster innovation 0,00 0,00 0,25 0,50 0,75 0,75 0,58 2,75 Cluster performance Internationalising 0,80 2,60 2,80 2,60 0,60 2,60 1,69 5,60 Cluster performance SCORE 1,00 2,06 1,94 1,31 2,00 2,75 1,76 3,19 Growth potential Regional conditions 3,80 5,80 7,00 4,80 6,00 7,20 5,06 8,00 Growth potential Public policy supporting cluster development 4,17 2,67 2,50 3,17 7,33 4,17 3,03 7,33 Growth potential Associated institutions 2,83 4,33 5,00 3,00 6,67 4,00 4,23 6,67 Growth potential Cluster leadership 8,00 2,75 7,25 5,75 6,25 7,25 6,10 8,00 Growth potential SCORE 4,43 3,90 5,19 4,00 6,62 5,43 4,44 6,62 Cluster strategy Economies of scale 5,80 6,40 4,20 4,80 5,80 7,00 6,87 9,40 Cluster strategy Creating knowledge and innovation network 6,17 6,00 7,83 4,33 6,67 8,50 6,83 8,67 Cluster strategy Impact on business environment 6,80 9,00 6,80 6,40 8,00 8,00 7,60 9,60 Cluster strategy SCORE 6,25 7,06 6,38 5,13 6,81 7,88 7,09 8,31
272 Values, average value and the value of benchmark for clusters with external co-funding of up to PLN 1 million Area Sub-area Average value Benchmark value Cluster resources Human resources and know-how 3,50 3,00 1,83 2,83 2,50 3,33 1,50 2,77 6,83 Cluster resources Financial resources 3,33 0,67 0,67 0,67 1,67 0,67 0,67 0,98 3,33 Cluster resources Infrastructural resources 2,00 5,33 0,67 4,67 3,33 0,67 0,33 2,02 5,33 Cluster resources SCORE 3,08 3,00 1,25 2,75 2,50 2,00 1,00 2,14 4,50 Cluster processes Market activity 2,25 4,75 2,25 2,50 4,75 1,75 3,00 3,07 5,00 Cluster processes Marketing and PR 6,67 6,00 5,17 5,83 6,50 4,33 4,83 5,70 7,83 Cluster processes Internal communication 3,50 4,75 2,25 2,75 7,75 3,00 3,25 3,73 7,75 Cluster processes Knowledge and innovation shaping 4,33 5,50 2,83 6,67 6,67 3,50 2,17 4,12 6,67 Cluster processes SCORE 4,45 5,35 3,30 4,80 6,45 3,30 3,35 4,31 6,45 Cluster performance HR development 5,00 5,00 2,75 2,75 4,00 3,25 3,25 3,55 5,00 Cluster performance Improved competitive standing of the cluster (market position) 3,00 2,33 3,67 4,00 2,00 1,00 1,00 1,95 4,00 Cluster performance Improved cluster innovation 1,25 3,75 1,00 1,00 0,75 2,75 1,50 1,54 3,75 Cluster performance Internationalising 3,80 1,80 1,00 3,40 1,00 1,60 1,60 2,20 7,00 Cluster performance SCORE 3,31 3,19 1,94 2,75 1,88 2,19 1,88 2,33 4,50 Growth potential Regional conditions 6,60 5,40 5,80 7,20 6,20 6,20 6,00 6,11 7,60 Growth potential Public policy supporting cluster development 6,67 0,67 2,33 5,33 2,83 5,17 2,33 3,82 7,00 Growth potential Associated institutions 3,50 3,83 3,00 4,00 4,33 6,33 3,00 3,76 6,33 Growth potential Cluster leadership 7,25 6,00 7,00 7,00 7,75 6,00 5,50 6,23 7,75 Growth potential SCORE 5,86 3,71 4,24 5,71 5,00 5,90 4,00 4,81 6,38 Cluster strategy Economies of scale 5,80 7,80 5,20 7,20 7,80 7,00 5,80 6,71 8,80 Cluster strategy Creating knowledge and innovation network 8,50 7,50 7,00 7,67 7,33 6,67 7,67 6,93 8,50 Cluster strategy Impact on business environment 8,40 8,80 6,20 8,20 8,20 7,40 7,80 7,36 8,80 Cluster strategy SCORE 7,63 8,00 6,19 7,69 7,75 7,00 7,13 7,00 8,56
273 Values, average value and the value of benchmark for clusters with external co-funding of up to PLN 1 million Area Sub-area Average value Benchmark value Cluster resources Human resources and know-how 6,83 2,00 2,50 1,50 1,17 3,67 2,67 2,77 6,83 Cluster resources Financial resources 0,67 0,67 0,67 0,67 1,00 0,67 1,00 0,98 3,33 Cluster resources Infrastructural resources 3,67 0,33 1,67 0,67 0,33 2,00 2,67 2,02 5,33 Cluster resources SCORE 4,50 1,25 1,83 1,08 0,92 2,50 2,25 2,14 4,50 Cluster processes Market activity 3,00 4,50 1,50 2,50 2,50 2,75 5,00 3,07 5,00 Cluster processes Marketing and PR 7,67 7,33 4,83 3,17 3,67 6,00 7,83 5,70 7,83 Cluster processes Internal communication 5,25 4,00 3,50 1,75 1,25 4,25 5,00 3,73 7,75 Cluster processes Knowledge and innovation shaping 6,33 3,50 4,33 2,67 1,00 3,33 4,83 4,12 6,67 Cluster processes SCORE 5,85 4,95 3,75 2,60 2,15 4,20 5,80 4,31 6,45 Cluster performance HR development 4,50 3,00 2,00 5,00 2,00 2,75 4,50 3,55 5,00 Cluster performance Improved competitive standing of the cluster (market position) 2,33 1,00 1,67 1,67 0,67 1,00 2,00 1,95 4,00 Cluster performance Improved cluster innovation 3,00 0,50 0,50 2,00 1,75 1,00 0,75 1,54 3,75 Cluster performance Internationalising 7,00 3,00 1,00 0,80 0,40 3,20 1,20 2,20 7,00 Cluster performance SCORE 4,50 2,00 1,25 2,31 1,19 2,13 2,06 2,33 4,50 Growth potential Regional conditions 6,60 4,60 6,40 6,60 3,40 7,00 7,60 6,11 7,60 Growth potential Public policy supporting cluster development 6,83 1,67 4,83 0,33 0,67 6,83 7,00 3,82 7,00 Growth potential Associated institutions 5,00 2,00 5,67 2,17 1,33 5,00 3,50 3,76 6,33 Growth potential Cluster leadership 7,50 6,25 5,50 4,75 3,00 6,50 7,25 6,23 7,75 Growth potential SCORE 6,38 3,33 5,57 3,19 1,95 6,29 6,19 4,81 6,38 Cluster strategy Economies of scale 5,20 5,80 7,40 7,20 5,80 7,20 8,80 6,71 8,80 Cluster strategy Creating knowledge and innovation network 4,83 6,17 8,33 6,17 5,00 6,00 8,17 6,93 8,50 Cluster strategy Impact on business environment 7,20 6,40 7,00 6,00 6,00 6,60 8,80 7,36 8,80 Cluster strategy SCORE 5,69 6,13 7,63 6,44 5,56 6,56 8,56 7,00 8,56
274 Values, average value and the value of benchmark for clusters with external co-funding of more than PLN 1 million Area Sub-area Average value Benchmark value Cluster resources Human resources and know-how 1,67 3,00 1,83 3,00 1,50 2,67 2,61 3,83 Cluster resources Financial resources 4,33 0,67 0,67 3,00 2,33 0,67 2,42 7,00 Cluster resources Infrastructural resources 0,67 0,67 0,67 4,33 1,00 0,67 1,64 4,33 Cluster resources SCORE 2,08 1,83 1,25 3,33 1,58 1,67 2,32 3,92 Cluster processes Market activity 3,50 3,50 1,75 3,50 2,00 3,50 3,25 7,00 Cluster processes Marketing and PR 4,00 4,83 4,50 7,67 3,83 4,50 5,71 9,67 Cluster processes Internal communication 5,50 1,75 5,75 6,75 2,00 2,50 4,36 7,00 Cluster processes Knowledge and innovation shaping 6,17 3,17 3,67 6,67 3,67 4,00 5,06 7,83 Cluster processes SCORE 4,85 3,45 3,95 6,35 3,05 3,75 4,75 6,95 Cluster performance HR development 2,75 3,50 2,75 4,75 2,75 2,25 3,48 7,25 Cluster performance Improved competitive standing of the cluster (market position) 2,67 1,00 2,33 1,33 1,00 2,67 2,58 5,00 Cluster performance Improved cluster innovation 4,00 2,75 0,50 1,00 1,25 2,25 2,36 5,25 Cluster performance Internationalising 1,00 1,40 1,20 3,00 0,20 2,20 2,45 7,60 Cluster performance SCORE 2,50 2,19 1,63 2,63 1,25 2,31 2,71 5,25 Growth potential Regional conditions 7,40 5,20 7,00 6,60 4,60 3,00 5,35 7,40 Growth potential Public policy supporting cluster development 6,50 2,83 3,50 6,00 6,17 1,33 4,42 7,67 Growth potential Associated institutions 5,67 3,67 4,50 5,17 4,33 3,00 4,79 7,00 Growth potential Cluster leadership 6,50 6,75 5,75 9,00 6,75 2,75 7,00 9,50 Growth potential SCORE 6,48 4,38 5,05 6,48 5,38 2,48 5,24 7,29 Cluster strategy Economies of scale 7,40 9,00 7,40 8,80 6,40 6,40 7,31 9,00 Cluster strategy Creating knowledge and innovation network 9,50 9,17 7,00 6,67 6,50 5,50 7,33 9,50 Cluster strategy Impact on business environment 6,80 8,60 7,00 8,20 5,80 7,40 7,73 9,60 Cluster strategy SCORE 8,00 8,94 7,13 7,81 6,25 6,38 7,45 8,94
275 Values, average value and the value of benchmark for clusters with external co-funding of more than PLN 1 million Area Sub-area Average value Benchmark value Cluster resources Human resources and know-how 3,50 3,17 3,83 3,33 1,17 2,61 3,83 Cluster resources Financial resources 2,33 2,33 1,33 7,00 2,00 2,42 7,00 Cluster resources Infrastructural resources 0,67 0,33 3,33 2,00 3,67 1,64 4,33 Cluster resources SCORE 2,50 2,25 3,08 3,92 2,00 2,32 3,92 Cluster processes Market activity 2,00 3,00 4,00 2,00 7,00 3,25 7,00 Cluster processes Marketing and PR 6,33 5,17 9,67 6,67 5,67 5,71 9,67 Cluster processes Internal communication 5,00 3,25 4,50 4,00 7,00 4,36 7,00 Cluster processes Knowledge and innovation shaping 6,83 4,17 7,83 5,33 4,17 5,06 7,83 Cluster processes SCORE 5,35 4,05 6,95 4,80 5,75 4,75 6,95 Cluster performance HR development 7,25 5,00 3,25 0,75 3,25 3,48 7,25 Cluster performance Improved competitive standing of the cluster (market position) 4,67 2,00 5,00 5,00 0,67 2,58 5,00 Cluster performance Improved cluster innovation 5,25 1,50 2,75 2,75 2,00 2,36 5,25 Cluster performance Internationalising 4,00 1,60 7,60 2,40 2,40 2,45 7,60 Cluster performance SCORE 5,25 2,50 4,81 2,56 2,19 2,71 5,25 Growth potential Regional conditions 5,20 3,60 7,00 4,60 4,60 5,35 7,40 Growth potential Public policy supporting cluster development 5,17 4,50 7,67 3,50 1,50 4,42 7,67 Growth potential Associated institutions 7,00 4,17 6,17 5,17 3,83 4,79 7,00 Growth potential Cluster leadership 9,50 8,25 8,75 6,75 6,25 7,00 9,50 Growth potential SCORE 6,52 4,90 7,29 4,86 3,81 5,24 7,29 Cluster strategy Economies of scale 7,40 6,00 6,20 7,60 7,80 7,31 9,00 Cluster strategy Creating knowledge and innovation network 8,00 7,17 7,17 7,17 6,83 7,33 9,50 Cluster strategy Impact on business environment 9,60 7,60 7,60 8,20 8,20 7,73 9,60 Cluster strategy SCORE 8,31 6,94 7,00 7,63 7,56 7,45 8,94
276 Values, average value and the value of benchmark for clusters operating in sectors with low level of innovation Area Sub-area Average value Benchmark value Cluster resources Human resources and know-how 2,83 3,83 1,33 1,50 1,33 3,17 2,00 3,83 Cluster resources Financial resources 0,33 0,00 0,00 2,33 0,00 2,33 1,15 3,33 Cluster resources Infrastructural resources 0,33 0,33 0,33 1,00 0,33 0,33 1,03 3,67 Cluster resources SCORE 1,58 2,00 0,75 1,58 0,75 2,25 1,55 2,25 Cluster processes Market activity 2,00 6,75 3,50 2,00 5,50 3,00 3,59 7,00 Cluster processes Marketing and PR 7,67 6,33 5,00 3,83 5,17 5,17 5,14 7,67 Cluster processes Internal communication 4,50 3,75 4,00 2,00 3,75 3,25 3,73 7,00 Cluster processes Knowledge and innovation shaping 4,33 3,33 4,83 3,67 3,67 4,17 3,67 4,83 Cluster processes SCORE 4,90 5,00 4,45 3,05 4,50 4,05 4,10 5,75 Cluster performance HR development 3,50 2,75 1,50 2,75 2,75 5,00 2,98 5,00 Cluster performance Improved competitive standing of the cluster (market position) 2,00 1,00 2,67 1,00 1,33 2,00 1,42 2,67 Cluster performance Improved cluster innovation 0,00 0,00 0,00 1,25 0,00 1,50 0,82 2,00 Cluster performance Internationalising 1,20 1,20 0,80 0,20 1,00 1,60 1,04 2,40 Cluster performance SCORE 1,63 1,25 1,13 1,25 1,25 2,50 1,54 2,50 Growth potential Regional conditions 8,00 5,20 3,80 4,60 5,20 3,60 5,02 8,00 Growth potential Public policy supporting cluster development 4,50 2,50 3,00 6,17 1,17 4,50 3,03 6,17 Growth potential Associated institutions 6,17 4,33 4,17 4,33 1,67 4,17 3,70 6,17 Growth potential Cluster leadership 5,75 7,00 6,25 6,75 3,50 8,25 5,91 8,25 Growth potential SCORE 6,05 4,52 4,14 5,38 2,71 4,90 4,24 6,05 Cluster strategy Economies of scale 8,60 7,40 5,80 6,40 9,40 6,00 7,05 9,40 Cluster strategy Creating knowledge and innovation network 6,83 6,67 5,17 6,50 7,17 7,17 6,55 8,33 Cluster strategy Impact on business environment 7,80 8,00 5,60 5,80 8,20 7,60 7,00 8,20 Cluster strategy SCORE 7,69 7,31 5,50 6,25 8,19 6,94 6,85 8,19
277 Values, average value and the value of benchmark for clusters operating in sectors with low level of innovation Area Sub-area Average value Benchmark value Cluster resources Human resources and know-how 2,50 1,50 1,67 1,17 1,17 2,00 3,83 Cluster resources Financial resources 0,67 0,67 3,33 1,00 2,00 1,15 3,33 Cluster resources Infrastructural resources 1,67 0,67 2,33 0,33 3,67 1,03 3,67 Cluster resources SCORE 1,83 1,08 2,25 0,92 2,00 1,55 2,25 Cluster processes Market activity 1,50 2,50 3,25 2,50 7,00 3,59 7,00 Cluster processes Marketing and PR 4,83 3,17 6,00 3,67 5,67 5,14 7,67 Cluster processes Internal communication 3,50 1,75 6,25 1,25 7,00 3,73 7,00 Cluster processes Knowledge and innovation shaping 4,33 2,67 4,17 1,00 4,17 3,67 4,83 Cluster processes SCORE 3,75 2,60 4,95 2,15 5,75 4,10 5,75 Cluster performance HR development 2,00 5,00 2,25 2,00 3,25 2,98 5,00 Cluster performance Improved competitive standing of the cluster (market position) 1,67 1,67 1,00 0,67 0,67 1,42 2,67 Cluster performance Improved cluster innovation 0,50 2,00 0,00 1,75 2,00 0,82 2,00 Cluster performance Internationalising 1,00 0,80 0,80 0,40 2,40 1,04 2,40 Cluster performance SCORE 1,25 2,31 1,00 1,19 2,19 1,54 2,50 Growth potential Regional conditions 6,40 6,60 3,80 3,40 4,60 5,02 8,00 Growth potential Public policy supporting cluster development 4,83 0,33 4,17 0,67 1,50 3,03 6,17 Growth potential Associated institutions 5,67 2,17 2,83 1,33 3,83 3,70 6,17 Growth potential Cluster leadership 5,50 4,75 8,00 3,00 6,25 5,91 8,25 Growth potential SCORE 5,57 3,19 4,43 1,95 3,81 4,24 6,05 Cluster strategy Economies of scale 7,40 7,20 5,80 5,80 7,80 7,05 9,40 Cluster strategy Creating knowledge and innovation network 8,33 6,17 6,17 5,00 6,83 6,55 8,33 Cluster strategy Impact on business environment 7,00 6,00 6,80 6,00 8,20 7,00 8,20 Cluster strategy SCORE 7,63 6,44 6,25 5,56 7,56 6,85 8,19
278 Values, average value and the value of benchmark for clusters operating in sectors with medium level of innovation Area Sub-area Average value Benchmark value Cluster resources Human resources and know-how 2,17 1,67 1,83 3,00 1,83 2,50 3,00 2,37 3,67 Cluster resources Financial resources 3,67 3,00 0,67 0,67 0,67 1,67 3,00 1,05 3,67 Cluster resources Infrastructural resources 1,33 0,33 0,67 0,67 0,67 3,33 4,33 1,23 4,33 Cluster resources SCORE 2,33 1,67 1,25 1,83 1,25 2,50 3,33 1,75 3,33 Cluster processes Market activity 3,00 3,75 2,25 3,50 1,75 4,75 3,50 2,80 5,00 Cluster processes Marketing and PR 5,83 6,33 5,17 4,83 4,50 6,50 7,67 5,28 7,83 Cluster processes Internal communication 4,75 4,00 2,25 1,75 5,75 7,75 6,75 3,63 7,75 Cluster processes Knowledge and innovation shaping 4,83 5,33 2,83 3,17 3,67 6,67 6,67 4,28 6,67 Cluster processes SCORE 4,75 5,05 3,30 3,45 3,95 6,45 6,35 4,16 6,45 Cluster performance HR development 4,25 2,75 2,75 3,50 2,75 4,00 4,75 3,34 5,75 Cluster performance Improved competitive standing of the cluster (market position) 3,33 0,67 3,67 1,00 2,33 2,00 1,33 1,81 3,67 Cluster performance Improved cluster innovation 0,00 1,25 1,00 2,75 0,50 0,75 1,00 1,07 2,75 Cluster performance Internationalising 0,20 1,00 1,00 1,40 1,20 1,00 3,00 1,68 3,20 Cluster performance SCORE 1,75 1,44 1,94 2,19 1,63 1,88 2,63 1,97 2,75 Growth potential Regional conditions 5,20 4,00 5,80 5,20 7,00 6,20 6,60 5,57 7,60 Growth potential Public policy supporting cluster development 2,50 2,83 2,33 2,83 3,50 2,83 6,00 3,60 7,33 Growth potential Associated institutions 2,00 3,67 3,00 3,67 4,50 4,33 5,17 4,13 6,67 Growth potential Cluster leadership 4,75 7,75 7,00 6,75 5,75 7,75 9,00 6,36 9,00 Growth potential SCORE 3,43 4,29 4,24 4,38 5,05 5,00 6,48 4,74 6,62 Cluster strategy Economies of scale 8,20 6,60 5,20 9,00 7,40 7,80 8,80 7,02 9,40 Cluster strategy Creating knowledge and innovation network 6,67 8,67 7,00 9,17 7,00 7,33 6,67 7,04 9,17 Cluster strategy Impact on business environment 8,28 9,60 6,20 8,60 7,00 8,20 8,20 7,69 9,60 Cluster strategy SCORE 7,75 8,31 6,19 8,94 7,13 7,75 7,81 7,24 8,94
279 Values, average value and the value of benchmark for clusters operating in sectors with medium level of innovation Area Sub-area Average value Benchmark value Cluster resources Human resources and know-how 2,67 1,17 2,83 2,33 1,67 2,00 2,83 2,37 3,67 Cluster resources Financial resources 0,67 3,67 0,33 0,33 0,00 0,00 0,00 1,05 3,67 Cluster resources Infrastructural resources 0,67 0,67 0,67 0,67 0,67 0,67 1,00 1,23 4,33 Cluster resources SCORE 1,67 1,67 1,67 1,42 1,00 1,17 1,67 1,75 3,33 Cluster processes Market activity 3,50 2,50 2,75 2,25 1,25 2,00 1,75 2,80 5,00 Cluster processes Marketing and PR 4,50 5,33 5,83 3,33 1,83 4,33 4,83 5,28 7,83 Cluster processes Internal communication 2,50 4,00 2,25 3,75 2,25 0,25 3,00 3,63 7,75 Cluster processes Knowledge and innovation shaping 4,00 3,67 6,33 3,17 3,33 2,67 5,67 4,28 6,67 Cluster processes SCORE 3,75 4,00 4,65 3,15 2,25 2,55 4,10 4,16 6,45 Cluster performance HR development 2,25 3,00 5,75 3,00 1,00 2,75 2,50 3,34 5,75 Cluster performance Improved competitive standing of the cluster (market position) 2,67 1,33 0,33 1,67 1,00 3,00 2,00 1,81 3,67 Cluster performance Improved cluster innovation 2,25 1,25 2,75 2,25 0,50 0,00 0,25 1,07 2,75 Cluster performance Internationalising 2,20 2,80 0,60 0,60 1,40 2,60 2,80 1,68 3,20 Cluster performance SCORE 2,31 2,19 2,38 1,81 1,00 2,06 1,94 1,97 2,75 Growth potential Regional conditions 3,00 5,40 2,40 5,60 4,00 5,80 7,00 5,57 7,60 Growth potential Public policy supporting cluster development 1,33 2,17 3,50 4,33 0,50 2,67 2,50 3,60 7,33 Growth potential Associated institutions 3,00 4,67 4,83 4,83 3,33 4,33 5,00 4,13 6,67 Growth potential Cluster leadership 2,75 7,75 5,75 6,75 6,00 2,75 7,25 6,36 9,00 Growth potential SCORE 2,48 4,71 4,05 5,24 3,19 3,90 5,19 4,74 6,62 Cluster strategy Economies of scale 6,40 9,40 5,60 7,00 7,80 6,40 4,20 7,02 9,40 Cluster strategy Creating knowledge and innovation network 5,50 6,50 7,00 6,50 8,17 6,00 7,83 7,04 9,17 Cluster strategy Impact on business environment 7,40 7,60 5,60 8,40 7,40 9,00 6,80 7,69 9,60 Cluster strategy SCORE 6,38 7,75 6,13 7,25 7,81 7,06 6,38 7,24 8,94
280 Values, average value and the value of benchmark for clusters operating in sectors with medium level of innovation Area Sub-area Average value Benchmark value Cluster resources Human resources and know-how 1,33 3,33 2,50 3,67 2,67 2,37 3,67 Cluster resources Financial resources 0,00 0,00 0,00 0,67 1,00 1,05 3,67 Cluster resources Infrastructural resources 0,67 1,00 0,67 2,00 2,67 1,23 4,33 Cluster resources SCORE 0,83 1,92 1,42 2,50 2,25 1,75 3,33 Cluster processes Market activity 2,25 3,00 1,75 2,75 5,00 2,80 5,00 Cluster processes Marketing and PR 5,83 4,00 5,83 6,00 7,83 5,28 7,83 Cluster processes Internal communication 3,25 2,50 3,00 4,25 5,00 3,63 7,75 Cluster processes Knowledge and innovation shaping 3,67 3,33 4,17 3,33 4,83 4,28 6,67 Cluster processes SCORE 3,95 3,30 3,95 4,20 5,80 4,16 6,45 Cluster performance HR development 0,75 5,50 5,00 2,75 4,50 3,34 5,75 Cluster performance Improved competitive standing of the cluster (market position) 1,00 1,33 2,67 1,00 2,00 1,81 3,67 Cluster performance Improved cluster innovation 0,50 0,75 0,75 1,00 0,75 1,07 2,75 Cluster performance Internationalising 2,60 0,60 2,60 3,20 1,20 1,68 3,20 Cluster performance SCORE 1,31 2,00 2,75 2,13 2,06 1,97 2,75 Growth potential Regional conditions 4,80 6,00 7,20 7,00 7,60 5,57 7,60 Growth potential Public policy supporting cluster development 3,17 7,33 4,17 6,83 7,00 3,60 7,33 Growth potential Associated institutions 3,00 6,67 4,00 5,00 3,50 4,13 6,67 Growth potential Cluster leadership 5,75 6,25 7,25 6,50 7,25 6,36 9,00 Growth potential SCORE 4,00 6,62 5,43 6,29 6,19 4,74 6,62 Cluster strategy Economies of scale 4,80 5,80 7,00 7,20 8,80 7,02 9,40 Cluster strategy Creating knowledge and innovation network 4,33 6,67 8,50 6,00 8,17 7,04 9,17 Cluster strategy Impact on business environment 6,40 8,00 8,00 6,60 8,80 7,69 9,60 Cluster strategy SCORE 5,13 6,81 7,88 6,56 8,56 7,24 8,94
281 Values, average value and the value of benchmark for clusters operating in sectors with high level of innovation Area Sub-area Average value Average value Benchmark value Cluster resources Human resources and know-how 1,33 3,50 3,00 1,67 2,83 2,17 1,33 3,33 2,76 6,83 Cluster resources Financial resources 0,00 3,33 0,67 4,33 0,67 0,33 0,00 0,67 1,51 7,00 Cluster resources Infrastructural resources 2,00 2,00 5,33 0,67 4,67 0,33 4,67 0,67 2,07 5,33 Cluster resources SCORE 1,17 3,08 3,00 2,08 2,75 1,25 1,83 2,00 2,27 4,50 Cluster processes Market activity 1,75 2,25 4,75 3,50 2,50 2,75 3,75 1,75 2,90 4,75 Cluster processes Marketing and PR 3,33 6,67 6,00 4,00 5,83 3,50 1,83 4,33 5,41 9,67 Cluster processes Internal communication 4,00 3,50 4,75 5,50 2,75 2,50 2,75 3,00 3,77 5,50 Cluster processes Knowledge and innovation shaping 3,17 4,33 5,50 6,17 6,67 4,00 4,50 3,50 4,84 7,83 Cluster processes SCORE 3,10 4,45 5,35 4,85 4,80 3,30 3,20 3,30 4,41 6,95 Cluster performance HR development 2,75 5,00 5,00 2,75 2,75 4,00 2,75 3,25 3,63 7,25 Cluster performance Improved competitive standing of the cluster (market position) 1,33 3,00 2,33 2,67 4,00 1,67 1,67 1,00 2,51 5,00 Cluster performance Improved cluster innovation 0,25 1,25 3,75 4,00 1,00 0,00 0,25 2,75 1,98 5,25 Cluster performance Internationalising 1,60 3,80 1,80 1,00 3,40 0,80 3,00 1,60 3,21 7,60 Cluster performance SCORE 1,50 3,31 3,19 2,50 2,75 1,56 2,00 2,19 2,88 5,25 Growth potential Regional conditions 5,00 6,60 5,40 7,40 7,20 2,60 5,60 6,20 5,64 7,40 Growth potential Public policy supporting cluster development 3,33 6,67 0,67 6,50 5,33 0,50 5,67 5,17 4,08 7,67 Growth potential Associated institutions 5,33 3,50 3,83 5,67 4,00 3,67 4,67 6,33 4,72 7,00 Growth potential Cluster leadership 5,75 7,25 6,00 6,50 7,00 5,50 6,25 6,00 6,70 9,50 Growth potential SCORE 4,76 5,86 3,71 6,48 5,71 2,86 5,48 5,90 5,13 7,29 Cluster strategy Economies of scale 6,00 5,80 7,80 7,40 7,20 7,60 6,20 7,00 6,72 7,80 Cluster strategy Creating knowledge and innovation network 5,67 8,50 7,50 9,50 7,67 7,67 7,67 6,67 7,24 9,50 Cluster strategy Impact on business environment 6,80 8,40 8,80 6,80 8,20 7,40 7,60 7,40 7,80 9,60 Cluster strategy SCORE 6,13 7,63 8,00 8,00 7,69 7,56 7,19 7,00 7,25 8,31
282 Values, average value and the value of benchmark for clusters operating in sectors with high level of innovation Area Sub-area Average value Benchmark value Cluster resources Human resources and know-how 3,50 1,50 1,17 6,83 2,00 3,83 3,33 2,76 6,83 Cluster resources Financial resources 2,33 0,67 0,00 0,67 0,67 1,33 7,00 1,51 7,00 Cluster resources Infrastructural resources 0,67 0,33 0,33 3,67 0,33 3,33 2,00 2,07 5,33 Cluster resources SCORE 2,50 1,00 0,67 4,50 1,25 3,08 3,92 2,27 4,50 Cluster processes Market activity 2,00 3,00 2,00 3,00 4,50 4,00 2,00 2,90 4,75 Cluster processes Marketing and PR 6,33 4,83 3,17 7,67 7,33 9,67 6,67 5,41 9,67 Cluster processes Internal communication 5,00 3,25 1,75 5,25 4,00 4,50 4,00 3,77 5,50 Cluster processes Knowledge and innovation shaping 6,83 2,17 2,83 6,33 3,50 7,83 5,33 4,84 7,83 Cluster processes SCORE 5,35 3,35 2,55 5,85 4,95 6,95 4,80 4,41 6,95 Cluster performance HR development 7,25 3,25 4,25 4,50 3,00 3,25 0,75 3,63 7,25 Cluster performance Improved competitive standing of the cluster (market position) 4,67 1,00 1,00 2,33 1,00 5,00 5,00 2,51 5,00 Cluster performance Improved cluster innovation 5,25 1,50 0,75 3,00 0,50 2,75 2,75 1,98 5,25 Cluster performance Internationalising 4,00 1,60 5,60 7,00 3,00 7,60 2,40 3,21 7,60 Cluster performance SCORE 5,25 1,88 3,19 4,50 2,00 4,81 2,56 2,88 5,25 Growth potential Regional conditions 5,20 6,00 4,60 6,60 4,60 7,00 4,60 5,64 7,40 Growth potential Public policy supporting cluster development 5,17 2,33 0,17 6,83 1,67 7,67 3,50 4,08 7,67 Growth potential Associated institutions 7,00 3,00 5,50 5,00 2,00 6,17 5,17 4,72 7,00 Growth potential Cluster leadership 9,50 5,50 6,00 7,50 6,25 8,75 6,75 6,70 9,50 Growth potential SCORE 6,52 4,00 3,86 6,38 3,33 7,29 4,86 5,13 7,29 Cluster strategy Economies of scale 7,40 5,80 7,80 5,20 5,80 6,20 7,60 6,72 7,80 Cluster strategy Creating knowledge and innovation network 8,00 7,67 6,83 4,83 6,17 7,17 7,17 7,24 9,50 Cluster strategy Impact on business environment 9,60 7,80 8,80 7,20 6,40 7,60 8,20 7,80 9,60 Cluster strategy SCORE 8,31 7,13 7,75 5,69 6,13 7,00 7,63 7,25 8,31
283 Values, average value and the value of benchmark for clusters comprising up to 30 entities Area Sub-area Average value Benchmark value Cluster resources Human resources and know-how 1,33 3,00 3,00 1,83 2,17 1,33 1,33 1,80 3,33 Cluster resources Financial resources 0,00 0,67 0,67 0,67 0,33 0,00 0,00 1,16 7,00 Cluster resources Infrastructural resources 2,00 5,33 0,67 0,67 0,33 4,67 0,33 1,46 5,33 Cluster resources SCORE 1,17 3,00 1,83 1,25 1,25 1,83 0,75 1,55 3,92 Cluster processes Market activity 1,75 4,75 3,50 1,75 2,75 3,75 5,50 3,05 7,00 Cluster processes Marketing and PR 3,33 6,00 4,83 4,50 3,50 1,83 5,17 4,61 7,33 Cluster processes Internal communication 4,00 4,75 1,75 5,75 2,50 2,75 3,75 3,55 7,00 Cluster processes Knowledge and innovation shaping 3,17 5,50 3,17 3,67 4,00 4,50 3,67 3,61 5,50 Cluster processes SCORE 3,10 5,35 3,45 3,95 3,30 3,20 4,50 3,78 5,75 Cluster performance HR development 2,75 5,00 3,50 2,75 4,00 2,75 2,75 2,84 5,00 Cluster performance Improved competitive standing of the cluster (market position) 1,33 2,33 1,00 2,33 1,67 1,67 1,33 1,51 5,00 Cluster performance Improved cluster innovation 0,25 3,75 2,75 0,50 0,00 0,25 0,00 1,13 3,75 Cluster performance Internationalising 1,60 1,80 1,40 1,20 0,80 3,00 1,00 1,87 5,60 Cluster performance SCORE 1,50 3,19 2,19 1,63 1,56 2,00 1,25 1,86 3,19 Growth potential Regional conditions 5,00 5,40 5,20 7,00 2,60 5,60 5,20 4,99 7,00 Growth potential Public policy supporting cluster development 3,33 0,67 2,83 3,50 0,50 5,67 1,17 2,25 5,67 Growth potential Associated institutions 5,33 3,83 3,67 4,50 3,67 4,67 1,67 3,68 5,67 Growth potential Cluster leadership 5,75 6,00 6,75 5,75 5,50 6,25 3,50 5,84 8,00 Growth potential SCORE 4,76 3,71 4,38 5,05 2,86 5,48 2,71 3,99 5,57 Cluster strategy Economies of scale 6,00 7,80 9,00 7,40 7,60 6,20 9,40 7,18 9,40 Cluster strategy Creating knowledge and innovation network 5,67 7,50 9,17 7,00 7,67 7,67 7,17 6,90 9,17 Cluster strategy Impact on business environment 6,80 8,80 8,60 7,00 7,40 7,60 8,20 7,42 8,80 Cluster strategy SCORE 6,13 8,00 8,94 7,13 7,56 7,19 8,19 7,15 8,94
284 Values, average value and the value of benchmark for clusters comprising up to 30 entities Area Sub-area Average value Benchmark value Cluster resources Human resources and know-how 1,50 1,17 2,33 1,67 1,17 2,00 2,50 1,80 3,33 Cluster resources Financial resources 0,67 3,67 0,33 0,00 0,00 0,67 0,67 1,16 7,00 Cluster resources Infrastructural resources 0,33 0,67 0,67 0,67 0,33 0,33 1,67 1,46 5,33 Cluster resources SCORE 1,00 1,67 1,42 1,00 0,67 1,25 1,83 1,55 3,92 Cluster processes Market activity 3,00 2,50 2,25 1,25 2,00 4,50 1,50 3,05 7,00 Cluster processes Marketing and PR 4,83 5,33 3,33 1,83 3,17 7,33 4,83 4,61 7,33 Cluster processes Internal communication 3,25 4,00 3,75 2,25 1,75 4,00 3,50 3,55 7,00 Cluster processes Knowledge and innovation shaping 2,17 3,67 3,17 3,33 2,83 3,50 4,33 3,61 5,50 Cluster processes SCORE 3,35 4,00 3,15 2,25 2,55 4,95 3,75 3,78 5,75 Cluster performance HR development 3,25 3,00 3,00 1,00 4,25 3,00 2,00 2,84 5,00 Cluster performance Improved competitive standing of the cluster (market position) 1,00 1,33 1,67 1,00 1,00 1,00 1,67 1,51 5,00 Cluster performance Improved cluster innovation 1,50 1,25 2,25 0,50 0,75 0,50 0,50 1,13 3,75 Cluster performance Internationalising 1,60 2,80 0,60 1,40 5,60 3,00 1,00 1,87 5,60 Cluster performance SCORE 1,88 2,19 1,81 1,00 3,19 2,00 1,25 1,86 3,19 Growth potential Regional conditions 6,00 5,40 5,60 4,00 4,60 4,60 6,40 4,99 7,00 Growth potential Public policy supporting cluster development 2,33 2,17 4,33 0,50 0,17 1,67 4,83 2,25 5,67 Growth potential Associated institutions 3,00 4,67 4,83 3,33 5,50 2,00 5,67 3,68 5,67 Growth potential Cluster leadership 5,50 7,75 6,75 6,00 6,00 6,25 5,50 5,84 8,00 Growth potential SCORE 4,00 4,71 5,24 3,19 3,86 3,33 5,57 3,99 5,57 Cluster strategy Economies of scale 5,80 9,40 7,00 7,80 7,80 5,80 7,40 7,18 9,40 Cluster strategy Creating knowledge and innovation network 7,67 6,50 6,50 8,17 6,83 6,17 8,33 6,90 9,17 Cluster strategy Impact on business environment 7,80 7,60 8,40 7,40 8,80 6,40 7,00 7,42 8,80 Cluster strategy SCORE 7,13 7,75 7,25 7,81 7,75 6,13 7,63 7,15 8,94
285 Values, average value and the value of benchmark for clusters comprising up to 30 entities Area Sub-area Average value Average value Cluster resources Human resources and know-how 1,50 1,67 1,33 3,33 1,17 1,17 1,80 3,33 Cluster resources Financial resources 0,67 3,33 0,00 7,00 1,00 2,00 1,16 7,00 Cluster resources Infrastructural resources 0,67 2,33 0,67 2,00 0,33 3,67 1,46 5,33 Cluster resources SCORE 1,08 2,25 0,83 3,92 0,92 2,00 1,55 3,92 Cluster processes Market activity 2,50 3,25 2,25 2,00 2,50 7,00 3,05 7,00 Cluster processes Marketing and PR 3,17 6,00 5,83 6,67 3,67 5,67 4,61 7,33 Cluster processes Internal communication 1,75 6,25 3,25 4,00 1,25 7,00 3,55 7,00 Cluster processes Knowledge and innovation shaping 2,67 4,17 3,67 5,33 1,00 4,17 3,61 5,50 Cluster processes SCORE 2,60 4,95 3,95 4,80 2,15 5,75 3,78 5,75 Cluster performance HR development 5,00 2,25 0,75 0,75 2,00 3,25 2,84 5,00 Cluster performance Improved competitive standing of the cluster (market position) 1,67 1,00 1,00 5,00 0,67 0,67 1,51 5,00 Cluster performance Improved cluster innovation 2,00 0,00 0,50 2,75 1,75 2,00 1,13 3,75 Cluster performance Internationalising 0,80 0,80 2,60 2,40 0,40 2,40 1,87 5,60 Cluster performance SCORE 2,31 1,00 1,31 2,56 1,19 2,19 1,86 3,19 Growth potential Regional conditions 6,60 3,80 4,80 4,60 3,40 4,60 4,99 7,00 Growth potential Public policy supporting cluster development 0,33 4,17 3,17 3,50 0,67 1,50 2,25 5,67 Growth potential Associated institutions 2,17 2,83 3,00 5,17 1,33 3,83 3,68 5,67 Growth potential Cluster leadership 4,75 8,00 5,75 6,75 3,00 6,25 5,84 8,00 Growth potential SCORE 3,19 4,43 4,00 4,86 1,95 3,81 3,99 5,57 Cluster strategy Economies of scale 7,20 5,80 4,80 7,60 5,80 7,80 7,18 9,40 Cluster strategy Creating knowledge and innovation network 6,17 6,17 4,33 7,17 5,00 6,83 6,90 9,17 Cluster strategy Impact on business environment 6,00 6,80 6,40 8,20 6,00 8,20 7,42 8,80 Cluster strategy SCORE 6,44 6,25 5,13 7,63 5,56 7,56 7,15 8,94
286 Values, average value and the value of benchmark for clusters comprising from 31 to 60 entities Area Sub-area Average value Benchmark value Cluster resources Human resources and know-how 1,67 2,83 1,33 2,50 3,00 1,50 3,33 2,55 3,67 Cluster resources Financial resources 4,33 0,33 0,00 1,67 3,00 2,33 0,67 1,10 4,33 Cluster resources Infrastructural resources 0,67 0,33 0,33 3,33 4,33 1,00 0,67 1,41 4,33 Cluster resources SCORE 2,08 1,58 0,75 2,50 3,33 1,58 2,00 1,90 4,11 Cluster processes Market activity 3,50 2,00 3,50 4,75 3,50 2,00 1,75 2,94 5,00 Cluster processes Marketing and PR 4,00 7,67 5,00 6,50 7,67 3,83 4,33 5,60 7,83 Cluster processes Internal communication 5,50 4,50 4,00 7,75 6,75 2,00 3,00 3,90 7,75 Cluster processes Knowledge and innovation shaping 6,17 4,33 4,83 6,67 6,67 3,67 3,50 4,65 6,67 Cluster processes SCORE 4,85 4,90 4,45 6,45 6,35 3,05 3,30 4,45 6,81 Cluster performance HR development 2,75 3,50 1,50 4,00 4,75 2,75 3,25 3,75 5,75 Cluster performance Improved competitive standing of the cluster (market position) 2,67 2,00 2,67 2,00 1,33 1,00 1,00 1,77 3,00 Cluster performance Improved cluster innovation 4,00 0,00 0,00 0,75 1,00 1,25 2,75 1,21 4,00 Cluster performance Internationalising 1,00 1,20 0,80 1,00 3,00 0,20 1,60 1,51 3,20 Cluster performance SCORE 2,50 1,63 1,13 1,88 2,63 1,25 2,19 2,04 3,99 Growth potential Regional conditions 7,40 8,00 3,80 6,20 6,60 4,60 6,20 6,06 8,00 Growth potential Public policy supporting cluster development 6,50 4,50 3,00 2,83 6,00 6,17 5,17 5,05 7,33 Growth potential Associated institutions 5,67 6,17 4,17 4,33 5,17 4,33 6,33 4,96 6,67 Growth potential Cluster leadership 6,50 5,75 6,25 7,75 9,00 6,75 6,00 6,44 9,00 Growth potential SCORE 6,48 6,05 4,14 5,00 6,48 5,38 5,90 5,53 7,75 Cluster strategy Economies of scale 7,40 8,60 5,80 7,80 8,80 6,40 7,00 7,12 8,80 Cluster strategy Creating knowledge and innovation network 9,50 6,83 5,17 7,33 6,67 6,50 6,67 7,00 9,50 Cluster strategy Impact on business environment 6,80 7,80 5,60 8,20 8,20 5,80 7,40 7,37 9,00 Cluster strategy SCORE 8,00 7,69 5,50 7,75 7,81 6,25 7,00 7,15 9,10
287 Values, average value and the value of benchmark for clusters comprising from 31 to 60 entities Area Sub-area Average value Benchmark value Cluster resources Human resources and know-how 2,83 2,00 2,83 3,33 2,50 3,67 2,67 2,55 3,67 Cluster resources Financial resources 0,33 0,00 0,00 0,00 0,00 0,67 1,00 1,10 4,33 Cluster resources Infrastructural resources 0,67 0,67 1,00 1,00 0,67 2,00 2,67 1,41 4,33 Cluster resources SCORE 1,67 1,17 1,67 1,92 1,42 2,50 2,25 1,90 4,11 Cluster processes Market activity 2,75 2,00 1,75 3,00 1,75 2,75 5,00 2,94 5,00 Cluster processes Marketing and PR 5,83 4,33 4,83 4,00 5,83 6,00 7,83 5,60 7,83 Cluster processes Internal communication 2,25 0,25 3,00 2,50 3,00 4,25 5,00 3,90 7,75 Cluster processes Knowledge and innovation shaping 6,33 2,67 5,67 3,33 4,17 3,33 4,83 4,65 6,67 Cluster processes SCORE 4,65 2,55 4,10 3,30 3,95 4,20 5,80 4,45 6,81 Cluster performance HR development 5,75 2,75 2,50 5,50 5,00 2,75 4,50 3,75 5,75 Cluster performance Improved competitive standing of the cluster (market position) 0,33 3,00 2,00 1,33 2,67 1,00 2,00 1,77 3,00 Cluster performance Improved cluster innovation 2,75 0,00 0,25 0,75 0,75 1,00 0,75 1,21 4,00 Cluster performance Internationalising 0,60 2,60 2,80 0,60 2,60 3,20 1,20 1,51 3,20 Cluster performance SCORE 2,38 2,06 1,94 2,00 2,75 2,13 2,06 2,04 3,99 Growth potential Regional conditions 2,40 5,80 7,00 6,00 7,20 7,00 7,60 6,06 8,00 Growth potential Public policy supporting cluster development 3,50 2,67 2,50 7,33 4,17 6,83 7,00 5,05 7,33 Growth potential Associated institutions 4,83 4,33 5,00 6,67 4,00 5,00 3,50 4,96 6,67 Growth potential Cluster leadership 5,75 2,75 7,25 6,25 7,25 6,50 7,25 6,44 9,00 Growth potential SCORE 4,05 3,90 5,19 6,62 5,43 6,29 6,19 5,53 7,75 Cluster strategy Economies of scale 5,60 6,40 4,20 5,80 7,00 7,20 8,80 7,12 8,80 Cluster strategy Creating knowledge and innovation network 7,00 6,00 7,83 6,67 8,50 6,00 8,17 7,00 9,50 Cluster strategy Impact on business environment 5,60 9,00 6,80 8,00 8,00 6,60 8,80 7,37 9,00 Cluster strategy SCORE 6,13 7,06 6,38 6,81 7,88 6,56 8,56 7,15 9,10
288 Values, average value and the value of benchmark for clusters comprising more than 60 entities Area Sub-area Average value Average value Cluster resources Human resources and know-how 2,17 3,50 1,67 1,83 2,83 3,83 2,90 6,83 Cluster resources Financial resources 3,67 3,33 3,00 0,67 0,67 0,00 1,80 3,67 Cluster resources Infrastructural resources 1,33 2,00 0,33 0,67 4,67 0,33 1,43 4,67 Cluster resources SCORE 2,33 3,08 1,67 1,25 2,75 2,00 2,26 4,50 Cluster processes Market activity 3,00 2,25 3,75 2,25 2,50 6,75 3,30 6,75 Cluster processes Marketing and PR 5,83 6,67 6,33 5,17 5,83 6,33 6,18 9,67 Cluster processes Internal communication 4,75 3,50 4,00 2,25 2,75 3,75 3,63 5,25 Cluster processes Knowledge and innovation shaping 4,83 4,33 5,33 2,83 6,67 3,33 5,02 7,83 Cluster processes SCORE 4,75 4,45 5,05 3,30 4,80 5,00 4,75 6,95 Cluster performance HR development 4,25 5,00 2,75 2,75 2,75 2,75 3,80 7,25 Cluster performance Improved competitive standing of the cluster (market position) 3,33 3,00 0,67 3,67 4,00 1,00 3,00 5,00 Cluster performance Improved cluster innovation 0,00 1,25 1,25 1,00 1,00 0,00 1,63 5,25 Cluster performance Internationalising 0,20 3,80 1,00 1,00 3,40 1,20 2,60 7,60 Cluster performance SCORE 1,75 3,31 1,44 1,94 2,75 1,25 2,73 5,25 Growth potential Regional conditions 5,20 6,60 4,00 5,80 7,20 5,20 5,28 7,20 Growth potential Public policy supporting cluster development 2,50 6,67 2,83 2,33 5,33 2,50 4,08 7,67 Growth potential Associated institutions 2,00 3,50 3,67 3,00 4,00 4,33 4,08 7,00 Growth potential Cluster leadership 4,75 7,25 7,75 7,00 7,00 7,00 7,00 9,50 Growth potential SCORE 3,43 5,86 4,29 4,24 5,71 4,52 4,92 7,29 Cluster strategy Economies of scale 8,20 5,80 6,60 5,20 7,20 7,40 6,64 8,20 Cluster strategy Creating knowledge and innovation network 6,67 8,50 8,67 7,00 7,67 6,67 7,30 8,67 Cluster strategy Impact on business environment 8,28 8,40 9,60 6,20 8,20 8,00 8,09 9,60 Cluster strategy SCORE 7,75 7,63 8,31 6,19 7,69 7,31 7,35 8,31
289 Values, average value and the value of benchmark for clusters comprising more than 60 entities Area Sub-area Average value Benchmark value Cluster resources Human resources and know-how 2,67 3,50 3,17 6,83 3,83 2,90 6,83 Cluster resources Financial resources 0,67 2,33 2,33 0,67 1,33 1,80 3,67 Cluster resources Infrastructural resources 0,67 0,67 0,33 3,67 3,33 1,43 4,67 Cluster resources SCORE 1,67 2,50 2,25 4,50 3,08 2,26 4,50 Cluster processes Market activity 3,50 2,00 3,00 3,00 4,00 3,30 6,75 Cluster processes Marketing and PR 4,50 6,33 5,17 7,67 9,67 6,18 9,67 Cluster processes Internal communication 2,50 5,00 3,25 5,25 4,50 3,63 5,25 Cluster processes Knowledge and innovation shaping 4,00 6,83 4,17 6,33 7,83 5,02 7,83 Cluster processes SCORE 3,75 5,35 4,05 5,85 6,95 4,75 6,95 Cluster performance HR development 2,25 7,25 5,00 4,50 3,25 3,80 7,25 Cluster performance Improved competitive standing of the cluster (market position) 2,67 4,67 2,00 2,33 5,00 3,00 5,00 Cluster performance Improved cluster innovation 2,25 5,25 1,50 3,00 2,75 1,63 5,25 Cluster performance Internationalising 2,20 4,00 1,60 7,00 7,60 2,60 7,60 Cluster performance SCORE 2,31 5,25 2,50 4,50 4,81 2,73 5,25 Growth potential Regional conditions 3,00 5,20 3,60 6,60 7,00 5,28 7,20 Growth potential Public policy supporting cluster development 1,33 5,17 4,50 6,83 7,67 4,08 7,67 Growth potential Associated institutions 3,00 7,00 4,17 5,00 6,17 4,08 7,00 Growth potential Cluster leadership 2,75 9,50 8,25 7,50 8,75 7,00 9,50 Growth potential SCORE 2,48 6,52 4,90 6,38 7,29 4,92 7,29 Cluster strategy Economies of scale 6,40 7,40 6,00 5,20 6,20 6,64 8,20 Cluster strategy Creating knowledge and innovation network 5,50 8,00 7,17 4,83 7,17 7,30 8,67 Cluster strategy Impact on business environment 7,40 9,60 7,60 7,20 7,60 8,09 9,60 Cluster strategy SCORE 6,38 8,31 6,94 5,69 7,00 7,35 8,31
290 Polish Agency for Enterprise Development (PAED) is a government agency operating under the auspices of the Ministry of Economy. It was established under the Act of 9 November The aim of the Agency is to manage national and EU funds intended for supporting business and innovation as well as human resources development. The Agency, which in 2010 celebrates its 10th anniversary, was established in order to implement economic development programmes supporting innovation and research activities of the SMEs, as well as to support regional development, exports increase, human resources development and the use of new technologies. In the financial perspective, the Agency is responsible for implementing measures under three operational programmes: Innovative Economy, Human Capital and Development of Eastern Poland. One of the Agency s priorities is to promote innovative attitudes and encourage entrepreneurs to apply modern technologies in their businesses. To this end Polish Agency for Enterprise Development runs a website devoted to innovation and organises a Polish Product of the Future competition every year. SME representatives can participate in cyclical meetings of the Innovative Enterprises Club. The aim of the PAED Academy educational website ( is to provide micro, small and mediumsized enterprises with access to business knowledge in the form of e-learning. Through web.gov.pl PAED supports the development of e-business. Enterprise Europe Network centre operates within PAED, offering entrepreneurs information on European Union law and the rules of conducting business activity on the common market. PAED initiated the creation of networks of regional SMEs support centres, i.e. the National SME Services Network, National Innovation Network and Consultation Centres. These institutions offer information, consulting, training and financial services, free of charge or at preferential rates. Regional Financing Institutions (RFIs) are PAED s regional partners in the implementation of selected measures. Polish Agency for Enterprise Development ul. Pańska 81/83, Warszawa tel , fax: [email protected], PAED Information Point tel [email protected]
Polish Agency for Enterprise Development
 2012 Polish Agency for Enterprise Development We support good governance Management is an imposition of order on chaos Henry M. Boettinger The Polish Agency for Enterprise Development (PARP) is a state
grants for innovation Grants for innovation
 grants for innovation Grants for innovation Innovative Economy, 2007-2013 The Operational Programme Innovative Economy, 2007-2013 (OP IE) is one of the six National Strategic Reference Framework programmes
ELEFTHO : Supporting Business Incubators & technology parks.
 ELEFTHO : Supporting Business Incubators & technology parks. Region of Central Macedonia Task Page 1 of 14 Contents Description of policy... 3 Name of the policy... 3 Responsible body... 3 Implementation
AUTHORS: Dr. Aleksander BĄKOWSKI (editing) Marzena MAŻEWSKA (editing)
 Marzena MAŻEWSKA (editing)") 1 AUTHORS: Dr. Aleksander BĄKOWSKI (editing) Marzena MAŻEWSKA (editing) Elwira KOPROWSKA-SKALSKA Jacek KOTRA Dr. Karol LITYŃSKI Marek MIKA Ewa POPIELCZAK Dr. Andrzej SIEMASZKO Małgorzata SNARSKA-ŚWIDERSKA
1 AUTHORS: Dr. Aleksander BĄKOWSKI (editing) Marzena MAŻEWSKA (editing) Elwira KOPROWSKA-SKALSKA Jacek KOTRA Dr. Karol LITYŃSKI Marek MIKA Ewa POPIELCZAK Dr. Andrzej SIEMASZKO Małgorzata SNARSKA-ŚWIDERSKA
R&D Expenditures in Poland. Voivodship Perspective
 Barometr Regionalny Tom 12 nr 2 R&D Expenditures in Poland. Voivodship Perspective Aleksandra Zygmunt Opole University of Technology, Poland Abstract The main purpose of the paper is R&D expenditures analysis
European Investment Bank Handbook for Beneficiaries JESSICA Projects eligible under Measure 1.6 of the Regional Operational Programme of
 www.pwc.com 20 September 2012 European Investment Bank Handbook for Beneficiaries JESSICA Projects eligible under Measure 1.6 of the Regional Operational Programme of Mazowieckie Voivodeship 2007-2013
Project co - financed by the European Union from the European Social Fund within the Human Capital Operational Program 2007-2013
 Project co - financed by the European Union from the European Social Fund within the Human Capital Operational Program 2007-2013 The global economy evolves into a knowledge-based economy, where market
DETAILED DESCRIPTION OF THE PRIORITIES OF HUMAN CAPITAL OPERATIONAL PROGRAMME 2007-2013
 DETAILED DESCRIPTION OF THE PRIORITIES OF HUMAN CAPITAL OPERATIONAL PROGRAMME 2007-2013 Warsaw, 1 June 2009 LIST OF CONTENTS I. Information on the human capital operational programme... 8 1. Status of
POLISH INFORMATION AND FOREIGN INVESTMENT AGENCY R&D SECTOR IN POLAND
 POLISH INFORMATION AND FOREIGN INVESTMENT AGENCY Foto: AA+W Fotolia.com R&D SECTOR IN POLAND The R&D sector in Poland characteristics and possibilities of support Characteristics of the Polish economy
COMMUNICATION PLAN FOR THE OPERATIONAL PROGRAMME INNOVATIVE ECONOMY 2007 2013
 COMMUNICATION PLAN FOR THE OPERATIONAL PROGRAMME INNOVATIVE ECONOMY 2007 2013 June 2008 TABLE OF CONTENTS Abbreviations used in the OP IE 2007 2013 Communication plan 1 Terms used in the OP IE 2007 2013
EVALUATION GUIDELINES
 EVALUATION GUIDELINES Introduction This document outlines the reviewing process and defines the responsibilities of the participants in the process. It details a number of important issues, such as: FCT
Priority axis II SUPPORT FOR THE ENVIRONMENT AND CAPACITY OF ENTERPRISE FOR R&D&I ACTIVITY... 53
 Table of contents 1. STRATEGY FOR THE OPERATIONAL PROGRAMME S CONTRIBUTION TO THE UNION STRATEGY FOR SMART, SUSTAINABLE AND INCLUSIVE GROWTH AND TO THE ACHIEVEMENT OF ECONOMIC, SOCIAL AND TERRITORIAL COHESION...
Theoretical Basis for Geodesic Clusters
 GEOMATICS AND ENVIRONMENTAL ENGINEERING Volume 5 Number 2 2011 Janusz D¹browski* Theoretical Basis for Geodesic Clusters 1. Introduction In April 2006 in Rzeszow, then the Head of Podkarpackie Province
Fig. 1: Nascent Entrepreneurs in 22 innovation-driven GEM countries 2010
 Executive Summary This is the summary of the eleventh German Country Report for the Global Entrepreneurship Monitor (GEM). The GEM is an international research program which was initiated by London Business
About the OECD Tourism Committee
 Updated: July 2016 The Organisation for Economic Co-operation and Development (OECD) provides a forum in which governments can work together to share experiences and seek solutions to common problems.
How To Create A Successful Economy
 INTERNATIONAL IMP³ROVE ROUNDTABLE: FOSTERING COHESION WITH INNOVATION Düsseldorf, 25 November 2015 Christian SAUBLENS IN EUROPE, THE EU COMMISSION PROMOTES THE CONCEPT OF RESEARCH AND INNOVATION STRATEGIES
POLISH INFORMATION AND FOREIGN INVESTMENT AGENCY INFORMATION TECHNOLOGY SECTOR IN POLAND
 POLISH INFORMATION AND FOREIGN INVESTMENT AGENCY Foto: Alexander Raths Fotolia.com INFORMATION TECHNOLOGY SECTOR IN POLAND IT Sector worldwide There are several trends which may be observed on the global
World Tourism Organization RECOMMENDATIONS TO GOVERNMENTS FOR SUPPORTING AND/OR ESTABLISHING NATIONAL CERTIFICATION SYSTEMS FOR SUSTAINABLE TOURISM
 World Tourism Organization RECOMMENDATIONS TO GOVERNMENTS FOR SUPPORTING AND/OR ESTABLISHING NATIONAL CERTIFICATION SYSTEMS FOR SUSTAINABLE TOURISM Introduction Certification systems for sustainable tourism
EXCELLENCE AND DYNAMISM. University of Jyväskylä 2017
 EXCELLENCE AND DYNAMISM University of Jyväskylä 2017 Approved at the University Board Meeting of 25 March 2010 FOREWORD The compilation of a University Strategy extending until 2017 could hardly have
SME support under Horizon 2020 how to make it work
 SME support under Horizon 2020 how to make it work Olivier Brunet Unit Regional dimension of innovation Directorate General Research &Innovation European Commission The Multiannual Financial Framework
UNIVERSITY-LEVEL ENTREPRENEURSHIP EDUCATION IN POLAND. Prof. Jerzy Cieslik, Leon Kozminski Academy of Entrepreneurship and Management, Warsaw, Poland
 UNIVERSITY-LEVEL ENTREPRENEURSHIP EDUCATION IN POLAND Prof. Jerzy Cieslik, Leon Kozminski Academy of Entrepreneurship and Management, Warsaw, Poland ABSTRACT This paper outlines Polish experiences in fostering
 UPC International Relations Plan 2003-2006 Servei de Comunicació Institucional de la UPC, 2003 (7077) Contents Introduction Teaching Subsection 1: The European Higher Education Area Subsection 2: The internationalisation
Visegrad 4 Ukraine: SME Development Visegrad experience for Ukrainian government & business. V4 Road Show in Ukraine
 Visegrad 4 Ukraine: SME Development Visegrad experience for Ukrainian government & business V4 Road Show in Ukraine Vinnitsia, April 13, 2016 Science & Industrial Park World trend and Polish experience:
Dr. Justyna Adamska, - Head of Promotion and Development Department in Poznan Science and Technology Park, Poland
 Dr. Justyna Adamska, - Head of Promotion and Development Department in Poznan Science and Technology Park, Poland How to become local Silicon Valley - is STPs branding noteworthy, innovative and memorable?
Chapter 6. Financing of innovative entrepreneurs
 Chapter 6. Financing of innovative entrepreneurs Ukraine has entrepreneurial talent and a relatively strong risk-taking attitude. These are major ingredients for any policy intervention seeking to promote
TRAINING NEEDS IN CONSTRUCTION PROJECT MANAGEMENT IN PORTUGAL
 INTERNATIONAL CONGRESS ON PROJECT ENGINEERING VALENCIA, September 13-15, 2006 TRAINING NEEDS IN CONSTRUCTION PROJECT MANAGEMENT IN PORTUGAL J. C. Teixeira (s), B. R. Pires Abstract Training in construction
EUROPEAN COMMISSION. Call for Expressions of Interest
 EUROPEAN COMMISSION Executive Agency for Small and Medium-sized Enterprises (EASME) Call for Expressions of Interest 'Business Cooperation Centres' in third countries for the Enterprise Europe Network
EQUILIBRIUM MODERN APPROACH TO ORGANIZATIONAL RESOURCES BASED ON THE EXAMPLE. Rafał Kućmański Warsaw University of Life Sciences SGGW, Poland
 EQUILIBRIUM Quarterly Journal of Economics and Economic Policy VOLUME 7 ISSUE 1, 2012 ISSN 1689-765X Rafał Kućmański Warsaw University of Life Sciences SGGW, Poland MODERN APPROACH TO ORGANIZATIONAL RESOURCES
2InS Clusters Integrated Management System and Code of Ethics
 2InS Clusters Integrated Management System and Code of Ethics Action 3.3: Design- development of the Management/Operations Tools of the Innovation and Internationalization Clusters (2InS Clusters) and
Annual Report 2007 COMMERCIAL FINANCE WWW.INGCOMFIN.PL
 2007 Annual Report 2007 COMMERCIAL FINANCE WWW.INGCOMFIN.PL It is with pleasure that I present to you the Annual Report of 2007 which describes the activity of ING Commercial Finance Polska S.A. Last year
Effectiveness of the South Baltic Cross-border Co-operation Programme 2007-2013; challenges and aims for the Programme for the time period 2014-2020
 Effectiveness of the South Baltic Cross-border Co-operation Programme 2007-2013; challenges and aims for the Programme for the time period 2014-2020 Final report ECORYS Polska Sp. z o.o. Łucka 2/4/6 00-845
Joining forces in policy issues in open, online and flexible education
 Joining forces in policy issues in open, online and flexible education Local seminar Finnish Online UAS 30 November - Jyväskylä Joining forces in open, online and flexible education Characteristics of
Cohesion Policy funding opportunities for community energy initiatives in Central and Eastern Europe
 Community energy across Europe - making it happen Cohesion Policy funding opportunities for community energy initiatives in Central and Eastern Europe Markus Trilling CEE Bankwatch Network Brussels 6 October
CLUSTER MANAGEMENT EXCELLENCE IN GERMANY
 CLUSTER MANAGEMENT EXCELLENCE IN GERMANY German clusters compared with European peers Sophie Hantsch Helmut Kergel Thomas Lämmer-Gamp Gerd Meier zu Köcker Michael Nerger IMPRINT European Secretariat for
www.civitas.edu.pl/english
 www.civitas.edu.pl/english Admissions Office address: Palace of Culture and Science, 12th floor Plac Defilad 1 00-901 Warsaw, Poland tel: (48) (22) 656 71 89 fax: (48) (22) 656 71 75 e-mail: [email protected]
Report on the public consultation on the New SME Policy
 Report on the public consultation on the New SME Policy 1. Introduction In September 2014, the European Commission launched a public consultation to gather feed-back and ideas on how the Small Business
WARSAW SCHOOL OF ECONOMICS
 WARSAW SCHOOL OF ECONOMICS mgr Ewelina Florczak The summary of doctoral dissertation THE TITLE SOCIAL ENTERPRISE IN LOCAL ENVIRONMENT 1 Rationale topic A social enterprise as a business entity is subject
THE LITHUANIAN INNOVATION DEVELOPMENT PROGRAMME 2014 2020 I. INTRODUCTION
 APPROVED by Resolution No 1281 of the Government of the Republic of Lithuania of 18 December 2013 THE LITHUANIAN INNOVATION DEVELOPMENT PROGRAMME 2014 2020 I. INTRODUCTION 1. The Lithuanian Innovation
ABB in Poland Always at the forefront
 ABB in Poland Always at the forefront 2 ABB in Poland ABB in Poland is a part of the ABB Group a global leader in power and automation technologies that enable utility and industry customers to improve
Bulgarian Innovation Policy: Options for the Next Decade
 Bulgarian Innovation Policy: Options for the Next Decade The political changes in the EU the entry into force of the Treaty of Lisbon, the new composition of EU institutions, as well as the development
Annex 1: Conceptual Framework of the Swiss-Polish Cooperation Programme
 Annex 1: Conceptual Framework of the Swiss-Polish Cooperation Programme The Conceptual Framework is an integral part of the Framework Agreement between the Swiss Federal Council and the Government of the
About the OECD Tourism Committee
 Updated: March 2015 The Organisation for Economic Co-operation and Development (OECD) provides a forum in which governments can work together to share experiences and seek solutions to common problems.
The University of Texas at Austin - Portugal An international partnership in graduate education, research, and technology commercialization
 The University of Texas at Austin - Portugal An international partnership in graduate education, research, and technology commercialization Technical Appendix to the Memorandum of Understanding toward
Regional innovation strategies
 OECD Innovation Policy Platform /policyplatform Regional innovation strategies Regional innovation strategies are systematic, goal-oriented exercises carried out by regional partnerships with the aim to
The regional variation of foreign direct investment in Poland
 Scientific Journal Warsaw University of Life Sciences SGGW Problems of World Agriculture volume 14 (XXIX), number 4, 2014: 83 91 Elżbieta Kacperska 1 Department of Agricultural Economics and International
European Cluster Excellence Scoreboard
 European Cluster Observatory European Cluster Excellence Scoreboard Pilot Version September 0 Enterprise and Industry The views expressed in this report, as well as the information included in it, do not
Ministry of Regional Development
 MRR/POIG/1(3)/04/2009 Ministry of Regional Development National Strategic Reference Framework 2007-2013 Guidelines concerning eligibility of expenditure under the Operational Programme Innovative Economy
Industrial Policy Strategy
 Industrial Policy Strategy - Case Study Slovenia TAIEX Seminar on Industrial Policy Belgrade, February 4, 2011 Mag. Mateja Mešl Diploma in Sociology, Masters in Regional and Urban Planning Mag.Mateja Mešl
EUROPLAT European Network for Psychology Learning & Teaching
 EUROPLAT European Network for Psychology Learning & Teaching Progress Report Public Part 155981-LLP-1-2009-UK-ERASMUS-ENWA Project information Project acronym: Project title: Project number: Sub-programme
Emerging Modes of Cooperation between Private Enterprises and Universities
 Grant agreement no.: 2012-2948/001-001 Emerging Modes of Cooperation between Private Enterprises and Universities National Report of Bulgaria (draft version) This project has been funded with support from
Finland must take a leap towards new innovations
 Finland must take a leap towards new innovations Innovation Policy Guidelines up to 2015 Summary Finland must take a leap towards new innovations Innovation Policy Guidelines up to 2015 Summary 3 Foreword
Position Paper. April 2012
 Position Paper April 2012 On draft Regulation of the European Parliament and of the Council establishing a Programme for the Competitiveness of Enterprises and small and medium-sized enterprises (2014-2020)
9 ACCESS TO CAPITAL FOR YORK REGION SMALL BUSINESSES
 9 ACCESS TO CAPITAL FOR YORK REGION SMALL BUSINESSES The Planning and Economic Development Committee recommends the adoption of the recommendation contained in the following report dated May 19, 2009,
Towards Innovative Economy
 Towards Innovative Economy Effects of Grants to Enterprises in Poland edited by Jacek Pokorski Towards Innovative Economy Effects of Grants to Enterprises in Poland edited by Jacek Pokorski This publication
2015 SBA Fact Sheet Montenegro
 2015 SBA Fact Sheet Montenegro Key points Implementing the Small Business Act for Europe (SBA): The SBA profile of Montenegro presents a rather positive picture. Several principles score above the EU average,
Sustainability & Transferability Plan
 QUALOBSTER SUSTAINABILITY & TRANSFERABILITY PLAN Qualobster Quality Assurance in Learning Organisation in the Banking and Financial Sector in Europe LU/07/LLP-LdV/TOI/156005 Sustainability & Transferability
Research Infrastructures in Horizon 2020
 Research Infrastructures in Horizon 2020 Philippe Froissard Deputy Head of Unit - Research Infrastructures European Commission DG Research & Innovation Research Infrastructures Research infrastructures
Decision PC.2/dc.1 on the Interim Work Programme 2009/2010
 PREPARATORY COMMISSION FOR THE INTERNATIONAL RENEWABLE ENERGY AGENCY Annex 8: Decision on the Interim Work Programme 2009/2010 Report Annex 7 Second session Monday, 29 June 2009 Sharm El Sheikh International
How To Become A Successful International Business Manager
 FACULTY OF MANAGEMENT New Faculty UNIVERSITY OF ECONOMICS International Business Bachelor and Master program Agenda 1. Piece of History 2. Inspirations and patterns 3. International Business Program 4.
COMMISSION OF THE EUROPEAN COMMUNITIES. Proposal for a RECOMMENDATION OF THE COUNCIL AND OF THE EUROPEAN PARLIAMENT
 COMMISSION OF THE EUROPEAN COMMUNITIES Brussels, 12.10.2004 COM(2004) 642 final 2004/0239 (COD) Proposal for a RECOMMENDATION OF THE COUNCIL AND OF THE EUROPEAN PARLIAMENT on further European cooperation
Guide to Public and Private Funding
 Guide to Public and Private Funding Introduction to public and private funding Key Public Funding Opportunities Key Private Funding Opportunities Which funding opportunity is right for my business? Do
PROPOSAL ACRONYM - ETN / EID / EJD (delete as appropriate and include as header on each page) START PAGE MARIE SKŁODOWSKA-CURIE ACTIONS
 START PAGE MARIE SKŁODOWSKA-CURIE ACTIONS") START PAGE MARIE SKŁODOWSKA-CURIE ACTIONS Innovative Training Networks (ITN) Call: H2020-MSCA-ITN-2015 PART B PROPOSAL ACRONYM This proposal is to be evaluated as: [ETN] [EID] [EJD] [delete as appropriate]
START PAGE MARIE SKŁODOWSKA-CURIE ACTIONS Innovative Training Networks (ITN) Call: H2020-MSCA-ITN-2015 PART B PROPOSAL ACRONYM This proposal is to be evaluated as: [ETN] [EID] [EJD] [delete as appropriate]
WELCOME AMONG OUTSOURCING EXPERTS
 DISCOVER OEX WELCOME AMONG OUTSOURCING EXPERTS The Outsourcing Experts Inc. (OEX) Capital Group was established as a result of the biggest merger on the market of business process outsourcing in Poland.
B04 Business Support Services in Hanse Passage regions
 B04 Business Support Services in Hanse Passage regions BUILDING NETWORKS AND EXCHANGING EXPERIENCE BETWEEN EUROPEAN REGIONS Introduction Creating the right environment for businesses to flourish is a central
Contribution of Professional Training to Graduate Entrepreneurship Development
 Let s join our strengths together! ECQA Conference 2010 Contribution of Professional Training to Graduate Entrepreneurship Development Dr. Kerstin Siakas, Associate Professor Alexander Technological Educational
1.1. Do the outputs of the Network and Centres contribute to enhancing mobility and awareness of the European dimension in guidance and counselling?
 EXECUTIVE SUMMARY 1. Evaluation task and methods The external evaluation of the Euroguidance Network (National Resource Centres for Vocational Guidance, NRCVG) had a two-fold task: 1) to assess the performance
XI INTERNATIONAL SYMPOSIUM INTELLECTUAL PROPERTY IN INNOVATIVE ECONOMY
 XI INTERNATIONAL SYMPOSIUM INTELLECTUAL PROPERTY IN INNOVATIVE ECONOMY RESEARCH-BUSINESS-PROFIT-GROWTH: FOSTERING A THRIVING INNOVATION ECOSYSTEM 3-4 SEPTEMBER 2015 INTERNATIONAL CULTURAL CENTRE RYNEK
ENTREPRENEURSHIP, BUSINESS ANGELS, GRANTS AND GOVERNMENT FUNDS TO ENTREPRENEURSHIP AND ECONOMIC DEVELOPMENT
 EXECUTIVE PAPERS ENTREPRENEURSHIP, BUSINESS ANGELS, GRANTS AND GOVERNMENT FUNDS TO ENTREPRENEURSHIP AND ECONOMIC DEVELOPMENT PRUDENTE, JAIME Instituto de Apoio às Pequenas e Médias empresas e à Inovação
3. What is Incubation?
 In reality both approaches have their place and need to be balanced in identifying the impacts achieved by public policy initiatives and learning how to improve them. This theme will surface again in the
PERIODICAL EVALUATION AND FUNDING OF FCT R&D UNITS - Review Panels Stage 2 - Final Meeting Guidelines
 PERIODICAL EVALUATION AND FUNDING OF FCT R&D UNITS - Review Panels Stage 2 - Final Meeting Guidelines 19/11/2014 1 CONTENTS Evaluation Structure - Panels... 3 Inputs... 3 Review Panel meetings (November
The First Transport Innovations Forum - Best practices for sustainable development
 Conference cofinanced from European Funds - Technical Assistance Operational Program The First Transport Innovations Forum - Best practices for sustainable development LIST OF CONTENT 1 ASSUMPTIONS FOR
programme and its use on Pre-Commercial Procurement of Innovation
 New structural funds programme and its use on Pre-Commercial Procurement and Public Procurement of Innovation PUBLIC DEMAND OF INNOVATION FOR: Efficient Public Services and Competitive European Industries
What you always wanted to know, and never dare to ask about European Funding!
 What you always wanted to know, and never dare to ask about European Funding! WBII Women Business Initiative International Carlton Hotel, Den Haag 26 th June 2014 Severina Scarnecchia - EU Government Affairs
QUALITY IN EVERYDAY WORK. Quality Guide for the Teacher Education College Version 2.7
 QUALITY IN EVERYDAY WORK Quality Guide for the Teacher Education College Version 2.7 Updates: Organisational change 1.1.2009 JAMK s mission and vision 5.1.2010 Planning and development discussion practices
COMMISSION IMPLEMENTING DECISION. of 26.11.2012
 EUROPEAN COMMISSION Brussels, 26.11.2012 C(2012) 8548 final COMMISSION IMPLEMENTING DECISION of 26.11.2012 Implementing Regulation (EU) No 492/2011 of the European Parliament and of the Council as regards
REQUEST FOR QUOTATION No. 34/2013 Date of issuance: 13.12.2013. Training courses may be conducted in English or Polish.
 REQUEST FOR QUOTATION No. 34/2013 Date of issuance: 13.12.2013 The Foundation for Polish Science runs the SKILLS project, cofounded by the European Union within the European Social Fund (The Operational
ANALYSIS OF THE STAKEHOLDER CONSULTATION ON
 ANALYSIS OF THE STAKEHOLDER CONSULTATION ON Science and Technology, the key to Europe s future: guidelines for future European policy to support research COM(353)2004 DG Research, European Commission,
Financing innovation. Operational Programme Enterprise and Innovation for Competitiveness 2014-2020: Ing. Marcela Příhodová EU Funds Section, MIT
 Operational Programme Enterprise and Innovation for Competitiveness 2014-2020: Financing innovation Ing. Marcela Příhodová EU Funds Section, MIT 19. května 2014, Ostrava 14 October 2014, Prague Operational
3.2.2 National cluster management concepts
 2CE132P1 - CNCB 3.2.2 National cluster management concepts Work Package WP3 Cluster management Action 3.2.2 Author PP08 + PP09 - Elena Stieranková, Peter Filo Version Date 2.11.2011 Status final version
RECOMMENDATIONS ON BUSINESS PLAN PREPARATION
 RECOMMENDATIONS ON BUSINESS PLAN PREPARATION 1. General provisions Business plan must contain: name of the investment project, as well description of its essence and feasibility; substantiation of the