How SAP Business Objects Dashboards Are Improving Decision Making at Caterpillar Parts Distribution
|
|
|
- Edwin Barton
- 10 years ago
- Views:
Transcription
1 How SAP Business Objects Dashboards Are Improving Decision Making at Caterpillar Parts Distribution Greg Lauer & John Buckhold Caterpillar Inc. SESSION CODE: 0705

2 DASHBOARDS Dashboards at Cat Parts Distribution Changing the Way We Ask Business Questions It s All About the Metrics Information Driving Action


3 DASHBOARDS FIRST From To
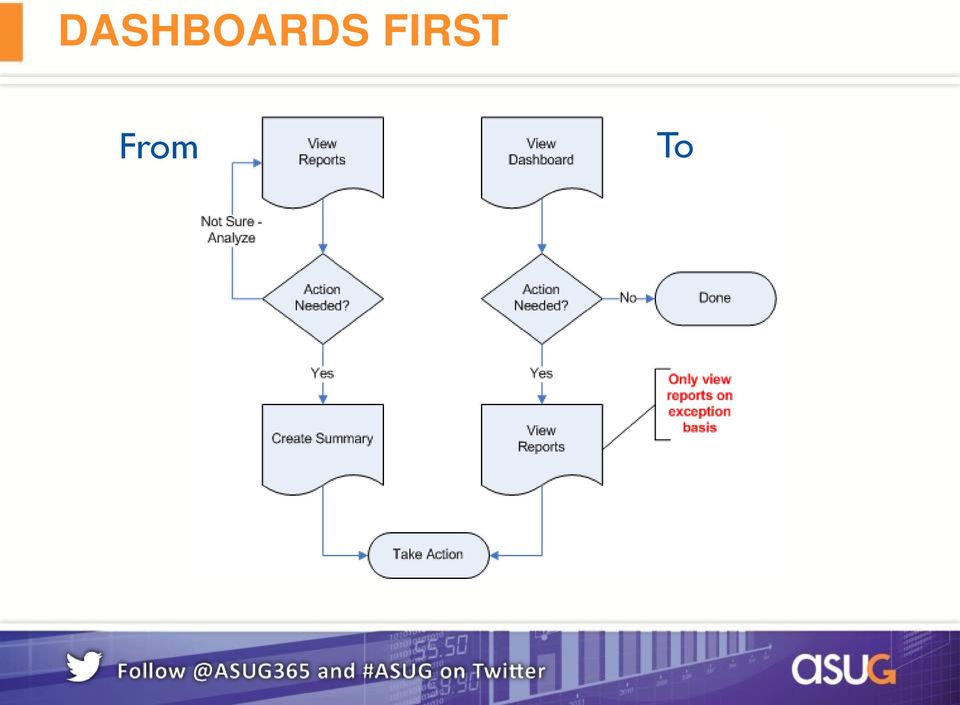


4 DASHBOARDS FIRST Facility Health Warehouse capacity Cascade from network level view Drill down and drill thru to lower level dashboards & reports

5 EXAMPLE FACILITY HEALTH Facility Health Warehouse capacity Dashboard used in strategic planning and review Operations engineers aligned with central leadership view of the network Less time gathering/maintaining data and more time for analysis

6 IT S ALL ABOUT THE METRICS Dashboard development priority based on impact to key performance metrics Using dashboards to align those who execute processes with performance targets Dashboards helping to refine the supply chain metrics continuous improvement


7 IT S ALL ABOUT THE METRICS Drill down to associate level metric performance

8 EXAMPLE - PRODUCTIVITY Network productivity monitoring for all leadership levels Dashboard rollout facilitating central planning group to work with operations to engineer productivity improvement solutions Dashboard rollout led to analysis that challenged assumption about source of variation in productivity metric (ie within facility versus among facilities)


9 EXAMPLE - PRODUCTIVITY Productivity dashboard rollout leading us to think about future cost management metrics Dashboard use cases have grown from 8 pilot to 60+ in production or in the queue

10 INFORMATION DRIVING ACTION Network velocity monitoring for lead time analysis More efficient and potentially more accurate process for monitoring and maintaining inventory levels Visualization through dashboards supports goal of aligning owners of supply chain segment owners with overall supply chain velocity monitoring

11 EXAMPLE - VELOCITY From user programming and spreadsheet output.


12 EXAMPLE - VELOCITY To visualization of cycle time


13 EXAMPLE - VELOCITY To visualization of trend analysis

14 A CASE FOR MOBILITY Audit tracking in warehouse operations Dashboards part of potential use of tablets for applications/warehouse management system Opportunity to apply use of mobile technology to speed decision making and reduce administrative tasks


15 A CASE FOR MOBILITY

16 WHAT WE LEARNED Standard approach for monitoring business processes Governance Standards Levels the playing field for access to information by centralizing the development of business intelligence Encourages sharing of expertise Research and development of new business questions Dashboards versus Scorecards Leverage Power of the Data Warehouse


17 GOVERNANCE Starts with standard development process Prioritized through central business council

18 STANDARDS Standard template for branding, confidentiality and consistent color scheme Standards enforced at time of publish to portal

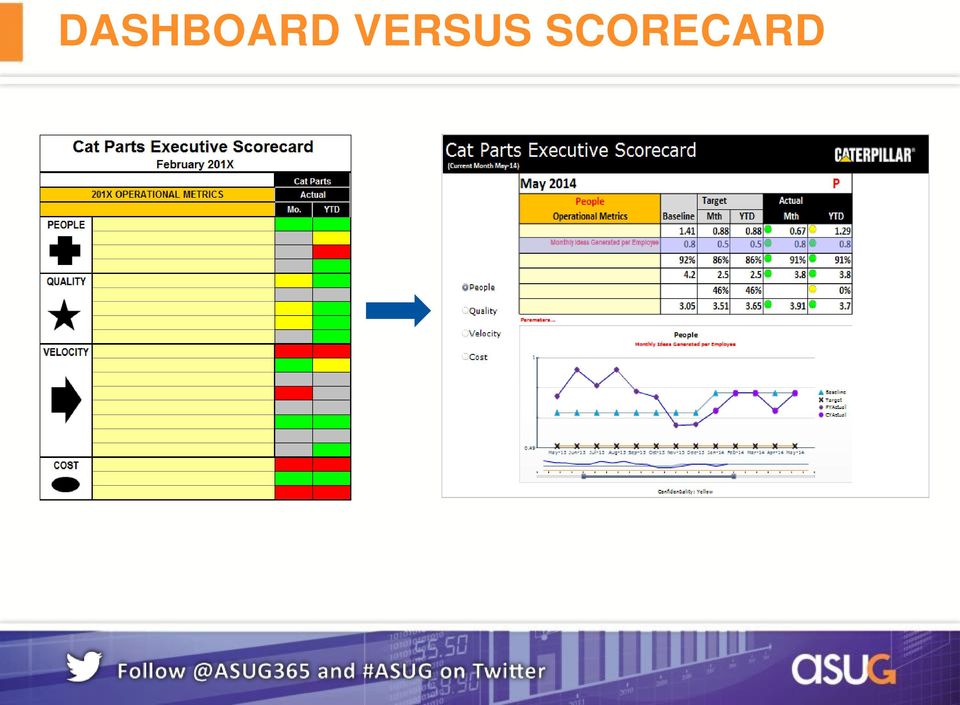
19 DASHBOARD VERSUS SCORECARD There are differences. Target audience Freshness of data Strategic goal tracking vs point in time monitoring Degree of interactivity But the differences seem to be blurring Used together in some instances Place for both Both intended to drive performance improvement As suggested by Kipfolio.com


20 DASHBOARD VERSUS SCORECARD
21 WHAT WE LEARNED Dashboards Help us see our supply chain Engages us to ask business questions in a new way Reinforces our focus on the metrics Aligns process owners with supply chain goals Converts data to information Converts information to value BObj - Easy to learn and rapid deployment
22 THANK YOU FOR PARTICIPATING Please provide feedback on this session by completing a short survey via the event mobile application. SESSION CODE: 0705 For ongoing education on this area of focus, visit
Using SAP Master Data Technologies to Enable Key Business Capabilities in Johnson & Johnson Consumer
 Using SAP Master Data Technologies to Enable Key Business Capabilities in Johnson & Johnson Consumer Terry Bouziotis: Director, IT Enterprise Master Data Management JJHCS Bob Delp: Sr. MDM Program Manager
QPR Performance Management
 QPR Performance Management Improve Business Performance with Intelligence and Collaboration QPR Performance Management: Strategy, Intelligence and Collaboration QPR Performance Management Improving your
Explore the Possibilities
 Explore the Possibilities 2013 HR Service Delivery Forum Best Practices in Data Management: Creating a Sustainable and Robust Repository for Reporting and Insights 2013 Towers Watson. All rights reserved.
Business Intelligence: Real ROI Using the Microsoft Business Intelligence Platform. April 6th, 2006
 Business Intelligence: Real ROI Using the Microsoft Business Intelligence Platform April 6th, 2006 Agenda Introduction Background Business Goals Microsoft Business Intelligence Platform Examples Conclusions
Overview, Goals, & Introductions
 Improving the Retail Experience with Predictive Analytics www.spss.com/perspectives Overview, Goals, & Introductions Goal: To present the Retail Business Maturity Model Equip you with a plan of attack
Building for the future
 Building for the future Why predictive analytics matter now William Gaker Goals for today Growth and establishment of the people analytics field Best practices for building a people analytics function
ON Semiconductor identified the following critical needs for its solution:
 Microsoft Business Intelligence Microsoft Office Business Scorecards Accelerator Case study Harnesses the Power of Business Intelligence to Drive Success Execution excellence is an imperative in order
Achieve More from your ERP using QlikView Business Intelligence
 Achieve More from your ERP using QlikView Business Intelligence White Paper April 2014 Introduction With more and more organizations realizing the need for Business Intelligence applications to help the
RedPrairie for Convenience Retail. Providing Consistency and Visibility at Least Cost
 RedPrairie for Convenience Retail Providing Consistency and Visibility at Least Cost The Convenience Store Challenge With blurring lines between retail segments, Convenience Store chains are faced with
ANALYTICS. Acxiom Marketing Maturity Model CheckPoint. Are you where you want to be? Or do you need to advance your analytics capabilities?
 ANALYTICS Analytics defined Analytics is the process of studying data to identify potential trends, evaluate decisions, or assess the performance of a tool, event, or scenario. The process should include
ElegantJ BI. White Paper. Key Performance Indicators (KPI) A Critical Component of Enterprise Business Intelligence (BI)
 A Critical Component of Enterprise Business Intelligence (BI)") ElegantJ BI White Paper Key Performance Indicators (KPI) A Critical Component of Enterprise Business Intelligence (BI) Integrated Business Intelligence and Reporting for Performance Management, Operational
ElegantJ BI White Paper Key Performance Indicators (KPI) A Critical Component of Enterprise Business Intelligence (BI) Integrated Business Intelligence and Reporting for Performance Management, Operational
SAP Manufacturing Intelligence By John Kong 26 June 2015
 SAP Manufacturing Intelligence By John Kong 26 June 2015 Agenda Registration Next Generation of SAP Solution for Manufacturing Tea Break SAP Business Analytics Solutions for Manufacturing - Dashboard Design
BUSINESS INTELLIGENCE
 BUSINESS INTELLIGENCE Enabling Insights Across the Enterprise Patrick Callahan AST Corporation Practice Director Business Intelligence Naperville, Illinois USA 2011 Southern California Public Sector EBS
Automated Financial Reporting (AFR) Version 4.0 Highlights
 Version 4.0 Highlights") Automated Financial Reporting (AFR) Version 4.0 Highlights Why Do 65% of North American CAT Dealers Use AFR? Without formal training, our CFO conducted quarterly statement reviews with all of our operating
Automated Financial Reporting (AFR) Version 4.0 Highlights Why Do 65% of North American CAT Dealers Use AFR? Without formal training, our CFO conducted quarterly statement reviews with all of our operating
Automating FP&A Analytics Using SAP Visual Intelligence and Predictive Analysis
 September 9 11, 2013 Anaheim, California Automating FP&A Analytics Using SAP Visual Intelligence and Predictive Analysis Varun Kumar Learning Points Create management insight tool using SAP Visual Intelligence
Creating an Enterprise Reporting Bus with SAP BusinessObjects
 September 10-13, 2012 Orlando, Florida Creating an Enterprise Reporting Bus with SAP BusinessObjects Kevin McManus LaunchWorks Session : 0313 Learning Points By consolidating people, process, data and
DITA Adoption Process: Roles, Responsibilities, and Skills
 DITA Adoption Process: Roles, Responsibilities, and Skills Contents 2 Contents DITA Adoption Process: Roles, Responsibilities, and Skills... 3 Investigation Phase... 3 Selling Phase...4 Pilot Phase...5
TLS013. Supply Chain Key Performance Indicators (KPIs) and Performance Measurement Ehap Sabri, PhD, CFPIM
 and Performance Measurement Ehap Sabri, PhD, CFPIM") TLS013 Supply Chain Key Performance Indicators (KPIs) and Performance Measurement Ehap Sabri, PhD, CFPIM Agenda What is KPI? Performance Measurement Challenges Performance Measurement Framework Best practices
TLS013 Supply Chain Key Performance Indicators (KPIs) and Performance Measurement Ehap Sabri, PhD, CFPIM Agenda What is KPI? Performance Measurement Challenges Performance Measurement Framework Best practices
How Do I Choose my KPIs?
 Best Practices in Dashboard Design Building a Dashboard System What tasks are involved in building the system? Building a Dashboard System What tasks are involved in building the system? Design Implementation
Accelerate Business Intelligence Adoption with Interactive, Mobile Dashboards
 SAP Brief SAP BusinessObjects Business Intelligence s SAP BusinessObjects Dashboards Objectives Accelerate Business Intelligence Adoption with Interactive, Mobile Dashboards Create high-impact, interactive
Measure Your Data and Achieve Information Governance Excellence
 SAP Brief SAP s for Enterprise Information Management SAP Information Steward Objectives Measure Your Data and Achieve Information Governance Excellence A single solution for managing enterprise data quality
White Paper February 2009. IBM Cognos Supply Chain Analytics
 White Paper February 2009 IBM Cognos Supply Chain Analytics 2 Contents 5 Business problems Perform cross-functional analysis of key supply chain processes 5 Business drivers Supplier Relationship Management
An Enterprise Framework for Business Intelligence
 An Enterprise Framework for Business Intelligence Colin White BI Research May 2009 Sponsored by Oracle Corporation TABLE OF CONTENTS AN ENTERPRISE FRAMEWORK FOR BUSINESS INTELLIGENCE 1 THE BI PROCESSING
Hollister Incorporated : Worldwide Shipping Solution Integration. Eugene Hulscher (Hollister Incorporated) SESSION CODE: 1520
 SESSION CODE: 1520") Hollister Incorporated : Worldwide Shipping Solution Integration Eugene Hulscher (Hollister Incorporated) Paul Murphy (PRECISION Software) SESSION CODE: 1520 LEARNING POINTS Explore methods available in
Hollister Incorporated : Worldwide Shipping Solution Integration Eugene Hulscher (Hollister Incorporated) Paul Murphy (PRECISION Software) SESSION CODE: 1520 LEARNING POINTS Explore methods available in
BusinessObjects XI. New for users of BusinessObjects 6.x New for users of Crystal v10
 BusinessObjects XI Delivering extreme Insight Bringing information to new users, in new ways, with unmatched simplicity and context. Broadest and deepest end user capabilities from reporting, to query
Sales Force Automation
 Sales Force Automation 360 Degree View VinnoCRM gives a 360-degree view of each of your customers, enabling you to acquire deep knowledge of every account, facilitate collaboration across your organization,
GE Capital. Driving change and continuous process improvement. how-to
 Driving change and continuous process improvement Process improvement or PI involves applying tools and techniques to help a company achieve its goals Characteristics Aligned around what customers value
Visual Enterprise Architecture
 Business Process Management & Enterprise Architecture Services and Solutions October 2012 VEA: Click About to edit Us Master title style Global Presence Service and Solution Delivery in 22 Countries and
Dashboard Reporting Business Intelligence
 Dashboard Reporting Dashboards are One of 5 Styles of BI Applications Increasing Analytics & User Interactivity Advanced Analysis & Ad Hoc OLAP Analysis Reporting Ad Hoc Analysis Predictive Analysis Data
Customer Needs Management and Oracle Product Lifecycle Analytics
 Customer Needs Management and Oracle Product Lifecycle Analytics Marc Charmetant Oracle EMEA Keywords: Innovation, Customer Needs Management, Requirements Management, Intelligence, Analytics, KPI, Dashboards,
PeopleSoft Enterprise Performance Management. Name. Drive World-Class Performance. Title Oracle. Information Age Applications
 PeopleSoft Enterprise Performance Management Drive World-Class Performance Name Title Oracle Information Age Applications Corporate Performance Mgmt From Strategy to Execution User Type Strategic Operational
White Paper March 2009. Seven S&OP Reports Every Manufacturing Executive Needs Sales & operations planning excellence with IBM Cognos software
 White Paper March 2009 Seven S&OP Reports Every Manufacturing Executive Needs Sales & operations planning excellence with IBM Cognos software 2 Contents 3 Business problems 4 Business drivers The S&OP
idashboards FOR SOLUTION PROVIDERS
 idashboards FOR SOLUTION PROVIDERS The idashboards team was very flexible, investing considerable time working with our technical staff to come up with the perfect solution for us. Scott W. Ream, President,
MARKETPLACES. be seen. CHANNELADVISOR MARKETPLACES WILL ENABLE YOU TO: And Many More
 DATA SHEET be seen. MARKETPLACES Amazon, ebay and other marketplaces like Jet.com, Newegg and Sears account for a growing portion of global online retail sales. Online retailers of all sizes are recognizing
EXPLORING THE CAVERN OF DATA GOVERNANCE
 EXPLORING THE CAVERN OF DATA GOVERNANCE AUGUST 2013 Darren Dadley Business Intelligence, Program Director Planning and Information Office SIBI Overview SIBI Program Methodology 2 Definitions: & Governance
Best Practices of Project Management and Tracking Tools
 Best Practices of Project Management and Tracking Tools A solid Lean Six Sigma deployment requires a mechanism for recording, storing, viewing, and reporting on the on going project work. This level of
Business Intelligence Maturity Model. Wayne Eckerson Director of Research The Data Warehousing Institute [email protected]
 Business Intelligence Maturity Model Wayne Eckerson Director of Research The Data Warehousing Institute [email protected] Purpose of Maturity Model If you don t know where you are going, any path will
The Total Economic Impact Of SAS Customer Intelligence Solutions Intelligent Advertising For Publishers
 A Forrester Total Economic Impact Study Commissioned By SAS Project Director: Dean Davison February 2014 The Total Economic Impact Of SAS Customer Intelligence Solutions Intelligent Advertising For Publishers
BIRT Performance Scorecard Root Cause Analysis and Data Visualization The Path to Higher Performance
 BIRT Performance Scorecard Root Cause Analysis and Data Visualization The Path to Higher Performance Best-in-Class Performance Management powered by Best-in-Class Business Intelligence BIRT Performance
Best Practices in Enterprise Data Governance
 Best Practices in Enterprise Data Governance Scott Gidley and Nancy Rausch, SAS WHITE PAPER SAS White Paper Table of Contents Introduction.... 1 Data Governance Use Case and Challenges.... 1 Collaboration
QAD BUSINESS INTELLIGENCE
 QAD BUSINESS INTELLIGENCE QAD BUSINESS INTELLIGENCE QAD Business Intelligence unifies data from multiple sources across the enterprise, providing a comprehensive solution that enables key enterprise decision
Business Intelligence
 1 3 Business Intelligence Support Services Service Definition BUSINESS INTELLIGENCE SUPPORT SERVICES Service Description The Business Intelligence Support Services are part of the Cognizant Information
Corporate Performance Management Framework
 Version 1.0 Copyright 2004 Answerport, Inc. Table of Contents Table of Contents... 2 Conceptual Overview... 3 Conceptual Overview Diagram... 4 The Foundation... 4 Analytic Presentation Layer... 5 Reports...
Business Objects Dashboards Drive Performance Improvements at North Carolina s Department of Transportation
 Business Objects Dashboards Drive Performance Improvements at North Carolina s Department of Transportation Tim Frost Manager, SAP Services North Carolina Department of Transportation Learning Points Implementation
Business Intelligence Tool Migration. Title: Domain: Client: Location:
 Business Intelligence Tool Migration Title: Domain: Client: Location: Business Objects to MicroStrategy Conversion Payment Services Major Payments Processing Services Provider Northville, MI Project Description
SharePoint 2010 vs. SharePoint 2013 Feature Comparison
 SharePoint 2010 vs. SharePoint 2013 Feature Comparison March 2013 2013 SUSAN HANLEY LLC SharePoint 2010 vs. 2013 From a document collaboration perspective, the structures of both versions are the same
Agenda. SAP BusinessObjects 2012 / Slide 2 Private and Confidential
 SAP BusinessObjects 2012 / Slide 2 Private and Confidential Agenda IDD / EIM / EDGE Product Portfolio Roma Background and overview Deployment Phase 1 Deployment Phase 2 Deployment Phase 3 Next Phase -
UXC Eclipse + Microsoft Dynamics NAV for Life Sciences
 UXC Eclipse + Microsoft Dynamics NAV for Life Sciences The foundation of the UXC Eclipse Life Science Solution is Microsoft Dynamics NAV, delivering with the industry expertise of UXC Eclipse and rigorous
I N D U S T R Y D E V E L O P M E N T S A N D M O D E L S. I D C M a t u r i t y M o d e l : P r i n t a n d D o c u m e n t M a n a g e m e n t
 Global Headquarters: 5 Speen Street Framingham, MA 01701 USA P.508.872.8200 F.508.935.4015 www.idc.com E X C E R P T I N D U S T R Y D E V E L O P M E N T S A N D M O D E L S I D C M a t u r i t y M o
Asset management guidelines
 Asset management guidelines 1 IT asset management (ITAM) overview Objective Provide a single, integrated view of agency assets in order to allow agencies to identify the asset location and assess the potential
BI & DASHBOARDS WITH SHAREPOINT 2007
 BI & DASHBOARDS WITH SHAREPOINT 2007 Leveraging SharePoint to Deliver Business Intelligence Solutions Rob Kerr, Principal Consultant BlueGranite [email protected] http://blog.robkerr.com About BlueGranite
MITS Distributor Analytics
 Product Datasheet For TrulinX Users MITS Distributor Analytics A powerful combination of reporting features MITS Distributor Analytics gives you a competitive edge when it comes to making decisions that
The Worksoft Suite. Automated Business Process Discovery & Validation ENSURING THE SUCCESS OF DIGITAL BUSINESS. Worksoft Differentiators
 Automated Business Process Discovery & Validation The Worksoft Suite Worksoft Differentiators The industry s only platform for automated business process discovery & validation A track record of success,
The Truth about Self-Service Business Intelligence. Andrew Rankin Lead BI Consultant, Plaut IT Australia
 The Truth about Self-Service Business Intelligence Andrew Rankin Lead BI Consultant, Plaut IT Australia 2 Agenda Overview People Data Tools Governance Value Proposition Questions Self Service Business
Metrics by design A practical approach to measuring internal audit performance
 Metrics by design A practical approach to measuring internal audit performance September 2014 At a glance Expectations of Internal Audit are rising. Regulatory pressure is increasing. Budgets are tightening.
By Makesh Kannaiyan [email protected] 8/27/2011 1
 Integration between SAP BusinessObjects and Netweaver By Makesh Kannaiyan [email protected] 8/27/2011 1 Agenda Evolution of BO Business Intelligence suite Integration Integration after 4.0 release
Business Intelligence Meets Business Process Management. Powerful technologies can work in tandem to drive successful operations
 Business Intelligence Meets Business Process Management Powerful technologies can work in tandem to drive successful operations Content The Corporate Challenge.3 Separation Inhibits Decision-Making..3
SAP BusinessObjects. Solutions for Large Enterprises & SME s
 SAP BusinessObjects Solutions for Large Enterprises & SME s Since 1993, we have been using our BI experience to ensure you buy the right licences at the lowest price, thus helping to deliver the best and
Enterprise Information Systems
 Enterprise Information Systems Dr Sherif Kamel Department of Management School of Business, Economics and Communication Enterprise Information Systems DSS to provide enterprise-wide support Support to
White Paper May 2009. Seven reports every supply chain executive needs Supply Chain Performance Management with IBM
 White Paper May 2009 Seven reports every supply chain executive needs Supply Chain Performance Management with IBM 2 Contents 3 Business problems 3 Business drivers 4 The solution IBM Cognos SCPM Seven
Research Brief. Using the Model. Category One: Strategy
 The Sirius Directions in Services Model The Sirius Directions in Services Model groups sales, marketing and product service providers and agencies into five categories: strategy, reputation, demand, sales
actionable big data. maximum roi. Making Analytics Make Actionable Sense: PART 2
 actionable big data. maximum roi. Making Analytics Make Actionable Sense: PART 2 Why read this paper? The Big Data explosion has had a major fallout component: how do I track and measure all this data
Rakesh Tej Kumar Kalahasthi and Benson Hilbert SAP BI Practice, Bangalore, India Email: [email protected], [email protected].
 394 Business Intelligence Journal July A SHORT COMMUNICATION ON - HOW A LEADING POWER DISTRIBUTION COMPANY EFFECTIVELY TRACKS BUSINESS AREAS LIKE SAFETY, FINANCE AND OPERATION FOR REGION AND BUSINESS WISE
BI Project Management Software
 BI Project Management Software Plan and Manage with Confidence When planning a new project, program managers can search past projects to leverage project assets and resources. With complete project and
BRAINFOOD. Automated Dynamic Integration of Marketing and Sales. Sales Optimization White Paper INNOVATIONS FROM THE CONVERGENCE OF
 BRAINFOOD INNOVATIONS FROM THE CONVERGENCE OF BUSINESS, MARKETING AND CREATIVE STRATEGIES WITH LEADING TECHNOLOGY Sales Optimization Automated Dynamic Integration of Marketing and Sales PREFACE Utilizing
!!!!! White Paper. Understanding The Role of Data Governance To Support A Self-Service Environment. Sponsored by
 White Paper Understanding The Role of Data Governance To Support A Self-Service Environment Sponsored by Sponsored by MicroStrategy Incorporated Founded in 1989, MicroStrategy (Nasdaq: MSTR) is a leading
Umoja Realisation Workshop Cluster 3
 Umoja Realisation Workshop Cluster 3 Nairobi, 24-28 February 2014 4.8 UMOJA BUSINESS INTELLIGENCE OVERVIEW Agenda Introduction to BI Reporting in Umoja: ECC, SRM, and BI Available tools and technologies
Monitoring & Testing
 Rivo provides a total monitoring, analysis, testing and reporting solution. Monitor environmental and other enterprise risk and performance metrics such as air, water and land waste/emissions. Monitor
Quick Facts. Global Footprint VERTICAL INDUSTRY FOCUS 220+ TEAM 24/7. Services. www.emergys.com
 Quick Facts VERTICAL INDUSTRY FOCUS Discrete Manufacturing Auto Component Manufacturing Distribu8on & Logis8cs Apparel FMCG Retail Professional Services Global Footprint INDIA US MEXICO CANADA 220+ Successful
Oracle BI Application: Demonstrating the Functionality & Ease of use. Geoffrey Francis Naailah Gora
 Oracle BI Application: Demonstrating the Functionality & Ease of use Geoffrey Francis Naailah Gora Agenda Oracle BI & BI Apps Overview Demo: Procurement & Spend Analytics Creating a ad-hoc report Copyright
BIG DATA KICK START. Troy Christensen December 2013
 BIG DATA KICK START Troy Christensen December 2013 Big Data Roadmap 1 Define the Target Operating Model 2 Develop Implementation Scope and Approach 3 Progress Key Data Management Capabilities 4 Transition
Procurement General Session: Empowering Modern Procurement
 Procurement General Session: Empowering Modern Procurement Business Driven. Technology Powered. Marco Rossi SCM Product Development Director - EMEA Safe Harbor Statement The following is intended to outline
Lessons from McKesson s Approach to Maintaining a Mature, Cost-Effective Sarbanes-Oxley Program
 Orange County Convention Center Orlando, Florida May 15-18, 2011 Lessons from McKesson s Approach to Maintaining a Mature, Cost-Effective Sarbanes-Oxley Program Vickie Pilotti Kelly Worley Ben Wienand
ABOUT US WHO WE ARE. Helping you succeed against the odds...
 ACCURACY DELIVERED ABOUT US WHO WE ARE BizAcuity is a fast growing Business intelligence strategy company, providing reliable, scalable and cost effective consultancy and services to clients across the
Baker s Dozen: 13 Ways Process Intelligence Drives Supply Chain Value
 Baker s Dozen: 13 Ways Process Intelligence Drives Supply Chain Value Anthony Aming Enterprise Business and Applications Architect / Baker Hughes Anthony Aming, Baker Hughes Dave Brooks, Software AG Dave
Contract Management The Mavericks Won t Like This!
 Contract Management The Mavericks Won t Like This! Keith Wallis How Much Did That Project Cost? Real Life Example Original contract amount $500K Variations scope changes not visible Total variations =
Whitepaper Data Governance Roadmap for IT Executives Valeh Nazemoff
 Whitepaper Data Governance Roadmap for IT Executives Valeh Nazemoff The Challenge IT Executives are challenged with issues around data, compliancy, regulation and making confident decisions on their business
Adobe Experience Manager Apps
 Adobe Experience Manager Apps Capability Spotlight Adobe Experience Manager Apps Enable marketing and development teams to collaborate and deliver more engaging mobile app experiences that drive higher
BIG DATA STRATEGY. Rama Kattunga Chair at American institute of Big Data Professionals. Building Big Data Strategy For Your Organization
 BIG DATA STRATEGY Rama Kattunga Chair at American institute of Big Data Professionals Building Big Data Strategy For Your Organization In this session What is Big Data? Prepare your organization Building
Course duration: 45 Hrs Class duration: 1-1.5hrs
 Course duration: 45 Hrs Class duration: 1-1.5hrs USA : +1 9099998808 India : +91-9986411022 mail : [email protected] SAP BO 4.0 Introduction Data warehouse concepts Difference between Versions
RedPrairie for Food Service. Providing Consistency and Visibility at Least Cost
 RedPrairie for Food Service Providing Consistency and Visibility at Least Cost The Food Service Challenge Food service operators are faced with the enormous challenge of providing a consistent guest experience