Assessment: Assessment should support the learning of important mathematics and furnish useful information to both teachers and students.
|
|
|
- Augusta Harris
- 8 years ago
- Views:
Transcription
1 Title: Probability and Simulation Brief Overview: This learning unit will review the basic concepts of theoretical and experimental probability and simulations. Students will compare and contrast the two types of probability as a writing component. This writing component will be based on an in-class activity in which students will collect and analyze data. Two classroom activities will involve students in performing two different simulations, one using a student created spinner and one using the randint function on the TI-83 calculator. This learning unit is structured in three separate modules that may be used independently. NCTM 2000 Principles for School Mathematics: Equity: Excellence in mathematics education requires equity - high expectations and strong support for all students. Curriculum: A curriculum is more than a collection of activities: it must be coherent, focused on important mathematics, and well articulated across the grades. Teaching: Effective mathematics teaching requires understanding what students know and need to learn and then challenging and supporting them to learn it well. Learning: Students must learn mathematics with understanding, actively building new knowledge from experience and prior knowledge. Assessment: Assessment should support the learning of important mathematics and furnish useful information to both teachers and students. Technology: Technology is essential in teaching and learning mathematics; it influences the mathematics that is taught and enhances students learning. Links to NCTM 2000 Standards: Content Standards Data Analysis and Probability Students will demonstrate an understanding of and will apply basic concepts of probability. They will select and use appropriate statistical methods to analyze data. Students will develop and evaluate inferences and predictions that are based on data.

2 Process Standards Mathematics as Problem Solving, Reasoning and Proof, Communication, Connections, and Representation These five process standards are threads that integrate throughout the unit, although they may not be specifically addressed in the unit. They emphasize the need to help students develop the processes that are the major means for doing mathematics, thinking about mathematics, understanding mathematics, and communicating mathematics. Links to Maryland High School Mathematics Core Learning Units: Data Analysis and Probability Students will design and/or conduct an investigation that uses statistical methods to analyze data and communicate results Students will use simulations to make statistical inferences from data to estimate the probability of an event Students will make informed decisions and predictions based upon the results of simulations and data from research. Grade/Level: Grades 8-12; Algebra I Duration/Length: Three or four class periods or two block schedule periods. (variable) Prerequisite Knowledge: Students should have working knowledge of the following skills: Ability to create a pie chart Understand and work with the basic concepts/formula for theoretical and experimental probability Calculate percentages from a table of data

3 Student Outcomes: Students will be able to: state the experimental probability of an event. collect data and find the experimental probability of an event. compare and contrast theoretical and experimental probability based on a given event and data collected during a classroom activity. collect and use data to construct a tool (a spinner) to simulate an event. generate and interpret random data using the spinner. generate and interpret random data using the TI-83 (Plus) calculator s randint feature. use results from a simulation to determine probabilities and apply them to a random sampling. Materials/Resources/Printed Materials: Student simulation worksheets Heavy cardstock and large paper clips for the spinner TI-83 overhead projector TI-83 (Plus) calculators Development/Procedures: Assessment: This activity will consolidate the student s knowledge about probability and culminate with two simulation activities. Day One: Use Teacher Instruction Sheet. Day Two: Use Teacher Instruction Sheet. (End of day one in block scheduling) Day Three: Use Teacher Instruction Sheet. Day Four: Assessment. (End of day two in block scheduling) Students progress will be determined by: In-class activities, worksheets, and discussions A quiz following each module or a consolidated quiz following the unit Individually completed project following the unit Extension/Follow Up: Possibilities include: Investigations of games of chance and the spread of legalized gambling Investigation of state lotteries Actuarial studies
 calculator s randint feature. use results from a simulation to determine probabilities and apply them to a random sampling.")
4 Authors: Tara Trombetta James Hubert Blake High School Montgomery County, MD James D. Nosal Meade High School Anne Arundel County, MD Carl A. Brindley Williamsport High School Washington County, MD

5 STIMULATING SIMULATIONS

6 Simulation and Probability MODULE 1 Theoretical vs. Experimental Probability Objectives: Materials: Lesson: Students will be able to: state the definition and formula for theoretical and experimental probability. state the theoretical probability of an event. perform an experiment to determine the experimental probability of an event. compare and contrast theoretical and experimental probability based on the results of an event. make inferences from an experiment. Four (could vary) trash cans of equal dimensions Scrap paper to make basketballs (Alternative: Nerf/foam balls) Data collection worksheets Lesson worksheets Introduction: Advise students that they: will be studying both theoretical and experimental probability. must be able to state the formula for both types of probability and use them to calculate probability for an event. must actively participate in the collection of data. must be prepared to write a paper comparing and contrasting theoretical and experimental probability as it relates to the event covered in the lesson. Procedures: Divide the room into four sections and have students pair up within their area. Hand out student worksheets. Work in pairs, have students complete Questions 1 3 on the worksheet. As a class, discuss Question 3. Each student needs a clear understanding of the differences between theoretical and experimental probability. Have students complete Question 4. Stress with reasoning. Discuss as a class. Collect experimental data. (Teacher guidelines/class handout included) Have students work with their partner to complete Questions 6 7. Discuss. Have students begin their compare/contrast paragraph. Complete as homework.

7 Data Collection Procedures MODULE 1 Option 1: Set four trashcans (baskets) in the four corners of the classroom. (For adequate space, use a hallway or go outside for the data collection. If you go outside, your students could feel free to cheer their teammates on.) Place a piece of masking tape on the floor (foul line) at an equal distance from each basket to establish a consistent shooting position. Make the distance far enough to make the shot challenging, but not too difficult. Try ten feet if space allows. The paper will have to be balled up tightly to make it closely simulate a basketball. Make sure each group has a basketball and have them begin collecting data. One student in each group should be designated as the data recorder. Option 2: Allow each student one practice shot. Have each student take five shots from the foul line. Have the recorder write the student s name in the appropriate box and place a check mark in the box for each made shot. Ex.: If shot one is made, place a checkmark in column 1. If the shot is missed, leave the box blank. Record how many shots made in the # Made column. After all students have attempted five shots, record how many shots the group made and how many shots the group attempted. Have each group s recorder write down his/her group s data on the Class Data Table (preferably on an overhead transparency). Have each group add up the totals for the class and the teacher will record the accurate totals on the transparency. Collect your data by taking the class to the gym or an outdoor basketball area and have each student attempt real foul shots. This would require prearranging access to facilities and equipment ahead of time. Possible discussion topics when comparing theoretical and experimental probability: How would changing the diameter of the basket opening affect the outcomes. How would changing the ball affect the outcomes. How would changing the distance of the shot affect the outcomes. What other factors might change the outcome?

8 Classroom Worksheet Theoretical vs. Experimental Probability 1.) Write in words or in formula format the formula for theoretical probability. 2.) Write in words or in formula format the formula for experimental probability. 3.) What is the basic difference between theoretical probability and experimental probability? 4.) State the theoretical probability P (making a free throw). Explain your reasoning. 5.) Follow the teacher instructions for collecting the experimental data for your group. Use the attached worksheet to record and total your group s data. Be prepared to combine your data with the rest of the class. 6.) What is the experimental probability of making the next free throw based on your group s data? Based on the class s data? 7.) How did the experimental probabilities calculated in Step 6 compare to the experimental probability you recorded in Step 4? Explain why they are different or the same. List at least two factors that might make the experimental probability either higher or lower than the theoretical probability? 8.) Write a compare/contrast paragraph on the two types of probability. Include at least two similarities and two differences in your paragraph.

9 Classroom Worksheet (KEY) Theoretical vs. Experimental Probability 1.) Write in words or in formula format the formula for theoretical probability. P ( event ) = number of favorable outcomes number of possible outcomes 2.) Write in words or in formula format the formula for experimental probability. P ( event ) = number of times an event happens number of times the experiment is done 3.) What is the basic difference between theoretical probability and experimental probability? Theoretical probability is based on what might happen while experimental probability is based on what has happened in an experiment. 4.) State the theoretical probability P (making a free throw). Explain your reasoning. ½ A free throw attempt only has two possible outcomes, you either make it or you don t. Therefore, there is one favorable outcome, making it, and two possible outcomes. 5.) Follow the teacher instructions for collecting the experimental data for your group. Use the attached worksheet to record and total your group s data. Be prepared to combine your data with the rest of the class. 6.) What is the experimental probability of making the next free throw based on your group s data? Based on the class s data? This will vary by group and for the overall class depending on the data collected. 7.) How did the experimental probabilities calculated in Step 6 compare to the experimental probability you recorded in Step 4? Explain why they are different or the same. List at least two factors that might make the experimental probability either higher or lower than the theoretical probability? Students should say the two probabilities were close or they differed in some way. The answer should state which probability was higher. Students should state why they think the experimental probability was higher or lower. Examples: The experimental probability was higher because the basket s opening was so big. The experimental probability was lower because we were shooting from 25 feet away.
 State the theoretical probability P (making a free throw).")
10 8.) Write a compare/contrast paragraph on the two types of probability. Include at least two similarities and two differences in your paragraph. This paragraph should include an introductory sentence, three or more supporting sentences, and a concluding sentence. The support sentences must include data from the experiment. The types of information from the experiment might be numerical or factual, i.e. None of the people in my group have ever played basketball before. or The experimental probability for the class was 60% while the theoretical probability was 50%, a difference of 10%.

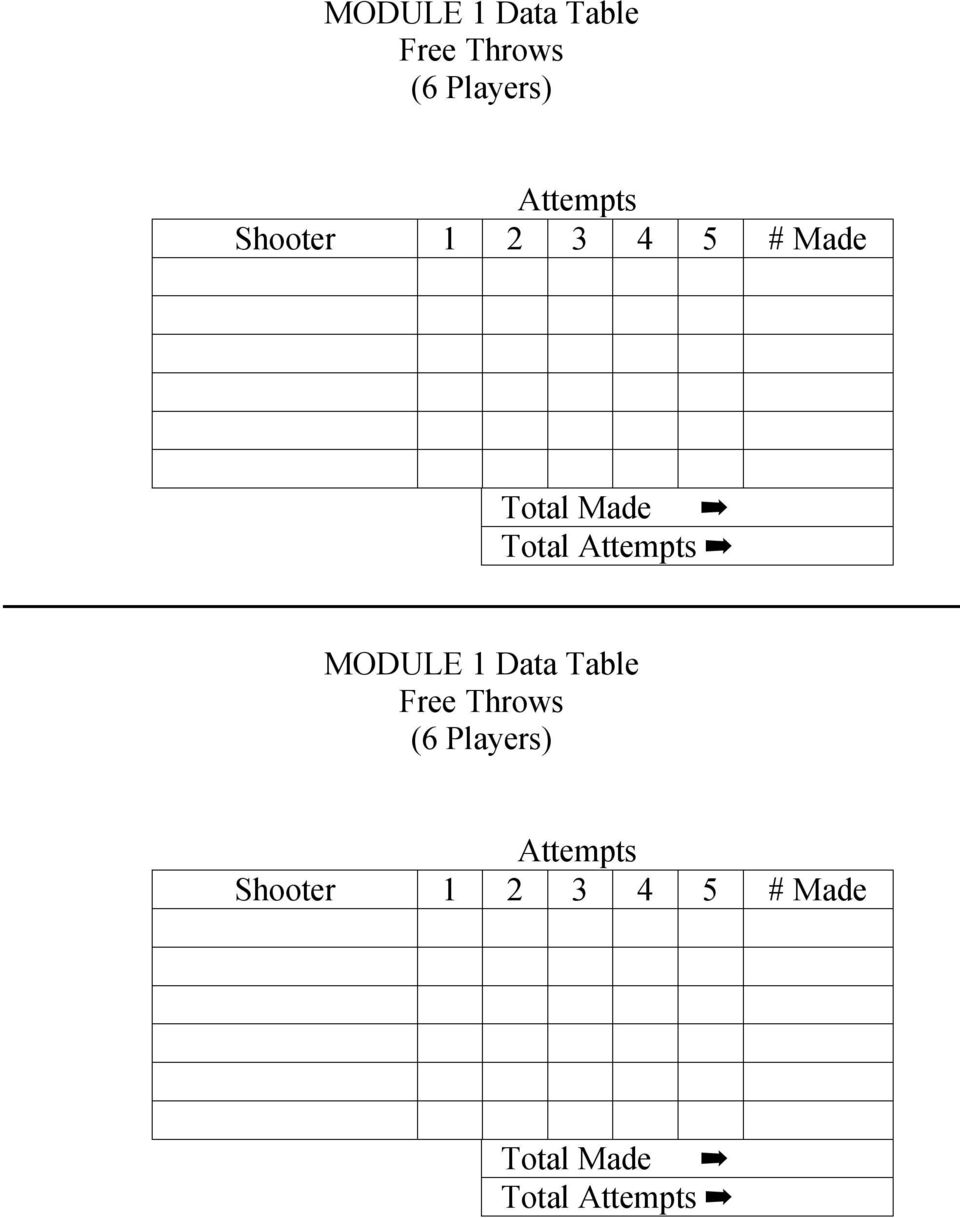
11 MODULE 1 Data Table Free Throws (6 Players) Attempts Shooter # Made Total Made Total Attempts MODULE 1 Data Table Free Throws (6 Players) Attempts Shooter # Made Total Made Total Attempts
12 Group # Shots Made Shots Tried Probability Class MODULE 1 Class Data Table Free Throws Number of free throws made P ( Made free throws) = Number of free throws tried
 = Number of free throws")
13 Module 1 Quiz Questions 1.) What is the basic difference between theoretical probability and experimental probability? 2.) The theoretical probability of making a shot in basketball is ½ or 50%. In other words, the shot will either go in or it won t. As compared to this, what will the experimental probability of making a shot in basketball be if we shoot only lay-ups? What if we only shoot 3-point shots (from about 20 feet away from the basket)? 3.) Three step question: Design a situation in which you can identify the theoretical probability. What is the theoretical probability in your example? Explain the steps you would use if you were to find the experimental probability for your example. 4.) In your example in Question 3, describe two factors that would affect your experimental probability, either making the percentage higher or lower than the theoretical probability.

14 Module 1 Quiz Questions 1.) What is the basic difference between theoretical probability and experimental probability? In experimental probability you perform an experiment or simulate results to determine probability while in theoretical probability you base it on possible outcomes without ever actually performing a task. 2.) The theoretical probability of making a shot in basketball is ½ or 50%. In other words, the shot will either go in or it won t. As compared to this, what will the experimental probability of making a shot in basketball be if we shoot only lay-ups? What if we only shoot 3-point shots (from about 20 feet away from the basket)? It will probably be much higher for lay-ups and lower for 3-point shots. 3.) Three step question: Design a situation in which you can identify the theoretical probability. What is the theoretical probability in your example? Explain the steps you would use if you were to find the experimental probability for your example. Student responses will vary. Grading might be based on creativity and completeness. 4.) In your example in Question 3, describe two factors that would affect your experimental probability, either making the percentage higher or lower than the theoretical probability. Again, student responses will vary. Stress the need for at least two factors and possibly give extra credit for others.
?")
15 Simulation and Probability MODULE 2 Zodiac Simulation Module Objective: Students will able to: gather data for a Probability Simulation. analyze data to determine the Probability percentage. compute and interpret the expected value of random variables. understand the concepts of sample space and probability distribution. conduct a simulation inferring that probability on a Random Population. Materials: Signs of Zodiac Transparency Zodiac Data Collection Worksheet Zodiac Data Collection Transparency Birth Date Data Collection Worksheet Spinner Black Line Master Heavy Card Stock for Spinner Paperclips Pencils Thumbtacks/push pins (optional) Heavy card stock/styrofoam board (optional) Lesson: Preparatory Activity: Students should complete Birth Date Collection Worksheet for homework the night BEFORE this activity. Procedures: 1. Students will collect birth date data on his/her family. Each student should get the birth date(s)for each member of his/her immediate family. 2. The next day in class, the students will assign the appropriate Zodiac symbol to each family member. A Signs of Zodiac master has been included.

16 3. Then the class completes the Zodiac Data Collection Worksheet while the teacher completes the Zodiac Data Collection Transparency as a model. 4. Based on the class s data, have the students determine probability percentage for each Zodiac Sign. Use the Zodiac Data Collection Worksheet. 5. Based upon that probability, have the student (or groups) build a spinner on Black Line Master. (The spinner should be a pie chart graphically displaying the resultant probability.) Note: The black line master has been divided into 5% increments for your students. This should assist in the construction of the spinner. Once the backing (pie chart) has been completed, have a student hold an open paper clip on the center of the spinner with a sharpened pencil. It is recommended that you glue the spinner Black Line Master sheet to a piece of cardboard or Styrofoam-board, then attach the paperclip with a thumbtack or push pin. 6. Using the spinner, determine the Zodiac sign for Ten (10) trials of Five (5) random people. Have students complete the Zodiac Data Collection Worksheet and answer the questions.
 Note: The black line master has been divided into 5% increments for your students. This should assist in the construction of the spinner.")
17 Name Date BIRTH DATE COLLECTION HOMEWORK Instructions: Collect your immediate family s birthdays in the space provided. If you can not get that family member s birth date, just put N/A. We will fill in the Zodiac signs tomorrow. My Birthday: My Zodiac Sign: My Father s/stepfather s/guardian s Birthday: My Father s/stepfather s/guardian s Zodiac Sign: My Mother s/stepmother s/guardian s Birthday: My Mother s/stepmother s/guardian s Zodiac Sign: My Brother s/sister s Birthday: My Brother s/sister s Zodiac Sign: My Brother s/sister s Birthday: My Brother s/sister s Zodiac Sign: My Brother s/sister s Birthday: My Brother s/sister s Zodiac Sign: My Brother s/sister s Birthday: My Brother s/sister s Zodiac Sign:

18 Signs of the Zodiac DATES Jan 21 Feb 18 ZODIAC SIGN Aquarius Feb 19 Mar 20 Pisces Mar 21 Apr 20 Aries Apr 21 May 20 Taurus May 21 Jun 21 Gemini Jun 22 Jul 22 Cancer Jul 23 Aug 22 Leo Aug 23 Sept 22 Virgo Sept 23 Oct 23 Libra Oct 24 Nov 21 Scorpio Nov 22 Dec 22 Sagittarius Dec 23 Jan 20 Capricorn

19 Name Date Zodiac Data Collection Worksheet Instructions: Record class data for each Zodiac Sign from Birth Date Collection Worksheet. Based on those results, determine the percentage of the data that represents each of the 12 Zodiac Signs. Use the attached worksheet for calculations. Zodiac Dates Class Results Total Percentage Sign Aquarius Jan 21 - Feb 18 Pisces Feb 19 - Mar 20 Aries Mar 21 - Apr 20 Taurus Apr 21 - May 20 Gemini May 21 - Jun 21 Cancer Jun 22 - Jul 22 Leo Jul 23 - Aug 22 Virgo Aug 23 - Sept 22 Libra Sept 23 - Oct 23 Scorpio Oct 24 - Nov 21 Sagittarius Nov 22 - Dec 22 Capricorn Dec 23 - Jan 20 Total 100%

20 Percentage Calculations Example: # of Aries data = PERCENTAGE OF ARIES in class # of birth dates collected Following the above example, use the space provided to calculate the percentage of each zodiac sign and record those results in your chart. Aquarius: = Pisces: = Aries: = Taurus: = Gemini: = Cancer: = Leo: = Virgo: = Libra: = Scorpio: = Capricorn: = 100%

21 Simulation Using the probability percentages in your chart, answer the following questions. What are the possible outcomes of the simulation? What are the probability percentages for these outcomes? Construct a spinner. Graph each outcome based on their respective probability percentages, just as you would on a pie chart. For example, if Aries is 23 percent probable then 23 percent of the spinner should represented Aries. Theoretical Probability = # of favorable outcomes # of possible outcomes
22 Use your spinner to conduct ten (10) trials to determine the zodiac signs of five(5) random people. Record your results below. Trial # Person 1 Person 2 Person 3 Person 4 Person 5 In any of the trials above, did one Zodiac sign have a frequency greater than one? In which trial did it occur? What sign was it? What is the significance of this? What occupation would find this type of information interesting, i.e., birth month? Out of your ten trials, what was the most frequently occurring Zodiac sign? Which occurred the least?
23 ZODIAC SPINNER Note: The Black Line Master has been divided into 5% increments for your students. This should assist in the construction of the spinner. Once the backing (pie chart) has been completed, have a student hold an open paper clip on the center of the spinner with a sharpened pencil. It is recommended that you glue the spinner Black Line Master sheet to a piece of cardboard or Styrofoam-board, then attach the paperclip with a thumbtack or push pin.
24 Name Date MODULE 2 Assessment A person has a 32% probability of being born as a Male. 1. What would be the probability percentage of being born as a female? 2. Explain how you would conduct a simulation, using a spinner, with these probabilities.
25 Name ANSWER KEY Date MODULE 2 Assessment A person has a 32% probability of being born as a male. 1. What would be the probability percentage of being born as a female? 68% probability for being born as a female 2. Explain how you would conduct a simulation, using a spinner, with these probabilities. Answer Rubric 4 points - Student explains that the simulation has more then eight trials with multiple random candidates, the spinner is divided according to the outcome percentages. 3 points - Student explains that the simulation has more then five trials with multiple random candidates, the spinner is divided into equal portions for each outcome. 2 points - Student explains that the simulation has more the one trial with multiple random candidates, the spinner is divided. 1 points - Student explains that the simulation has one trial with candidates, the spinner doesn t exist.
26 Simulation and Probability MODULE 3 Generating Random Numbers Using Your Graphing Calculator Objectives: Materials: Lesson: Students will be able to: determine the type of learning style they have. set up and conduct a simulation. produce random integers using the graphing calculator. analyze data and find probabilities. Graphing calculator, TI-83 or TI-83 Plus Lesson worksheet 1. Graphing Calculator Procedure Guide 2. Student Simulation Worksheet 3. Learning Style Inventory Worksheet 1. Introduction. Ask student to turn to the student next to them. Have the students orally exchange phone or student ID numbers and give them one minute to be able to recite it back without reading it from a paper. Ask students to share the different methods they used to learn the number. Introduce the concept of learning styles. If you want more information on learning styles go to This will also give them studying tips that are conducive to their learning style, or you can have the students research this information. 2. Learning Style Inventory. Have the students complete the learning style inventory worksheet to determine which learning style they are. You might want to point out that a student can be split between two or three learning styles, but a dominant learning style should be present and that is what he or she will use in class today. 3. Conduct the simulation by following the direction on the Teacher s Key to the Student Simulation Worksheet. Space for 50 trials is provided. Teacher should decide how many trials to have students complete. 4. Discuss and compare the answers on the Student Simulation Worksheet
27 Name Date Period What Is Your Learning Style? Read each sentence carefully and think about how it applies to you. On each question, circle the number that best describes your reaction. 5-Almost always 4-Often 3-Sometimes 2-Rarely 1-Almost Never Part I. 1. I remember what people look like better than what they say. 2. I would rather read instructions than have them read to me. 3. I can picture my notes in my head when I take a test. 4. I write things down to remember them better. 5. It is hard to concentrate with a lot of background noise. 6. I cannot remember a new website address long enough to use it later. 7. I prefer to look at the person who is speaking. 8. I prefer to get work done in a quiet place. 9. When I m lost I picture the map in my head to determine which way to go. 10. When trying to remember new information I form a picture in my mind. Part II. 1. I talk to myself when doing a difficult task. 2. I would rather hear instructions than read them. 3. I prefer to study by telling somebody about what I know. 4. I can still concentrate on a speaker even if I m looking at something else.
28 5. I can easily learn the words of a song by hearing it a few times. 6. When I talk about my ideas I understand them better. 7. I prefer to first hear a new song on the radio rather than watching the video. 8. I m better at remembering names than faces. 9. When learning something new I would rather hear it on a tape rather than read about it. 10. I would prefer to tell about myself rather than write it. Part III. 1. When putting together something new, instead of reading the directions I just start working. 2. When I study I move around a lot and don t like to use a desk. 3. I use my hands to describe things because I often can t find the right word. 4. When I start a book I like to look at the ending first. 5. I may be disorganized, but I know where things are. 6. I use my fingers in math and move my lips when I read. 7. I don t like to review or proofread what I write. 8. It does not bother me to have the TV or music on while I study. 9. I usually do not use my notes to study. 10. Given the choice, I would rather build a model plane, than read or write about it. Add up your scores and record below Part I-Visual Part II-Auditory Part III-Kinesthetic Learn by Seeing Learn by Hearing Learn by Doing Total Score The highest score represents your dominant type of learning style.
29 Name Date Period 1) Clear home screen Graphing Calculator Procedure Guide 2) Set the Seed on your calculator. This is important so that each student in the class will generate a different list of numbers. (a) Choose a number between 1 and 10,000. A good idea is to use the last 4 digits of your phone number. This will ensure that everybody s seed number is different. (b) Hit ENTER (c) Store the number, hit the STOfi key (d) Go to the math menu, hit the MATH key (e) Arrow over to the PRB menu (f) Since rand is already highlighted, hit ENTER (g) Hit ENTER again, your number is now stored; it should be displayed on the screen. 3) Generate 50 trials of 5 random integers from 0 to 9 (a) Go to the math menu, hit the MATH key (b) Arrow over to PRB (c) Chose #5 randint (and press ENTER. This key tells the calculator that you want random integers (d) Type 0 and a comma,. This determines the beginning of the range you want. (e) Type 9 and,. This determines the end number in your range. (f) Type 5 and ). This determines how many numbers you want in each trial. (g) Hit ENTER. Each time you hit ENTER you will generate another set of numbers.
30 Name Date Period Student Simulation Worksheet 1. State the Problem Our class is being put into groups of five. What is the probability that there will be at least 3 of the same learning style in any group? 2. State the outcomes and assumptions 3. Choose method of generating data 4. Define experiment/trials 5. Document results Trial # Trial Outcome 3 of 5 4 of 5 Trial # Trial Outcome 3 of 5 4 of 5
31 Trial # Trial Outcome 3 of 5 4 of 5 Trial # Trial Outcome 3 of 5 4 of 5 Trial # Trial Outcome 3 of 5 4 of 5 6. Analyze data a) What is the probability that any group has at least three students that have the same learning style?
32 b) What is the probability that there are exactly four students with the same learning style in a group? c) What is the probability that there are at least two other students with the same learning style as you? d) On the first Monday of each month there is a staff meeting for all teachers. By conducting a simulation of random numbers and doing ten trials using the same integer assignment for learning styles from the problem above, what is the probability that the fourth teacher to walk into the room is a visual learner?
33 Name Teacher Key Date Period 1. State the Problem Student Simulation Worksheet Our class is being put into groups of five. What is the probability that there will be at least 3 of the same learning style in any group? 2. State the outcomes and assumptions We assume that each student reflects only one dominant learning style, and the groups of students will be chosen at random. 3. Choose method of generating data We will use the calculator to generate a list of random integers from 0 to 9. We will then assign a percentage of the number to each learning style based on the information collected from the class. 4. Define experiment/trials A trial will consist of 5 numbers representing 5 students in each group. We will do 50 trials. After the students determine their learning style and you have found the class percentages, assign a learning style to each random integer. For example, if the class had 30% visual, 40% auditory and 30% kinesthetic (round to the nearest ten percent), then 0, 1, and 2 will represent visual, 3, 4, 5, and 6 will represent auditory, and 7, 8, and 9 will represent kinesthetic. 5. Document results See calculator worksheet to product the random integers. Trial # Trial Outcome 3 of 5 4 of Yes No Yes No Yes Yes Yes Yes Yes No Yes No Yes No No No No No Yes No Trial # Trial Outcome 3 of 5 4 of No No Yes Yes No No Yes No No No Yes No No No Yes No Yes No Yes Yes
34 Trial # Trial Outcome 3 of 5 4of Yes No Yes No No No Yes No Yes No No No Yes No Yes No Yes Yes Yes Yes Trial # Trial Outcome 3of 5 4 of No No Yes No Yes No Yes No Yes No Yes No Yes Yes No No No No No No Trial # Trial Outcome 3 of 5 4 of No No Yes No Yes No Yes Yes Yes No Yes No Yes No No No Yes No Yes No 6. Analyze data a) What is the probability that any group has at least three students that have the same learning style? number of P(event) = number of favorable outcomes possible outcomes 36 P( 3 STYLES) = = 72 % 50
35 b) What is the probability that there are exactly four students with the same learning styles in a group? 8 P ( STYLES ) = = 16 % 50 c) What is the probability that there are at least two other students with the same learning style as you? d) On the first Monday of each month there is a staff meeting for all teachers. By conducting a simulation of random numbers and doing ten trials using the same integer assignment for learning styles from the problem above, what is the probability that the fourth teacher to walk into the room is a visual learner? auditory auditory kinesthetic kinesthetic visual auditory visual kinesthetic auditory auditory 2 P ( visual ) = = 20 % 10 Extension: Have the students research the learning styles of their teachers. How does the learning style of the teacher reflect their lesson presentations? Is there a correlation between subject taught and learning style? How should you a student adapt to the learning styles of your teachers? Should you have to? How will knowing your learning style be helpful in college? How can you strengthen your weaker learning styles What study habits should you implement to help you be most successful in school?
36 Assessment Questions from Module 3 1. Tina and Torie found out that 70% of their school population have brown eyes, 20% have blue eyes, and 10% have green eyes. They want to set up a simulation that represents this data. They are using 0-9 as their integers. How would you distribute the digits 0-9 to accurately represent the three categories? 2. The calculator screens below show a simulation that Troy did by rolling a six-sided die four times. a) What does the numbers 1, 6, and 4 represent on the first line of the first screen? b) How many trials did Troy run? c) Using Troy s simulation, what is the probability that exactly one two is rolled in a trial? d) Using Troy s simulation what is the probability that a 4 or greater is rolled in a trail? e) Troy is taking a trip to Las Vegas, and he has $ to spend. He is playing a game that for each bet he has four chances to roll the number of his choice. If his number is rolled he will double his money, and if his number is not rolled he will lose the money he bet. Troy always bets on three. Using the above data as his previous turns, how much should he bet on his next turn? Support your answer with the data above.
37 Assessment Questions from Module 3 1. Tina and Torie found out that 70% of their school population have brown eyes, 20% have blue eyes, and 10% have green eyes. They want to set up a simulation that represents this data. They are using 0-9 as their integers. How would you distribute the digits 0-9 to accurately represent the three categories? 0, 1, 2, 3, 4, 5, 6, will represent brown eyes 7, 8 will represent blue eyes 9 will represent brown eyes 2. The calculator screens below show a simulation that Troy did by rolling a six-sided die four times. a) What does the numbers 1, 6, and 4 represent on the first line of the first screen? 1 is the smallest number on the die, 6 is the largest number on the die, and 4 is the number of rolls each trial b) How many trials did Troy run? 13 c) Using Troy s simulation, what is the probability that exactly one two is rolled in a trial? P(exactly one two)=6/13=46% d) Using Troy s simulation what is the probability that a 4 or greater is rolled in a trail? P(4 or greater)=12/13=92.3% e) Troy is taking a trip to Las Vegas, and he has $ to spend. He is playing a game that for each bet he has four chances to roll the number of his choice. If his number is rolled he will double his money, and if his number is not rolled he will lose the money he bet. Troy always bets on three. Using the above data as his previous turns, how much should he bet on his next turn? Support your answer with the data above. Based on previous turns he has a 53.8% chance of rolling a three. Make sure the students write complete sentences and completely support their answer.
38 Unit Project: Lottery Play It or Not? Objective: The student will design and implement an investigation of the possible results of playing the Pick 3 and Pick 4 lottery games. The student should be able to state the theoretical and experimental probability of each game as a result of the investigation. Following the investigation, the student will write a one-page analysis of the investigation and draw conclusions based on the data obtained. Conclusions must be mathematically based while emotional factors could be used to explain why so many people do in fact play the lottery. Guidelines: The student will be expected to: create organized data collection forms for both the Pick 3 and the Pick 4 lottery games. decide if the class will be included in data collection or if he/she will perform data collection by random number simulation. produce daily lottery results using one of the simulation techniques covered in this unit. write a paper, first analyzing the data collected, then drawing valid, well supported conclusion. Suggested Student Instructions: 1.) Decide whether you will perform all data choices yourself or include the class in some manner. 2.) Create data collection forms for both games. A separate form would probably have to be designed if you wish to collect lottery numbers from each class member on a daily basis. 3.) Choose a method for pulling a daily lottery number. (Calculator, spinner) 4.) Simulate 50 days for each game with at least 100 players a day. Change your seed before drawing the lottery number and between each day. 5.) Calculate and record a theoretical probability and an experimental probability for each game. 6.) Write your one-page (five paragraph minimum) paper analyzing the results of your data and drawing conclusions from your results. Make sure that you support your conclusion using the results of your data. Emotional factors should only be used as a secondary motivation for either playing or not playing the lottery.
39 UNIT PROJECT: Lottery Play It or Not? Grading Guide GRADING TOPIC FULL CREDIT 3/4 CREDIT 1/2 CREDIT 1/4 CREDIT Data Component Organization Excellent Good Fair Poor Collection Method Organized, neat, and clear 2 of the 3 1 of 3 0 out of 3 Presentation Organized, neat, and clear 2 of the 3 1 of 3 0 out of 3 Statistical Analysis Uses mean, median, and mode Uses 2 of the 3 Uses 1 of the 3 Uses 0 of the 3 Accuracy Completely Accurate 75% Accurate 50% Accurate 25% or less Accurate Writing Component Organization Excellent Good Fair Poor Paragraph Structure 5 paragraphs 4 paragraphs 3 paragraphs 2 or less paragraphs Sentences Per Paragraph 5 per paragraph 4 per paragraph 3 per paragraph 2 or less per paragraphs Sentence Structure Excellent Good Fair Poor Grammar and Spelling Excellent Good Fair Poor Conclusion 80% supported by Mathematical Data 60% supported by Mathematical Data 40% supported by Mathematical Data 20% supported by Mathematical Data
If the World Were Our Classroom. Brief Overview:
 If the World Were Our Classroom Brief Overview: Using the picture book, If the World Were a Village by David J. Smith, students will gather similar research from their classroom to create their own book.
This unit is designed to take place over 7-10, 45 minute class periods. Students should have working knowledge of the following skills:
 Title: How Will I Survive? Brief Overview: Middle school students need practical application to experience the ups and downs of finance that plays an integral part of our adult lives. Students will use
Infographics in the Classroom: Using Data Visualization to Engage in Scientific Practices
 Infographics in the Classroom: Using Data Visualization to Engage in Scientific Practices Activity 4: Graphing and Interpreting Data In Activity 4, the class will compare different ways to graph the exact
Learning Styles. The VARK Categories. What is a Learning Style?
 Learning Styles What is a Learning Style? Learning styles focus on how your brain receives information. No one else learns or processes information exactly the way you do! If you discover how you process
Orange High School. Year 7, 2015. Mathematics Assignment 2
 Full name: Class teacher: Due date: Orange High School Year 7, 05 Mathematics Assignment Instructions All work must be your own. You are encouraged to use the internet but you need to rewrite your findings
Title: The Ins and Outs of Functions
 Title: The Ins and Outs of Functions Brief Overview: In these lessons, students will explore what a function is, how to determine if a relation is a function and different ways a function can be represented.
Game 9. Overview. Materials. Recommended Grades 3 5 Time Instruction: 30 45 minutes Independent Play: 20 30 minutes
 Game 9 Cross Out Singles Recommended Grades 3 5 Time Instruction: 30 45 minutes Independent Play: 20 30 minutes Quiet Dice Rolling dice can create lots of noise. To lessen the noise, consider using foam
Median, Mode, and Range Active Lesson
 Median, Mode, and Range Active Lesson Teacher Candidate: Cory D Wilson_Dates: October 2007 Cooperating Teacher: Dr. Lori Engstrom Coop. Initials: Group Size: 25 students Allotted Time: 15 minutes _ Grade
Title: Line of Best Fit. Brief Overview:
 Title: Line of Best Fit Brief Overview: This Concept Development Lesson is based on the skills needed to determine the line best fit for a set of data. The focus is based on grade levels 7-12. Students
Mathematics as Reasoning Students will use reasoning skills to determine the best method for maximizing area.
 Title: A Pen for Penny Brief Overview: This unit is a reinforcement of the concepts of area and perimeter of rectangles. Methods for maximizing area while perimeter remains the same are also included.
PROBABILITY FUN ON THE PIER
 PROBABILITY FUN ON THE PIER GRADE LEVEL(S) 4-9 LESSON OBJECTIVE Students will understand sampling and theoretical probability. BACKGROUND/PRIOR KNOWLEDGE NEEDED Proportional reasoning and basic probability
First Grade Exploring Two-Digit Numbers
 First Grade Exploring Two-Digit Numbers http://focusonmath.files.wordpress.com/2011/02/screen-shot-2011-02-17-at-3-10-19-pm.png North Carolina Department of Public Instruction www.ncdpi.wikispaces.net
Hands-On Data Analysis
 THE 2012 ROSENTHAL PRIZE for Innovation in Math Teaching Hands-On Data Analysis Lesson Plan GRADE 6 Table of Contents Overview... 3 Prerequisite Knowledge... 3 Lesson Goals.....3 Assessment.... 3 Common
Discovering Math: Prediction and Probability Teacher s Guide
 Teacher s Guide Grade Level: K 2 Curriculum Focus: Mathematics Lesson Duration: Two class periods Program Description Discovering Math: Prediction and Probability From likelihood to frequency to prediction,
MA 1125 Lecture 14 - Expected Values. Friday, February 28, 2014. Objectives: Introduce expected values.
 MA 5 Lecture 4 - Expected Values Friday, February 2, 24. Objectives: Introduce expected values.. Means, Variances, and Standard Deviations of Probability Distributions Two classes ago, we computed the
Understand numbers, ways of representing numbers, relationships among numbers, and number systems
 Equivalent Fractions and Comparing Fractions: Are You My Equal? Brief Overview: This four day lesson plan will explore the mathematical concept of identifying equivalent fractions and using this knowledge
Kristen Kachurek. Circumference, Perimeter, and Area Grades 7-10 5 Day lesson plan. Technology and Manipulatives used:
 Kristen Kachurek Circumference, Perimeter, and Area Grades 7-10 5 Day lesson plan Technology and Manipulatives used: TI-83 Plus calculator Area Form application (for TI-83 Plus calculator) Login application
Title: Sweet Charity. Brief Overview:
 Title: Sweet Charity Brief Overview: Your class has been given the task of organizing a fund raising activity. You will conduct a survey, analyze the results and the proceeds will be donated among different
2 Mathematics Curriculum
 New York State Common Core 2 Mathematics Curriculum GRADE GRADE 2 MODULE 3 Topic E: Model Numbers Within 1000 with Place Value Disks 2.NBT.A Focus Standard: 2.NBT.A Understand place value. Instructional
Modifying Curriculum and Instruction
 Modifying Curriculum and Instruction Purpose of Modification: The purpose of modification is to enable an individual to compensate for intellectual, behavioral, or physical disabi1ities. Modifications
What is the Probability of Pigging Out
 What is the Probability of Pigging Out Mary Richardson Susan Haller Grand Valley State University St. Cloud State University richamar@gvsu.edu skhaller@stcloudstate.edu Published: April 2012 Overview of
Ways We Use Integers. Negative Numbers in Bar Graphs
 Ways We Use Integers Problem Solving: Negative Numbers in Bar Graphs Ways We Use Integers When do we use negative integers? We use negative integers in several different ways. Most of the time, they are
Big Ideas, Goals & Content for 4 th grade Data Collection & Analysis Unit
 Big Ideas, Goals & Content for 4 th grade Data Collection & Analysis Unit Big Ideas Graphs are a way of organizing data and they appear in newspapers, magazines, on the Internet and other places in everyday
Polynomials and Factoring. Unit Lesson Plan
 Polynomials and Factoring Unit Lesson Plan By: David Harris University of North Carolina Chapel Hill Math 410 Dr. Thomas, M D. 2 Abstract This paper will discuss, and give, lesson plans for all the topics
The Virginia Company of London Wants You!
 The Virginia Company of London Wants You! Background: The Virginia Company of London has hired you to recruit new settlers to travel to Jamestown. You will need to have a good working knowledge about why
Mathematics as Problem Solving The students will demonstrate the ability to gather information from a graphical representation of an equation.
 Title: Another Way of Factoring Brief Overview: Students will find factors for quadratic equations with a leading coefficient of one. The students will then graph these equations using a graphing calculator
Warning! Construction Zone: Building Solids from Nets
 Brief Overview: Warning! Construction Zone: Building Solids from Nets In this unit the students will be examining and defining attributes of solids and their nets. The students will be expected to have
Comparing Sets of Data Grade Eight
 Ohio Standards Connection: Data Analysis and Probability Benchmark C Compare the characteristics of the mean, median, and mode for a given set of data, and explain which measure of center best represents
Local Government and Leaders Grade Three
 Ohio Standards Connection: Government Benchmark A Identify the responsibilities of the branches of the U.S. government and explain why they are necessary. Indicator 2 Explain the structure of local governments
Borrowing & Saving: Week 1
 The Minnesota Literacy Council created this curriculum with funding from the MN Department of Education. We invite you to adapt it for your own classrooms. Intermediate Level (CASAS reading scores of 201-220)
This document contains Chapter 2: Statistics, Data Analysis, and Probability strand from the 2008 California High School Exit Examination (CAHSEE):
:") This document contains Chapter 2:, Data Analysis, and strand from the 28 California High School Exit Examination (CAHSEE): Mathematics Study Guide published by the California Department of Education. The
This document contains Chapter 2:, Data Analysis, and strand from the 28 California High School Exit Examination (CAHSEE): Mathematics Study Guide published by the California Department of Education. The
Would You Like To Earn $1000 s With The Click Of A Button?
 Would You Like To Earn $1000 s With The Click Of A Button? (Follow these easy step by step instructions and you will) This Version of the ebook is for all countries other than the USA. If you need the
It is vital that you understand the rationale behind the correct answer(s) as wel as the incorrect answer options.
 as wel as the incorrect answer options.") Getting the Most out of ATI www.atitesting.com What is ATI? ATI is an online resource that will be used throughout the nursing program to help you learn about nursing practice as well as help prepare you
Getting the Most out of ATI www.atitesting.com What is ATI? ATI is an online resource that will be used throughout the nursing program to help you learn about nursing practice as well as help prepare you
Fifth Grade Physical Education Activities
 Fifth Grade Physical Education Activities 89 Inclement Weather PASS AND COUNT RESOURCE Indoor Action Games for Elementary Children, pg. 129 DESCRIPTION In this game, students will be ordering whole numbers.
USING ALGEBRA TILES EFFECTIVELY
 MATHEMATICS USING ALGEBRA TILES EFFECTIVELY TOOLS FOR UNDERSTANDING by Bettye C. Hall Reviewers James Gates, Ed.D. Yvonne S. Gentzler, Ph.D. AUTHOR Bettye C. Hall is the former Director of Mathematics
Accommodated Lesson Plan on Solving Systems of Equations by Elimination for Diego
 Accommodated Lesson Plan on Solving Systems of Equations by Elimination for Diego Courtney O Donovan Class: Algebra 1 Day #: 6-7 Grade: 8th Number of Students: 25 Date: May 12-13, 2011 Goal: Students will
MS TASKS TO BUILD PROFICIENCY IN PROBABILITY AND STATISTICS
 MS TASKS TO BUILD PROFICIENCY IN PROBABILITY AND STATISTICS DARLA OLSON & JENNA MUNDEN, RICE LAKE MIDDLE SCHOOL BRIAN DANIEL, MENOMONIE MIDDLE SCHOOL DEAN ROUSH, LUCK HIGH SCHOOL MSP: MATH TRANSITION INTO
STRING TELEPHONES. Education Development Center, Inc. DESIGN IT! ENGINEERING IN AFTER SCHOOL PROGRAMS. KELVIN Stock #651817
 STRING TELEPHONES KELVIN Stock #6587 DESIGN IT! ENGINEERING IN AFTER SCHOOL PROGRAMS Education Development Center, Inc. DESIGN IT! Engineering in After School Programs Table of Contents Overview...3...
Probability, statistics and football Franka Miriam Bru ckler Paris, 2015.
 Probability, statistics and football Franka Miriam Bru ckler Paris, 2015 Please read this before starting! Although each activity can be performed by one person only, it is suggested that you work in groups
Days of the Week Grade Kindergarten
 History Ohio Standards Connection: Benchmark A Use a calendar to determine the day, week, month and year. Indicator 1 Recite the days of the week. Lesson Summary: The children will participate in a variety
Exam 3 Review/WIR 9 These problems will be started in class on April 7 and continued on April 8 at the WIR.
 Exam 3 Review/WIR 9 These problems will be started in class on April 7 and continued on April 8 at the WIR. 1. Urn A contains 6 white marbles and 4 red marbles. Urn B contains 3 red marbles and two white
K/Grade 1 Recognizing Hazards Module 1. Lesson At A Glance. 45-60 minutes. Length
 Lesson At A Glance Length 45-60 minutes Learning Objectives Students will: identify hazards and use safe behaviours in the home, school and community demonstrate an ability to access emergency services
INSTRUCTOR'S GUIDE PROJECT PLANNING AND MANAGEMENT SKILLS MODULE
 10/01 INSTRUCTOR'S GUIDE PROJECT PLANNING AND MANAGEMENT SKILLS MODULE INTRODUCTION Russ Pimmel Electrical and Computer Engineering Department College of Engineering University Of Alabama The Instructor
Intro Lesson (Ages 8-14)
") Lesson: General: Age: Time: Objectives: Structures: Target Vocab: 8-14 years 40 mins - 1 hour Greetings, Asking & answering personal questions, using modal verbs for rules, Identifying different classroom
Lesson: General: Age: Time: Objectives: Structures: Target Vocab: 8-14 years 40 mins - 1 hour Greetings, Asking & answering personal questions, using modal verbs for rules, Identifying different classroom
Differentiated Instruction Strategies
 Miss Taylor Brooke Stancil s Differentiated Instruction Strategies Choral Response: Choral response is a very simple technique in which the teacher asks questions to the class as a whole and the students
To download the script for the listening go to: http://www.teachingenglish.org.uk/sites/teacheng/files/learning-stylesaudioscript.
 Learning styles Topic: Idioms Aims: - To apply listening skills to an audio extract of non-native speakers - To raise awareness of personal learning styles - To provide concrete learning aids to enable
http://www.pecentral.org/marchmadness.html
 PE Central s March Madness Basketball Lesson Ideas Mini Book Our editors have combed through the PE Central website (pecentral.org) searching for our favorite basketball lesson ideas, assessments, dances,
The Best Ideas for Managing and Evaluating the Interactive Student Notebook. Presented by TCI. www.teachtci.com (800) 497-6138
 497-6138") The Best Ideas for Managing and Evaluating the Interactive Student Notebook Presented by TCI www.teachtci.com (800) 497-6138 P A R T Using the Interactive Student Notebook 3 125 Using the Interactive Student
The Best Ideas for Managing and Evaluating the Interactive Student Notebook Presented by TCI www.teachtci.com (800) 497-6138 P A R T Using the Interactive Student Notebook 3 125 Using the Interactive Student
Unit #3: Investigating Quadratics (9 days + 1 jazz day + 1 summative evaluation day) BIG Ideas:
 BIG Ideas:") Unit #3: Investigating Quadratics (9 days + 1 jazz day + 1 summative evaluation day) BIG Ideas: Developing strategies for determining the zeroes of quadratic functions Making connections between the meaning
Unit #3: Investigating Quadratics (9 days + 1 jazz day + 1 summative evaluation day) BIG Ideas: Developing strategies for determining the zeroes of quadratic functions Making connections between the meaning
PE in Primary Schools Resource Summer Games
 PE in Primary Schools Resource Summer Games 1 2 PE in Primary Schools Resource Summer Games Ollie Dowding Kerri Brown Tom Eisenhuth Athletics Cricket Golf Page 5-10 Page 16-21 Page 22-27 3 Example Key
XPULT INSTRUCTIONS BASIC VERSION
 XPULT INSTRUCTIONS BASIC VERSION The Xpult is a device for launching table tennis balls or other light plastic balls. Most likely, you will have received the Xpult from your teacher or somebody else who
PREPARING FOR A CIVIL SERVICE EXAM HOW TO PREPARE FOR A CIVIL SERVICE EXAM (IN GENERAL)... DOING YOUR BEST
... DOING YOUR BEST") PREPARING FOR A CIVIL SERVICE EXAM HOW TO PREPARE FOR A CIVIL SERVICE EXAM (IN GENERAL)... DOING YOUR BEST BEFORE YOU START TO STUDY: - Read the announcement. Somewhere on it will be the topics or items
PREPARING FOR A CIVIL SERVICE EXAM HOW TO PREPARE FOR A CIVIL SERVICE EXAM (IN GENERAL)... DOING YOUR BEST BEFORE YOU START TO STUDY: - Read the announcement. Somewhere on it will be the topics or items
Learning Style Inventory
 Learning Style Inventory To better understand how you prefer to learn and process information, place a check in the appropriate space after each statement below, then use the scoring directions at the
Project Maths. Mathematics Resources for Students. Junior Certificate Strand 1. Statistics and Probability
 Project Maths Mathematics Resources for Students Junior Certificate Strand 1 Statistics and Probability NCCA 2009 PROJECT MATHS - Mathematics Resources for Students Introduction This material is designed
If baby was born 3 or more weeks prematurely, # of weeks premature: Last name: State/ Province: Home telephone number:
 Ages & Stages Questionnaires 12 11 months 0 days through 12 months 30 days Month Questionnaire Please provide the following information. Use black or blue ink only and print legibly when completing this
Base-Ten and Place Value
 1 Base-Ten and Place Value Jumping Jelly Beans Hundred Board-O Order Up! Number Neighborhood Stretching Numbers Place Value Pause Place Value Bingo 1 2 BRAIN-COMPATIBLE ACTIVITIES FOR MATHEMATICS, GRADES
PLANNING A BUDGET. Income, needs vs. wants, budgets, simple interest, savings accounts, paying yourself first
 Grades 6-8 Lesson 3 PLANNING A BUDGET Key concepts: Income, needs vs. wants, budgets, simple interest, savings accounts, paying yourself first Summary: This lesson reviews trade-offs and priorities in
Hands-On Math Data Analysis and Probability
 Hands-On Math Data Analysis and Probability by Robert H. Jenkins illustrated by Lois Leonard Stock Contents To the Teacher... v 1. Spinnering... 1 Activities focus on students ability to construct sample
RUTHERFORD HIGH SCHOOL Rutherford, New Jersey COURSE OUTLINE STATISTICS AND PROBABILITY
 RUTHERFORD HIGH SCHOOL Rutherford, New Jersey COURSE OUTLINE STATISTICS AND PROBABILITY I. INTRODUCTION According to the Common Core Standards (2010), Decisions or predictions are often based on data numbers
Walk the Line Written by: Maryann Huey Drake University Maryann.Huey@drake.edu
 Walk the Line Written by: Maryann Huey Drake University Maryann.Huey@drake.edu Overview of Lesson In this activity, students will conduct an investigation to collect data to determine how far students
NCTM Content Standard/National Science Education Standard:
 Title: Do These Systems Meet Your Expectations Brief Overview: This concept development unit is designed to develop the topic of systems of equations. Students will be able to graph systems of equations
Grade Level: Grade 3-5. Duration: 60+ minutes. Economic Concepts: Consumption, Money Management
 Managing Your Money: Planning Your Budget by Barbara Brooks Simons (Millmark Education Corporation, Bethesda, Maryland) 2009. ISBN-13: 978-1- 4334-0655-3 Literature Annotation Financial literacy is discussed
Expected Value and the Game of Craps
 Expected Value and the Game of Craps Blake Thornton Craps is a gambling game found in most casinos based on rolling two six sided dice. Most players who walk into a casino and try to play craps for the
How to Play. Player vs. Dealer
 How to Play You receive five cards to make your best four-card poker hand. A four-card Straight is a Straight, a four-card Flush is a Flush, etc. Player vs. Dealer Make equal bets on the Ante and Super
Geography of Slavery Lesson Plan
 Geography of Slavery Lesson Plan Description In this lesson, a fifth grade class will use the Geography of Slavery web site to create a biographical profile and a historical fiction piece of writing about
 Teachers, Teaching, and Technology Survey ID: Thank you for agreeing to participate in this study. Please be assured that all information gathered will be handled with utmost confidentiality, and respondents
Statistics and Probability
 Statistics and Probability TABLE OF CONTENTS 1 Posing Questions and Gathering Data. 2 2 Representing Data. 7 3 Interpreting and Evaluating Data 13 4 Exploring Probability..17 5 Games of Chance 20 6 Ideas
Representing Data Using Frequency Graphs
 Lesson 25 Mathematics Assessment Project Formative Assessment Lesson Materials Representing Data Using Graphs MARS Shell Center University of Nottingham & UC Berkeley Alpha Version If you encounter errors
That s Not Fair! ASSESSMENT #HSMA20. Benchmark Grades: 9-12
 That s Not Fair! ASSESSMENT # Benchmark Grades: 9-12 Summary: Students consider the difference between fair and unfair games, using probability to analyze games. The probability will be used to find ways
Subject: Math Grade Level: 5 Topic: The Metric System Time Allotment: 45 minutes Teaching Date: Day 1
 Subject: Math Grade Level: 5 Topic: The Metric System Time Allotment: 45 minutes Teaching Date: Day 1 I. (A) Goal(s): For student to gain conceptual understanding of the metric system and how to convert
NASA Explorer Schools Pre-Algebra Unit Lesson 2 Student Workbook. Solar System Math. Comparing Mass, Gravity, Composition, & Density
 National Aeronautics and Space Administration NASA Explorer Schools Pre-Algebra Unit Lesson 2 Student Workbook Solar System Math Comparing Mass, Gravity, Composition, & Density What interval of values
7 th Grade Integer Arithmetic 7-Day Unit Plan by Brian M. Fischer Lackawanna Middle/High School
 7 th Grade Integer Arithmetic 7-Day Unit Plan by Brian M. Fischer Lackawanna Middle/High School Page 1 of 20 Table of Contents Unit Objectives........ 3 NCTM Standards.... 3 NYS Standards....3 Resources
Session 8 Probability
 Key Terms for This Session Session 8 Probability Previously Introduced frequency New in This Session binomial experiment binomial probability model experimental probability mathematical probability outcome
Activities with Paper How To Make and Test a Paper Airplane
 Art/Math Grades K-4 One Lesson TM 1 Overview In this lesson, students will learn how to make a paper airplane. They will then test whose airplane flies farthest and will record the outcomes on a graph.
Learn How to Revise 1
 Learn How to Revise 1 SCHOOL EXAM DATES 2016 END OF YEAR EXAMS FOR YEARS 7-9 BEGIN ON MONDAY 6 TH JUNE THEY WILL TAKE PLACE IN LESSONS DURING THIS WEEK AND IF NECESSARY THE WEEK AFTER. Some subjects are
Basic Computer Skills Module 5. Introduction to Microsoft Excel 2010
 Basic Computer Skills Module 5 Introduction to Microsoft Excel 2010 Basic Computer Skills Module 5 Introduction to Microsoft Excel 2010 Summary Goals: Identify spreadsheet terms. Create and manipulate
Commutative Property Grade One
 Ohio Standards Connection Patterns, Functions and Algebra Benchmark E Solve open sentences and explain strategies. Indicator 4 Solve open sentences by representing an expression in more than one way using
We re All Winners Bingo
 We re All Winners Bingo Learning objective: Students will recognize the many things they have in common with a child with autism and generate their own ideas about how to support that child. Materials
Solving Systems of Linear Equations Substitutions
 Solving Systems of Linear Equations Substitutions Outcome (lesson objective) Students will accurately solve a system of equations algebraically using substitution. Student/Class Goal Students thinking
Curriculum Design for Mathematic Lesson Probability
 Curriculum Design for Mathematic Lesson Probability This curriculum design is for the 8th grade students who are going to learn Probability and trying to show the easiest way for them to go into this class.
AT&T Global Network Client for Windows Product Support Matrix January 29, 2015
 AT&T Global Network Client for Windows Product Support Matrix January 29, 2015 Product Support Matrix Following is the Product Support Matrix for the AT&T Global Network Client. See the AT&T Global Network
Students will model a real-world situation by using information and mathematical data on companies to build a stock portfolio.
 Title: Exploring the Stock Market Link to Outcomes: Problem Solving Communication Reasoning Connections Functions Statistics Technology Cooperation Interdiscipline Students will model a real-world situation
Outline Of Classroom Management Plan (Management plan is designed for an elementary school placement. Refer to classroom map when needed.
 Outline Of Classroom Management Plan (Management plan is designed for an elementary school placement. Refer to classroom map when needed.) I. Room Preparation A. Bulletin Boards and Walls There will be
Title ID Number Sequence and Duration Age Level Essential Question Learning Objectives. Lead In
 Title ID Number Sequence and Duration Age Level Essential Question Learning Objectives Lesson Activity Barbie Bungee (75-80 minutes) MS-M-A1 Lead In (15-20 minutes) Activity (45-50 minutes) Closure (10
Plunge Into Place Value
 Plunge Into Place Value Brief Overview: Understanding place value and expanded notation are critical components in understanding number sense. Through the lessons and activities in this unit, students
A Resource for Free-standing Mathematics Units. Data Sheet 1
 Data Sheet 1 Regular Expenses Item Estimate of Cost When Petrol/Diesel 10p per mile As needed Oil 12 for can of oil and filter Once or twice per year Air Filter 10 Once a year MOT 25-30 (excluding repairs)
Title: Integers: Quick, Fun and Easy To Learn
 Title: Integers: Quick, Fun and Easy To Learn Brief Overview Students will identify and understand positive and negative integers. Using this understanding, the students will use the number line, study
Lesson Plan. Preparation
 Portfolio Information Practicum in Interior Design Lesson Plan Performance Objective Upon completion of this assignment, the student will be able to create a portfolio to document personal knowledge and
Problem Solving Students will demonstrate their ability to solve problems in mathematics including problems with open-ended answers.
 Title: Designing Our School Garden Brief Overview: This performance-based assessment integrates geometric problem solving with real-world application. Students will design a garden with a variety of flowers
Systems of Transportation and Communication Grade Three
 1 Ohio Standards Connection: Geography Benchmark D Analyze ways that transportation and communication relate to patterns of settlement and economic activity. Indicator 8 Identify systems of transportation
Title: Heart Rate and Physical Fitness. Brief Overview:
 Title: Heart Rate and Physical Fitness Brief Overview: The effect of microgravity on the cardiovascular system is one of the main concerns of space travel. The physical fitness of astronauts is important
 Stock Market Unit Introduction The stock market unit can be expanded to take up as much or as little class time as you would like. Ideally, the students check their stocks weekly at the beginning of class
2. Provide the scoring guide/rubric for the culminating task (summative assessment).
.") 2. Provide the scoring guide/rubric for the culminating task (summative assessment). Criteria Oral Presentation- Group project Poster Presentation display/ visual aids 1 - Attempts the standard use the
2. Provide the scoring guide/rubric for the culminating task (summative assessment). Criteria Oral Presentation- Group project Poster Presentation display/ visual aids 1 - Attempts the standard use the
LESSON 7 Don t Be A Square by Michael Torres
 CONCEPT AREA GRADE LEVEL Measurement 5-6 TIME ALLOTMENT Two 60-minute sessions LESSON OVERVIEW LESSON ACTIVITIES OVERVIEW LEARNING OBJECTIVES STANDARDS (TEKS) Students will learn the relationship between
Past Tense Activities - Lesson 1
 Lesson: General: Time: Objectives: Structures: Target Vocab: 40 mins - 1 hour Talking about yesterday using past tense verbs " Que hiciste ayer?" "Ayer,..." ayer, hoy, mañana, fantástico, gran, jugué con
Pushes and Pulls. TCAPS Created June 2010 by J. McCain
 Pushes and Pulls K i n d e r g a r t e n S c i e n c e TCAPS Created June 2010 by J. McCain Table of Contents Science GLCEs incorporated in this Unit............... 2-3 Materials List.......................................
Socci Sport Alternative Games
 - 1 - Socci Sport Alternative Games Table of Contents 1 Roller Socci 2 2 Pass and Shoot Socci 2 3 Punt & Catch Socci 2 4 Long Pass Socci 3 5 Pass, Dribble, and Shoot Socci 3 6 Scooter Socci Basketball
Shopping. Grade One. Overview. Prerequisite Skills. Lesson Objectives. Materials List
 Grade One Shopping Overview Students share the book Just Shopping with Mom, by Mercer Mayer, to learn about shopping and counting money. They complete activities on examining coupons and shopping for bicycle
The activities in Math Behind the Market are organized into four main mathematic strands:
 Dear Teacher, Thank you for considering Math Behind the Market for use with The Stock Market Game (SMG) program in your classroom. Fully sponsored by the McGraw-Hill Companies, Math Behind the Market provides
Multiplying Integers. Lesson Plan
 Lesson Plan Video: 12 minutes Lesson: 38 minutes Pre-viewing :00 Warm up: Write 5 + 5 + 5 + 5 = on the board. Ask students for the answer. Then write 5 x 4 = on the board. Ask the students for the answer.