Big Data need Big Model 1/44
|
|
|
- Theodora Lester
- 10 years ago
- Views:
Transcription
1 Big Data need Big Model 1/44

2 Andrew Gelman, Bob Carpenter, Matt Hoffman, Daniel Lee, Ben Goodrich, Michael Betancourt, Marcus Brubaker, Jiqiang Guo, Peter Li, Allen Riddell,... Department of Statistics, Columbia University, New York (and other places) 10 Nov /44

3 3/44


4 4/44


5 5/44

6 Ordered probit data { int<lower=2> K; int<lower=0> N; int<lower=1> D; int<lower=1,upper=k> y[n]; row_vector[d] x[n]; } parameters { vector[d] beta; ordered[k-1] c; } model { vector[k] theta; for (n in 1:N) { real eta; eta <- x[n] * beta; theta[1] <- 1 - Phi(eta - c[1]); for (k in 2:(K-1)) theta[k] <- Phi(eta - c[k-1]) - Phi(eta - c[k]); theta[k] <- Phi(eta - c[k-1]); y[n] ~ categorical(theta); } } 6/44
![in 1:N) { real eta; eta <- x[n] * beta; theta[1] <- 1 - Phi(eta - c[1]); for (k in 2:(K-1)) theta[k]](/docs-images/43/7288039/images/page_6.jpg "<- Phi(eta - c[k-1]) - Phi(eta - c[k]); theta[k] <- Phi(eta - c[k-1]); y[n] ~ categorical(theta); } }")
7 Measurement error model data {... real x_meas[n]; real<lower=0> tau; } parameters { real x[n]; real mu_x; real sigma_x;... } model { } // measurement of x // measurement noise // unknown true value // prior location // prior scale x ~ normal(mu_x, sigma_x); x_meas ~ normal(x, tau); y ~ normal(alpha + beta * x, sigma);... // prior // measurement model 7/44
; x_meas ~ normal(x, tau); y ~")
8 Stan overview 8/44

9 Stan overview Fit open-ended Bayesian models 8/44

10 Stan overview Fit open-ended Bayesian models Specify log posterior density in C++ 8/44

11 Stan overview Fit open-ended Bayesian models Specify log posterior density in C++ Code a distribution once, then use it everywhere 8/44

12 Stan overview Fit open-ended Bayesian models Specify log posterior density in C++ Code a distribution once, then use it everywhere Hamiltonian No-U-Turn sampler 8/44

13 Stan overview Fit open-ended Bayesian models Specify log posterior density in C++ Code a distribution once, then use it everywhere Hamiltonian No-U-Turn sampler Autodiff 8/44

14 Stan overview Fit open-ended Bayesian models Specify log posterior density in C++ Code a distribution once, then use it everywhere Hamiltonian No-U-Turn sampler Autodiff Runs from R, Python, Matlab, Julia; postprocessing 8/44

15 People 9/44

16 People Stan core (15) 9/44

17 People Stan core (15) Research collaborators (30) Developers (100) 9/44
 Developers")
18 People Stan core (15) Research collaborators (30) Developers (100) User community (1000) 9/44
")
19 People Stan core (15) Research collaborators (30) Developers (100) User community (1000) Users (10000) 9/44
 Users")
20 Funding National Science Foundation Institute for Education Sciences Department of Energy Novartis YouGov 10/44

21 Roles of Stan 11/44
22 Roles of Stan Bayesian inference for unsophisticated users (alternative to Stata, Bugs, etc.) 11/44
23 Roles of Stan Bayesian inference for unsophisticated users (alternative to Stata, Bugs, etc.) Bayesian inference for sophisticated users (alternative to programming it yourself) 11/44
24 Roles of Stan Bayesian inference for unsophisticated users (alternative to Stata, Bugs, etc.) Bayesian inference for sophisticated users (alternative to programming it yourself) Fast and scalable gradient computation 11/44
25 Roles of Stan Bayesian inference for unsophisticated users (alternative to Stata, Bugs, etc.) Bayesian inference for sophisticated users (alternative to programming it yourself) Fast and scalable gradient computation Environment for developing new algorithms 11/44
26 12/44
27 13/44
28 14/44
29 This week, the New York Times and CBS News published a story using, in part, information from a non-probability, opt-in survey sparking concern among many in the polling community. In general, these methods have little grounding in theory and the results can vary widely based on the particular method used. Michael Link, President, American Association for Public Opinion Research 15/44

30 16/44
31 17/44
32 Xbox estimates, adjusting for demographics 18/44
33 19/44

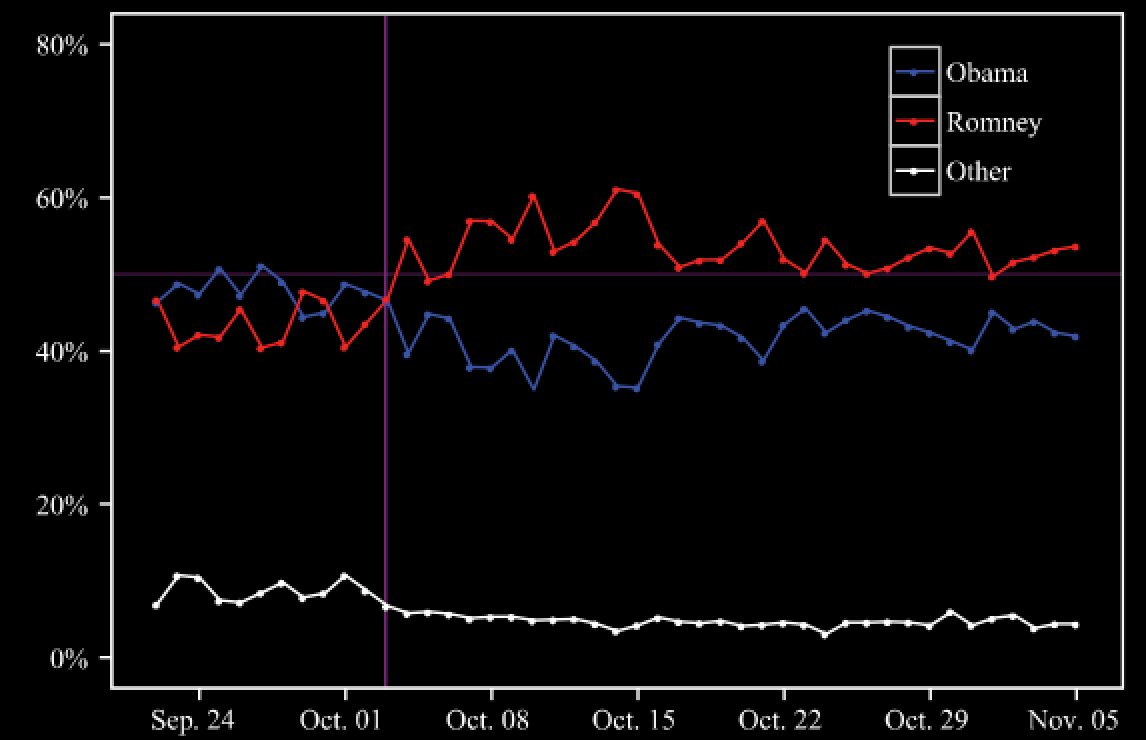
34 Karl Rove, Wall Street Journal, 7 Oct: Mr. Romney s bounce is significant. Nate Silver, New York Times, 6 Oct: Mr. Romney has not only improved his own standing but also taken voters away from Mr. Obama s column. 20/44
35 Xbox estimates, adjusting for demographics and partisanship 21/44

36 Jimmy Carter Republicans and George W. Bush Democrats 22/44
37 23/44

38 24/44
39 Toxicology 25/44
40 Earth science 26/44
41 Lots of other applications Astronomy, ecology, linguistics, epidemiology, soil science,... 27/44
42 Steps of Bayesian data analysis 28/44
43 Steps of Bayesian data analysis Model building 28/44
44 Steps of Bayesian data analysis Model building Inference 28/44
45 Steps of Bayesian data analysis Model building Inference Model checking 28/44
46 Steps of Bayesian data analysis Model building Inference Model checking Model understanding and improvement 28/44
47 Background on Bayesian computation 29/44
48 Background on Bayesian computation Point estimates and standard errors 29/44
49 Background on Bayesian computation Point estimates and standard errors Hierarchical models 29/44
50 Background on Bayesian computation Point estimates and standard errors Hierarchical models Posterior simulation 29/44
51 Background on Bayesian computation Point estimates and standard errors Hierarchical models Posterior simulation Markov chain Monte Carlo (Gibbs sampler and Metropolis algorithm) 29/44
52 Background on Bayesian computation Point estimates and standard errors Hierarchical models Posterior simulation Markov chain Monte Carlo (Gibbs sampler and Metropolis algorithm) Hamiltonian Monte Carlo 29/44
53 Solving problems 30/44
54 Solving problems Problem: Gibbs too slow, Metropolis too problem-specific 30/44
55 Solving problems Problem: Gibbs too slow, Metropolis too problem-specific Solution: Hamiltonian Monte Carlo 30/44
56 Solving problems Problem: Gibbs too slow, Metropolis too problem-specific Solution: Hamiltonian Monte Carlo Problem: Interpreters too slow, won t scale 30/44
57 Solving problems Problem: Gibbs too slow, Metropolis too problem-specific Solution: Hamiltonian Monte Carlo Problem: Interpreters too slow, won t scale Solution: Compilation 30/44
58 Solving problems Problem: Gibbs too slow, Metropolis too problem-specific Solution: Hamiltonian Monte Carlo Problem: Interpreters too slow, won t scale Solution: Compilation Problem: Need gradients of log posterior for HMC 30/44
59 Solving problems Problem: Gibbs too slow, Metropolis too problem-specific Solution: Hamiltonian Monte Carlo Problem: Interpreters too slow, won t scale Solution: Compilation Problem: Need gradients of log posterior for HMC Solution: Reverse-mode algorithmic differentation 30/44
60 Solving problems Problem: Gibbs too slow, Metropolis too problem-specific Solution: Hamiltonian Monte Carlo Problem: Interpreters too slow, won t scale Solution: Compilation Problem: Need gradients of log posterior for HMC Solution: Reverse-mode algorithmic differentation Problem: Existing algo-diff slow, limited, unextensible 30/44
61 Solving problems Problem: Gibbs too slow, Metropolis too problem-specific Solution: Hamiltonian Monte Carlo Problem: Interpreters too slow, won t scale Solution: Compilation Problem: Need gradients of log posterior for HMC Solution: Reverse-mode algorithmic differentation Problem: Existing algo-diff slow, limited, unextensible Solution: Our own algo-diff 30/44
62 Solving problems Problem: Gibbs too slow, Metropolis too problem-specific Solution: Hamiltonian Monte Carlo Problem: Interpreters too slow, won t scale Solution: Compilation Problem: Need gradients of log posterior for HMC Solution: Reverse-mode algorithmic differentation Problem: Existing algo-diff slow, limited, unextensible Solution: Our own algo-diff Problem: Algo-diff requires fully templated functions 30/44
63 Solving problems Problem: Gibbs too slow, Metropolis too problem-specific Solution: Hamiltonian Monte Carlo Problem: Interpreters too slow, won t scale Solution: Compilation Problem: Need gradients of log posterior for HMC Solution: Reverse-mode algorithmic differentation Problem: Existing algo-diff slow, limited, unextensible Solution: Our own algo-diff Problem: Algo-diff requires fully templated functions Solution: Our own density library, Eigen linear algebra 30/44
64 Radford Neal (2011) on Hamiltonian Monte Carlo One practical impediment to the use of Hamiltonian Monte Carlo is the need to select suitable values for the leapfrog stepsize, ɛ, and the number of leapfrog steps L... Tuning HMC will usually require preliminary runs with trial values for ɛ and L... Unfortunately, preliminary runs can be misleading... 31/44
65 The No U-Turn Sampler Created by Matt Hoffman Run the HMC steps until they start to turn around (bend with an angle > 180 ) Computationally efficient Requires no tuning of #steps Complications to preserve detailed balance 32/44
66 Hoffman and Gelman NUTS Example Trajectory Figure 2: Example of a trajectory generated during one iteration of NUTS. The blue ellipse is a contour of the target distribution, the black open circles are the positions θ traced out by the leapfrog integrator and associated with elements of the set of visited states B, the black solid circle is the starting position, the red solid circles are positions associated with states that must be excluded from the set C of possible next samples because their joint probability is below the slice variable u, Gelman Carpenter and thehoffman positionslee withgoodrich a red x through Betancourt them. correspond.. Stan: to states A platform that mustfor be Bayesian inference 33/44
67 Hoffman and Gelman NUTS Example Trajectory Blue ellipse is contour of target distribution Figure 2: Example of a trajectory generated during one iteration of NUTS. The blue ellipse is a contour of the target distribution, the black open circles are the positions θ traced out by the leapfrog integrator and associated with elements of the set of visited states B, the black solid circle is the starting position, the red solid circles are positions associated with states that must be excluded from the set C of possible next samples because their joint probability is below the slice variable u, Gelman Carpenter and thehoffman positionslee withgoodrich a red x through Betancourt them. correspond.. Stan: to states A platform that mustfor be Bayesian inference 33/44
68 Hoffman and Gelman NUTS Example Trajectory Blue ellipse is contour of target distribution Figure 2: Example of a trajectory generated during one iteration of NUTS. The blue ellipse is a contour of the target distribution, the black open circles are the positions θ traced Initial out byposition the leapfrog integrator at black and associated solid with elements of the set of visited states B, the black solid circle is the starting position, the red solid circles are positions associated with states that must be excluded from the set C of possible next samples because their joint probability is below the slice variable u, Gelman Carpenter and thehoffman positionslee withgoodrich a red x through Betancourt them. correspond.. Stan: to states A platform that mustfor be Bayesian inference 33/44
69 Hoffman and Gelman NUTS Example Trajectory Blue ellipse is contour of target distribution Figure 2: Example of a trajectory generated during one iteration of NUTS. The blue ellipse is a contour of the target distribution, the black open circles are the positions θ traced Initial out byposition the leapfrog integrator at black and associated solid with elements of the set of visited states B, the black solid circle is the starting position, the red solid circles are Arrows positions associated indicate with astates U-turn that mustinbe momentum excluded from the set C of possible next samples because their joint probability is below the slice variable u, Gelman Carpenter and thehoffman positionslee withgoodrich a red x through Betancourt them. correspond.. Stan: to states A platform that mustfor be Bayesian inference 33/44
70 NUTS vs. Gibbs andthe Metropolis No-U-Turn Sampler igure 7: Samples generated by random-walk Metropolis, Gibbs sampling, and NUTS. The plots compare 1,000 independent draws from a highly correlated 250-dimensional distribution (right) with 1,000,000 samples (thinned to 1,000 samples for display) generated by random-walk Metropolis (left), 1,000,000 samples (thinned to 1,000 samples for display) generated by Gibbs sampling (second from left), and 1,000 samples generated by NUTS (second from right). Only the first two dimensions are shown here. 34/44
71 NUTS vs. Gibbs andthe Metropolis No-U-Turn Sampler Two dimensions of highly correlated 250-dim distribution igure 7: Samples generated by random-walk Metropolis, Gibbs sampling, and NUTS. The plots compare 1,000 independent draws from a highly correlated 250-dimensional distribution (right) with 1,000,000 samples (thinned to 1,000 samples for display) generated by random-walk Metropolis (left), 1,000,000 samples (thinned to 1,000 samples for display) generated by Gibbs sampling (second from left), and 1,000 samples generated by NUTS (second from right). Only the first two dimensions are shown here. 34/44
72 NUTS vs. Gibbs andthe Metropolis No-U-Turn Sampler Two dimensions of highly correlated 250-dim distribution igure 7: Samples generated by random-walk Metropolis, Gibbs sampling, and NUTS. The plots compare 1M samples 1,000 independent from Metropolis, draws from1ma highly from correlated Gibbs (thin 250-dimensional to 1K) distribution (right) with 1,000,000 samples (thinned to 1,000 samples for display) generated by random-walk Metropolis (left), 1,000,000 samples (thinned to 1,000 samples for display) generated by Gibbs sampling (second from left), and 1,000 samples generated by NUTS (second from right). Only the first two dimensions are shown here. 34/44
73 NUTS vs. Gibbs andthe Metropolis No-U-Turn Sampler Two dimensions of highly correlated 250-dim distribution igure 7: Samples generated by random-walk Metropolis, Gibbs sampling, and NUTS. The plots compare 1M samples 1,000 independent from Metropolis, draws from1ma highly from correlated Gibbs (thin 250-dimensional to 1K) distribu- 1K(right) samples with 1,000,000 from NUTS, samples 1K(thinned independent to 1,000 samples draws for display) generated by tion random-walk Metropolis (left), 1,000,000 samples (thinned to 1,000 samples for display) generated by Gibbs sampling (second from left), and 1,000 samples generated by NUTS (second from right). Only the first two dimensions are shown here. 34/44
74 NUTS vs. Basic HMC 250-D normal and logistic regression models Vertical axis shows effective #sims (big is good) (Left) NUTS; (Right) HMC with increasing t = ɛl 35/44
75 NUTS vs. Basic HMC II Hierarchical logistic regression and stochastic volatility Simulation time is step size ɛ times #steps L NUTS can beat optimally tuned HMC 36/44
76 Solving more problems in Stan 37/44
77 Solving more problems in Stan Problem: Need ease of use of BUGS 37/44
78 Solving more problems in Stan Problem: Need ease of use of BUGS Solution: Compile directed graphical model language 37/44
79 Solving more problems in Stan Problem: Need ease of use of BUGS Solution: Compile directed graphical model language Problem: Need to tune parameters for HMC 37/44
80 Solving more problems in Stan Problem: Need ease of use of BUGS Solution: Compile directed graphical model language Problem: Need to tune parameters for HMC Solution: Auto tuning, adaptation 37/44
81 Solving more problems in Stan Problem: Need ease of use of BUGS Solution: Compile directed graphical model language Problem: Need to tune parameters for HMC Solution: Auto tuning, adaptation Problem: Efficient up-to-proportion density calcs 37/44
82 Solving more problems in Stan Problem: Need ease of use of BUGS Solution: Compile directed graphical model language Problem: Need to tune parameters for HMC Solution: Auto tuning, adaptation Problem: Efficient up-to-proportion density calcs Solution: Density template metaprogramming 37/44
83 Solving more problems in Stan Problem: Need ease of use of BUGS Solution: Compile directed graphical model language Problem: Need to tune parameters for HMC Solution: Auto tuning, adaptation Problem: Efficient up-to-proportion density calcs Solution: Density template metaprogramming Problem: Limited error checking, recovery 37/44
84 Solving more problems in Stan Problem: Need ease of use of BUGS Solution: Compile directed graphical model language Problem: Need to tune parameters for HMC Solution: Auto tuning, adaptation Problem: Efficient up-to-proportion density calcs Solution: Density template metaprogramming Problem: Limited error checking, recovery Solution: Static model typing, informative exceptions 37/44
85 Solving more problems in Stan Problem: Need ease of use of BUGS Solution: Compile directed graphical model language Problem: Need to tune parameters for HMC Solution: Auto tuning, adaptation Problem: Efficient up-to-proportion density calcs Solution: Density template metaprogramming Problem: Limited error checking, recovery Solution: Static model typing, informative exceptions Problem: Poor boundary behavior 37/44
86 Solving more problems in Stan Problem: Need ease of use of BUGS Solution: Compile directed graphical model language Problem: Need to tune parameters for HMC Solution: Auto tuning, adaptation Problem: Efficient up-to-proportion density calcs Solution: Density template metaprogramming Problem: Limited error checking, recovery Solution: Static model typing, informative exceptions Problem: Poor boundary behavior Solution: Calculate limits (e.g. lim x 0 x log x) 37/44
87 Solving more problems in Stan Problem: Need ease of use of BUGS Solution: Compile directed graphical model language Problem: Need to tune parameters for HMC Solution: Auto tuning, adaptation Problem: Efficient up-to-proportion density calcs Solution: Density template metaprogramming Problem: Limited error checking, recovery Solution: Static model typing, informative exceptions Problem: Poor boundary behavior Solution: Calculate limits (e.g. lim x 0 x log x) 37/44
88 Solving more problems in Stan Problem: Need ease of use of BUGS Solution: Compile directed graphical model language Problem: Need to tune parameters for HMC Solution: Auto tuning, adaptation Problem: Efficient up-to-proportion density calcs Solution: Density template metaprogramming Problem: Limited error checking, recovery Solution: Static model typing, informative exceptions Problem: Poor boundary behavior Solution: Calculate limits (e.g. lim x 0 x log x) Problem: Restrictive licensing (e.g., closed, GPL, etc.) 37/44
89 Solving more problems in Stan Problem: Need ease of use of BUGS Solution: Compile directed graphical model language Problem: Need to tune parameters for HMC Solution: Auto tuning, adaptation Problem: Efficient up-to-proportion density calcs Solution: Density template metaprogramming Problem: Limited error checking, recovery Solution: Static model typing, informative exceptions Problem: Poor boundary behavior Solution: Calculate limits (e.g. lim x 0 x log x) Problem: Restrictive licensing (e.g., closed, GPL, etc.) Solution: Open-source, BSD license 37/44
90 New stuff: Differential equation models Simple harmonic oscillator: dz 1 dt dz 2 dt = z 2 = z 1 θz 2 with observations (y 1, y 2 ) t, t = 1,..., T : y 1t N(z 1 (t), σ 2 1) y 2t N(z 2 (t), σ 2 2) Given data (y 1, y 2 ) t, t = 1,..., T, estimate initial state (y 1, y 2 ) t=0 and parameter θ 38/44
91 Stan program: 1 functions { real[] sho(real t, real[] y, real[] theta, real[] x_r, int[] x_i) { real dydt[2]; dydt[1] <- y[2]; dydt[2] <- -y[1] - theta[1] * y[2]; return dydt; } } data { int<lower=1> T; real y[t,2]; real t0; real ts[t]; } transformed data { real x_r[0]; int x_i[0]; } 39/44
92 Stan program: 2 parameters { real y0[2]; vector<lower=0>[2] sigma; real theta[1]; } model { real z[t,2]; sigma ~ cauchy(0,2.5); theta ~ normal(0,1); y0 ~ normal(0,1); z <- integrate_ode(sho, y0, t0, ts, theta, x_r, x_i); for (t in 1:T) y[t] ~ normal(z[t], sigma); } 40/44
93 Stan output Run RStan with data simulated from θ = 0.15, y 0 = (1, 0), and σ = 0.1: Inference for Stan model: sho. 4 chains, each with iter=2000; warmup=1000; thin=1; post-warmup draws per chain=1000, total post-warmup draws=4000. mean se_mean sd 2.5% 25% 50% 75% 97.5% n_eff Rhat y0[1] y0[2] sigma[1] sigma[2] theta[1] lp /44
94 Big Data, Big Model, Scalable Computing Items 100 Items 1000 Items Seconds / Sample Total Ratings 42/44
95 Thinking about scalability 43/44
96 Thinking about scalability Hierarchical item response model: Stan JAGS # items # raters # groups # data time memory time memory 20 2, ,000 :02m 16MB :03m 220MB 40 8, ,000 :16m 92MB :40m 1400MB 80 32, ,560,000 4h:10m 580MB :??m?mb 43/44
97 Thinking about scalability Hierarchical item response model: Stan JAGS # items # raters # groups # data time memory time memory 20 2, ,000 :02m 16MB :03m 220MB 40 8, ,000 :16m 92MB :40m 1400MB 80 32, ,560,000 4h:10m 580MB :??m?mb Also, Stan generated 4x effective sample size per iteration 43/44
98 Future work 44/44
99 Future work Programming 44/44
100 Future work Programming Faster gradients and higher-order derivatives 44/44
101 Future work Programming Faster gradients and higher-order derivatives Functions 44/44
102 Future work Programming Faster gradients and higher-order derivatives Functions Statistical algorithms 44/44
103 Future work Programming Faster gradients and higher-order derivatives Functions Statistical algorithms Riemannian Hamiltonian Monte Carlo 44/44
104 Future work Programming Faster gradients and higher-order derivatives Functions Statistical algorithms Riemannian Hamiltonian Monte Carlo (Penalized) mle 44/44
105 Future work Programming Faster gradients and higher-order derivatives Functions Statistical algorithms Riemannian Hamiltonian Monte Carlo (Penalized) mle (Penalized) marginal mle 44/44
106 Future work Programming Faster gradients and higher-order derivatives Functions Statistical algorithms Riemannian Hamiltonian Monte Carlo (Penalized) mle (Penalized) marginal mle Black-box variational Bayes 44/44
107 Future work Programming Faster gradients and higher-order derivatives Functions Statistical algorithms Riemannian Hamiltonian Monte Carlo (Penalized) mle (Penalized) marginal mle Black-box variational Bayes Data partitioning and expectation propagation 44/44
Section 5. Stan for Big Data. Bob Carpenter. Columbia University
 Section 5. Stan for Big Data Bob Carpenter Columbia University Part I Overview Scaling and Evaluation data size (bytes) 1e18 1e15 1e12 1e9 1e6 Big Model and Big Data approach state of the art big model
Tutorial on Markov Chain Monte Carlo
 Tutorial on Markov Chain Monte Carlo Kenneth M. Hanson Los Alamos National Laboratory Presented at the 29 th International Workshop on Bayesian Inference and Maximum Entropy Methods in Science and Technology,
Gaussian Processes to Speed up Hamiltonian Monte Carlo
 Gaussian Processes to Speed up Hamiltonian Monte Carlo Matthieu Lê Murray, Iain http://videolectures.net/mlss09uk_murray_mcmc/ Rasmussen, Carl Edward. "Gaussian processes to speed up hybrid Monte Carlo
Computational Statistics for Big Data
 Lancaster University Computational Statistics for Big Data Author: 1 Supervisors: Paul Fearnhead 1 Emily Fox 2 1 Lancaster University 2 The University of Washington September 1, 2015 Abstract The amount
Bayesian Machine Learning (ML): Modeling And Inference in Big Data. Zhuhua Cai Google, Rice University [email protected]
: Modeling And Inference in Big Data. Zhuhua Cai Google, Rice University caizhua@gmail.com") Bayesian Machine Learning (ML): Modeling And Inference in Big Data Zhuhua Cai Google Rice University [email protected] 1 Syllabus Bayesian ML Concepts (Today) Bayesian ML on MapReduce (Next morning) Bayesian
Bayesian Machine Learning (ML): Modeling And Inference in Big Data Zhuhua Cai Google Rice University [email protected] 1 Syllabus Bayesian ML Concepts (Today) Bayesian ML on MapReduce (Next morning) Bayesian
STA 4273H: Statistical Machine Learning
 STA 4273H: Statistical Machine Learning Russ Salakhutdinov Department of Statistics! [email protected]! http://www.cs.toronto.edu/~rsalakhu/ Lecture 6 Three Approaches to Classification Construct
MCMC Using Hamiltonian Dynamics
 5 MCMC Using Hamiltonian Dynamics Radford M. Neal 5.1 Introduction Markov chain Monte Carlo (MCMC) originated with the classic paper of Metropolis et al. (1953), where it was used to simulate the distribution
Model-based Synthesis. Tony O Hagan
 Model-based Synthesis Tony O Hagan Stochastic models Synthesising evidence through a statistical model 2 Evidence Synthesis (Session 3), Helsinki, 28/10/11 Graphical modelling The kinds of models that
Logistic Regression. Jia Li. Department of Statistics The Pennsylvania State University. Logistic Regression
 Logistic Regression Department of Statistics The Pennsylvania State University Email: [email protected] Logistic Regression Preserve linear classification boundaries. By the Bayes rule: Ĝ(x) = arg max
PATTERN RECOGNITION AND MACHINE LEARNING CHAPTER 4: LINEAR MODELS FOR CLASSIFICATION
 PATTERN RECOGNITION AND MACHINE LEARNING CHAPTER 4: LINEAR MODELS FOR CLASSIFICATION Introduction In the previous chapter, we explored a class of regression models having particularly simple analytical
A Latent Variable Approach to Validate Credit Rating Systems using R
 A Latent Variable Approach to Validate Credit Rating Systems using R Chicago, April 24, 2009 Bettina Grün a, Paul Hofmarcher a, Kurt Hornik a, Christoph Leitner a, Stefan Pichler a a WU Wien Grün/Hofmarcher/Hornik/Leitner/Pichler
STAT3016 Introduction to Bayesian Data Analysis
 STAT3016 Introduction to Bayesian Data Analysis Course Description The Bayesian approach to statistics assigns probability distributions to both the data and unknown parameters in the problem. This way,
Parallelization Strategies for Multicore Data Analysis
 Parallelization Strategies for Multicore Data Analysis Wei-Chen Chen 1 Russell Zaretzki 2 1 University of Tennessee, Dept of EEB 2 University of Tennessee, Dept. Statistics, Operations, and Management
Lecture 3: Linear methods for classification
 Lecture 3: Linear methods for classification Rafael A. Irizarry and Hector Corrada Bravo February, 2010 Today we describe four specific algorithms useful for classification problems: linear regression,
Bayesian Statistics in One Hour. Patrick Lam
 Bayesian Statistics in One Hour Patrick Lam Outline Introduction Bayesian Models Applications Missing Data Hierarchical Models Outline Introduction Bayesian Models Applications Missing Data Hierarchical
Applications of R Software in Bayesian Data Analysis
 Article International Journal of Information Science and System, 2012, 1(1): 7-23 International Journal of Information Science and System Journal homepage: www.modernscientificpress.com/journals/ijinfosci.aspx
Monte Carlo and Empirical Methods for Stochastic Inference (MASM11/FMS091)
") Monte Carlo and Empirical Methods for Stochastic Inference (MASM11/FMS091) Magnus Wiktorsson Centre for Mathematical Sciences Lund University, Sweden Lecture 5 Sequential Monte Carlo methods I February
Monte Carlo and Empirical Methods for Stochastic Inference (MASM11/FMS091) Magnus Wiktorsson Centre for Mathematical Sciences Lund University, Sweden Lecture 5 Sequential Monte Carlo methods I February
Example: Credit card default, we may be more interested in predicting the probabilty of a default than classifying individuals as default or not.
 Statistical Learning: Chapter 4 Classification 4.1 Introduction Supervised learning with a categorical (Qualitative) response Notation: - Feature vector X, - qualitative response Y, taking values in C
R2MLwiN Using the multilevel modelling software package MLwiN from R
 Using the multilevel modelling software package MLwiN from R Richard Parker Zhengzheng Zhang Chris Charlton George Leckie Bill Browne Centre for Multilevel Modelling (CMM) University of Bristol Using the
Bayesian Statistics: Indian Buffet Process
 Bayesian Statistics: Indian Buffet Process Ilker Yildirim Department of Brain and Cognitive Sciences University of Rochester Rochester, NY 14627 August 2012 Reference: Most of the material in this note
11. Time series and dynamic linear models
 11. Time series and dynamic linear models Objective To introduce the Bayesian approach to the modeling and forecasting of time series. Recommended reading West, M. and Harrison, J. (1997). models, (2 nd
PERFORMANCE ENHANCEMENTS IN TreeAge Pro 2014 R1.0
 PERFORMANCE ENHANCEMENTS IN TreeAge Pro 2014 R1.0 15 th January 2014 Al Chrosny Director, Software Engineering TreeAge Software, Inc. [email protected] Andrew Munzer Director, Training and Customer
Examples. David Ruppert. April 25, 2009. Cornell University. Statistics for Financial Engineering: Some R. Examples. David Ruppert.
 Cornell University April 25, 2009 Outline 1 2 3 4 A little about myself BA and MA in mathematics PhD in statistics in 1977 taught in the statistics department at North Carolina for 10 years have been in
HT2015: SC4 Statistical Data Mining and Machine Learning
 HT2015: SC4 Statistical Data Mining and Machine Learning Dino Sejdinovic Department of Statistics Oxford http://www.stats.ox.ac.uk/~sejdinov/sdmml.html Bayesian Nonparametrics Parametric vs Nonparametric
Monte Carlo-based statistical methods (MASM11/FMS091)
") Monte Carlo-based statistical methods (MASM11/FMS091) Jimmy Olsson Centre for Mathematical Sciences Lund University, Sweden Lecture 5 Sequential Monte Carlo methods I February 5, 2013 J. Olsson Monte Carlo-based
Monte Carlo-based statistical methods (MASM11/FMS091) Jimmy Olsson Centre for Mathematical Sciences Lund University, Sweden Lecture 5 Sequential Monte Carlo methods I February 5, 2013 J. Olsson Monte Carlo-based
Validation of Software for Bayesian Models using Posterior Quantiles. Samantha R. Cook Andrew Gelman Donald B. Rubin DRAFT
 Validation of Software for Bayesian Models using Posterior Quantiles Samantha R. Cook Andrew Gelman Donald B. Rubin DRAFT Abstract We present a simulation-based method designed to establish that software
CSCI567 Machine Learning (Fall 2014)
") CSCI567 Machine Learning (Fall 2014) Drs. Sha & Liu {feisha,yanliu.cs}@usc.edu September 22, 2014 Drs. Sha & Liu ({feisha,yanliu.cs}@usc.edu) CSCI567 Machine Learning (Fall 2014) September 22, 2014 1 /
CSCI567 Machine Learning (Fall 2014) Drs. Sha & Liu {feisha,yanliu.cs}@usc.edu September 22, 2014 Drs. Sha & Liu ({feisha,yanliu.cs}@usc.edu) CSCI567 Machine Learning (Fall 2014) September 22, 2014 1 /
Imperfect Debugging in Software Reliability
 Imperfect Debugging in Software Reliability Tevfik Aktekin and Toros Caglar University of New Hampshire Peter T. Paul College of Business and Economics Department of Decision Sciences and United Health
CS 688 Pattern Recognition Lecture 4. Linear Models for Classification
 CS 688 Pattern Recognition Lecture 4 Linear Models for Classification Probabilistic generative models Probabilistic discriminative models 1 Generative Approach ( x ) p C k p( C k ) Ck p ( ) ( x Ck ) p(
CHAPTER 3 EXAMPLES: REGRESSION AND PATH ANALYSIS
 Examples: Regression And Path Analysis CHAPTER 3 EXAMPLES: REGRESSION AND PATH ANALYSIS Regression analysis with univariate or multivariate dependent variables is a standard procedure for modeling relationships
Machine Learning and Data Mining. Regression Problem. (adapted from) Prof. Alexander Ihler
 Prof. Alexander Ihler") Machine Learning and Data Mining Regression Problem (adapted from) Prof. Alexander Ihler Overview Regression Problem Definition and define parameters ϴ. Prediction using ϴ as parameters Measure the error
Machine Learning and Data Mining Regression Problem (adapted from) Prof. Alexander Ihler Overview Regression Problem Definition and define parameters ϴ. Prediction using ϴ as parameters Measure the error
Bayesian Penalized Methods for High Dimensional Data
 Bayesian Penalized Methods for High Dimensional Data Joseph G. Ibrahim Joint with Hongtu Zhu and Zakaria Khondker What is Covered? Motivation GLRR: Bayesian Generalized Low Rank Regression L2R2: Bayesian
Markov Chain Monte Carlo Simulation Made Simple
 Markov Chain Monte Carlo Simulation Made Simple Alastair Smith Department of Politics New York University April2,2003 1 Markov Chain Monte Carlo (MCMC) simualtion is a powerful technique to perform numerical
Dirichlet Processes A gentle tutorial
 Dirichlet Processes A gentle tutorial SELECT Lab Meeting October 14, 2008 Khalid El-Arini Motivation We are given a data set, and are told that it was generated from a mixture of Gaussian distributions.
Statistics Graduate Courses
 Statistics Graduate Courses STAT 7002--Topics in Statistics-Biological/Physical/Mathematics (cr.arr.).organized study of selected topics. Subjects and earnable credit may vary from semester to semester.
Model Calibration with Open Source Software: R and Friends. Dr. Heiko Frings Mathematical Risk Consulting
 Model with Open Source Software: and Friends Dr. Heiko Frings Mathematical isk Consulting Bern, 01.09.2011 Agenda in a Friends Model with & Friends o o o Overview First instance: An Extreme Value Example
Centre for Central Banking Studies
 Centre for Central Banking Studies Technical Handbook No. 4 Applied Bayesian econometrics for central bankers Andrew Blake and Haroon Mumtaz CCBS Technical Handbook No. 4 Applied Bayesian econometrics
Analysis of Financial Time Series
 Analysis of Financial Time Series Analysis of Financial Time Series Financial Econometrics RUEY S. TSAY University of Chicago A Wiley-Interscience Publication JOHN WILEY & SONS, INC. This book is printed
CCNY. BME I5100: Biomedical Signal Processing. Linear Discrimination. Lucas C. Parra Biomedical Engineering Department City College of New York
 BME I5100: Biomedical Signal Processing Linear Discrimination Lucas C. Parra Biomedical Engineering Department CCNY 1 Schedule Week 1: Introduction Linear, stationary, normal - the stuff biology is not
Two Topics in Parametric Integration Applied to Stochastic Simulation in Industrial Engineering
 Two Topics in Parametric Integration Applied to Stochastic Simulation in Industrial Engineering Department of Industrial Engineering and Management Sciences Northwestern University September 15th, 2014
A Bayesian Model to Enhance Domestic Energy Consumption Forecast
 Proceedings of the 2012 International Conference on Industrial Engineering and Operations Management Istanbul, Turkey, July 3 6, 2012 A Bayesian Model to Enhance Domestic Energy Consumption Forecast Mohammad
PS 271B: Quantitative Methods II. Lecture Notes
 PS 271B: Quantitative Methods II Lecture Notes Langche Zeng [email protected] The Empirical Research Process; Fundamental Methodological Issues 2 Theory; Data; Models/model selection; Estimation; Inference.
Modeling and Analysis of Call Center Arrival Data: A Bayesian Approach
 Modeling and Analysis of Call Center Arrival Data: A Bayesian Approach Refik Soyer * Department of Management Science The George Washington University M. Murat Tarimcilar Department of Management Science
More details on the inputs, functionality, and output can be found below.
 Overview: The SMEEACT (Software for More Efficient, Ethical, and Affordable Clinical Trials) web interface (http://research.mdacc.tmc.edu/smeeactweb) implements a single analysis of a two-armed trial comparing
How To Solve A Sequential Mca Problem
 Monte Carlo-based statistical methods (MASM11/FMS091) Jimmy Olsson Centre for Mathematical Sciences Lund University, Sweden Lecture 6 Sequential Monte Carlo methods II February 3, 2012 Changes in HA1 Problem
Imputing Values to Missing Data
 Imputing Values to Missing Data In federated data, between 30%-70% of the data points will have at least one missing attribute - data wastage if we ignore all records with a missing value Remaining data
Web-based Supplementary Materials for Bayesian Effect Estimation. Accounting for Adjustment Uncertainty by Chi Wang, Giovanni
 1 Web-based Supplementary Materials for Bayesian Effect Estimation Accounting for Adjustment Uncertainty by Chi Wang, Giovanni Parmigiani, and Francesca Dominici In Web Appendix A, we provide detailed
Assignment 2: Option Pricing and the Black-Scholes formula The University of British Columbia Science One CS 2015-2016 Instructor: Michael Gelbart
 Assignment 2: Option Pricing and the Black-Scholes formula The University of British Columbia Science One CS 2015-2016 Instructor: Michael Gelbart Overview Due Thursday, November 12th at 11:59pm Last updated
APPM4720/5720: Fast algorithms for big data. Gunnar Martinsson The University of Colorado at Boulder
 APPM4720/5720: Fast algorithms for big data Gunnar Martinsson The University of Colorado at Boulder Course objectives: The purpose of this course is to teach efficient algorithms for processing very large
Exact Inference for Gaussian Process Regression in case of Big Data with the Cartesian Product Structure
 Exact Inference for Gaussian Process Regression in case of Big Data with the Cartesian Product Structure Belyaev Mikhail 1,2,3, Burnaev Evgeny 1,2,3, Kapushev Yermek 1,2 1 Institute for Information Transmission
Incorporating cost in Bayesian Variable Selection, with application to cost-effective measurement of quality of health care.
 Incorporating cost in Bayesian Variable Selection, with application to cost-effective measurement of quality of health care University of Florida 10th Annual Winter Workshop: Bayesian Model Selection and
These slides follow closely the (English) course textbook Pattern Recognition and Machine Learning by Christopher Bishop
 course textbook Pattern Recognition and Machine Learning by Christopher Bishop") Music and Machine Learning (IFT6080 Winter 08) Prof. Douglas Eck, Université de Montréal These slides follow closely the (English) course textbook Pattern Recognition and Machine Learning by Christopher
Music and Machine Learning (IFT6080 Winter 08) Prof. Douglas Eck, Université de Montréal These slides follow closely the (English) course textbook Pattern Recognition and Machine Learning by Christopher
A Bootstrap Metropolis-Hastings Algorithm for Bayesian Analysis of Big Data
 A Bootstrap Metropolis-Hastings Algorithm for Bayesian Analysis of Big Data Faming Liang University of Florida August 9, 2015 Abstract MCMC methods have proven to be a very powerful tool for analyzing
Supervised Learning (Big Data Analytics)
") Supervised Learning (Big Data Analytics) Vibhav Gogate Department of Computer Science The University of Texas at Dallas Practical advice Goal of Big Data Analytics Uncover patterns in Data. Can be used
Supervised Learning (Big Data Analytics) Vibhav Gogate Department of Computer Science The University of Texas at Dallas Practical advice Goal of Big Data Analytics Uncover patterns in Data. Can be used
Big Data, Statistics, and the Internet
 Big Data, Statistics, and the Internet Steven L. Scott April, 4 Steve Scott (Google) Big Data, Statistics, and the Internet April, 4 / 39 Summary Big data live on more than one machine. Computing takes
Recent Developments of Statistical Application in. Finance. Ruey S. Tsay. Graduate School of Business. The University of Chicago
 Recent Developments of Statistical Application in Finance Ruey S. Tsay Graduate School of Business The University of Chicago Guanghua Conference, June 2004 Summary Focus on two parts: Applications in Finance:
A Bayesian Antidote Against Strategy Sprawl
 A Bayesian Antidote Against Strategy Sprawl Benjamin Scheibehenne ([email protected]) University of Basel, Missionsstrasse 62a 4055 Basel, Switzerland & Jörg Rieskamp ([email protected])
Bayesian Hidden Markov Models for Alcoholism Treatment Tria
 Bayesian Hidden Markov Models for Alcoholism Treatment Trial Data May 12, 2008 Co-Authors Dylan Small, Statistics Department, UPenn Kevin Lynch, Treatment Research Center, Upenn Steve Maisto, Psychology
CHAPTER 5 PREDICTIVE MODELING STUDIES TO DETERMINE THE CONVEYING VELOCITY OF PARTS ON VIBRATORY FEEDER
 93 CHAPTER 5 PREDICTIVE MODELING STUDIES TO DETERMINE THE CONVEYING VELOCITY OF PARTS ON VIBRATORY FEEDER 5.1 INTRODUCTION The development of an active trap based feeder for handling brakeliners was discussed
Logistic Regression (1/24/13)
") STA63/CBB540: Statistical methods in computational biology Logistic Regression (/24/3) Lecturer: Barbara Engelhardt Scribe: Dinesh Manandhar Introduction Logistic regression is model for regression used
STA63/CBB540: Statistical methods in computational biology Logistic Regression (/24/3) Lecturer: Barbara Engelhardt Scribe: Dinesh Manandhar Introduction Logistic regression is model for regression used
Machine Learning and Pattern Recognition Logistic Regression
 Machine Learning and Pattern Recognition Logistic Regression Course Lecturer:Amos J Storkey Institute for Adaptive and Neural Computation School of Informatics University of Edinburgh Crichton Street,
Optimizing Prediction with Hierarchical Models: Bayesian Clustering
 1 Technical Report 06/93, (August 30, 1993). Presidencia de la Generalidad. Caballeros 9, 46001 - Valencia, Spain. Tel. (34)(6) 386.6138, Fax (34)(6) 386.3626, e-mail: [email protected] Optimizing Prediction
Sampling for Bayesian computation with large datasets
 Sampling for Bayesian computation with large datasets Zaiying Huang Andrew Gelman April 27, 2005 Abstract Multilevel models are extremely useful in handling large hierarchical datasets. However, computation
Linear Threshold Units
 Linear Threshold Units w x hx (... w n x n w We assume that each feature x j and each weight w j is a real number (we will relax this later) We will study three different algorithms for learning linear
Statistics & Probability PhD Research. 15th November 2014
 Statistics & Probability PhD Research 15th November 2014 1 Statistics Statistical research is the development and application of methods to infer underlying structure from data. Broad areas of statistics
Introduction to nonparametric regression: Least squares vs. Nearest neighbors
 Introduction to nonparametric regression: Least squares vs. Nearest neighbors Patrick Breheny October 30 Patrick Breheny STA 621: Nonparametric Statistics 1/16 Introduction For the remainder of the course,
Logistic Regression for Spam Filtering
 Logistic Regression for Spam Filtering Nikhila Arkalgud February 14, 28 Abstract The goal of the spam filtering problem is to identify an email as a spam or not spam. One of the classic techniques used
An Introduction to Using WinBUGS for Cost-Effectiveness Analyses in Health Economics
 Slide 1 An Introduction to Using WinBUGS for Cost-Effectiveness Analyses in Health Economics Dr. Christian Asseburg Centre for Health Economics Part 1 Slide 2 Talk overview Foundations of Bayesian statistics
Dealing with large datasets
 Dealing with large datasets (by throwing away most of the data) Alan Heavens Institute for Astronomy, University of Edinburgh with Ben Panter, Rob Tweedie, Mark Bastin, Will Hossack, Keith McKellar, Trevor
Monte Carlo-based statistical methods (MASM11/FMS091)
") Monte Carlo-based statistical methods (MASM11/FMS091) Magnus Wiktorsson Centre for Mathematical Sciences Lund University, Sweden Lecture 6 Sequential Monte Carlo methods II February 7, 2014 M. Wiktorsson
Monte Carlo-based statistical methods (MASM11/FMS091) Magnus Wiktorsson Centre for Mathematical Sciences Lund University, Sweden Lecture 6 Sequential Monte Carlo methods II February 7, 2014 M. Wiktorsson
Spatial Statistics Chapter 3 Basics of areal data and areal data modeling
 Spatial Statistics Chapter 3 Basics of areal data and areal data modeling Recall areal data also known as lattice data are data Y (s), s D where D is a discrete index set. This usually corresponds to data
MSCA 31000 Introduction to Statistical Concepts
 MSCA 31000 Introduction to Statistical Concepts This course provides general exposure to basic statistical concepts that are necessary for students to understand the content presented in more advanced
Machine Learning Logistic Regression
 Machine Learning Logistic Regression Jeff Howbert Introduction to Machine Learning Winter 2012 1 Logistic regression Name is somewhat misleading. Really a technique for classification, not regression.
Christfried Webers. Canberra February June 2015
 c Statistical Group and College of Engineering and Computer Science Canberra February June (Many figures from C. M. Bishop, "Pattern Recognition and ") 1of 829 c Part VIII Linear Classification 2 Logistic
A logistic approximation to the cumulative normal distribution
 A logistic approximation to the cumulative normal distribution Shannon R. Bowling 1 ; Mohammad T. Khasawneh 2 ; Sittichai Kaewkuekool 3 ; Byung Rae Cho 4 1 Old Dominion University (USA); 2 State University
Principles of Data Mining by Hand&Mannila&Smyth
 Principles of Data Mining by Hand&Mannila&Smyth Slides for Textbook Ari Visa,, Institute of Signal Processing Tampere University of Technology October 4, 2010 Data Mining: Concepts and Techniques 1 Differences
WAIC and cross-validation in Stan
 WAIC and cross-validation in Stan Aki Vehtari Andrew Gelman 31 May 2014 Abstract The Watanabe-Akaike information criterion (WAIC) and cross-validation are methods for estimating pointwise out-of-sample
Machine Learning for Data Science (CS4786) Lecture 1
 Lecture 1") Machine Learning for Data Science (CS4786) Lecture 1 Tu-Th 10:10 to 11:25 AM Hollister B14 Instructors : Lillian Lee and Karthik Sridharan ROUGH DETAILS ABOUT THE COURSE Diagnostic assignment 0 is out:
Machine Learning for Data Science (CS4786) Lecture 1 Tu-Th 10:10 to 11:25 AM Hollister B14 Instructors : Lillian Lee and Karthik Sridharan ROUGH DETAILS ABOUT THE COURSE Diagnostic assignment 0 is out:
itesla Project Innovative Tools for Electrical System Security within Large Areas
 itesla Project Innovative Tools for Electrical System Security within Large Areas Samir ISSAD RTE France [email protected] PSCC 2014 Panel Session 22/08/2014 Advanced data-driven modeling techniques
Statistics in Applications III. Distribution Theory and Inference
 2.2 Master of Science Degrees The Department of Statistics at FSU offers three different options for an MS degree. 1. The applied statistics degree is for a student preparing for a career as an applied
Analyzing Clinical Trial Data via the Bayesian Multiple Logistic Random Effects Model
 Analyzing Clinical Trial Data via the Bayesian Multiple Logistic Random Effects Model Bartolucci, A.A 1, Singh, K.P 2 and Bae, S.J 2 1 Dept. of Biostatistics, University of Alabama at Birmingham, Birmingham,
How To Understand The Theory Of Probability
 Graduate Programs in Statistics Course Titles STAT 100 CALCULUS AND MATR IX ALGEBRA FOR STATISTICS. Differential and integral calculus; infinite series; matrix algebra STAT 195 INTRODUCTION TO MATHEMATICAL
Mohr s Circle. Academic Resource Center
 Mohr s Circle Academic Resource Center Introduction The transformation equations for plane stress can be represented in graphical form by a plot known as Mohr s Circle. This graphical representation is
Deterministic Sampling-based Switching Kalman Filtering for Vehicle Tracking
 Proceedings of the IEEE ITSC 2006 2006 IEEE Intelligent Transportation Systems Conference Toronto, Canada, September 17-20, 2006 WA4.1 Deterministic Sampling-based Switching Kalman Filtering for Vehicle
Microclustering: When the Cluster Sizes Grow Sublinearly with the Size of the Data Set
 Microclustering: When the Cluster Sizes Grow Sublinearly with the Size of the Data Set Jeffrey W. Miller Brenda Betancourt Abbas Zaidi Hanna Wallach Rebecca C. Steorts Abstract Most generative models for
Nonlinear Regression:
 Zurich University of Applied Sciences School of Engineering IDP Institute of Data Analysis and Process Design Nonlinear Regression: A Powerful Tool With Considerable Complexity Half-Day : Improved Inference
Discrete Frobenius-Perron Tracking
 Discrete Frobenius-Perron Tracing Barend J. van Wy and Michaël A. van Wy French South-African Technical Institute in Electronics at the Tshwane University of Technology Staatsartillerie Road, Pretoria,
Machine Learning with MATLAB David Willingham Application Engineer
 Machine Learning with MATLAB David Willingham Application Engineer 2014 The MathWorks, Inc. 1 Goals Overview of machine learning Machine learning models & techniques available in MATLAB Streamlining the
Software support for economic research at CNB
 Software support for economic research at CNB Modern tools for financial analysis and modeling František Brázdik Macroeconomic Forecasting Division [email protected] Czech National Bank May 23,
Probabilistic Models for Big Data. Alex Davies and Roger Frigola University of Cambridge 13th February 2014
 Probabilistic Models for Big Data Alex Davies and Roger Frigola University of Cambridge 13th February 2014 The State of Big Data Why probabilistic models for Big Data? 1. If you don t have to worry about
Exercise 1.12 (Pg. 22-23)
") Individuals: The objects that are described by a set of data. They may be people, animals, things, etc. (Also referred to as Cases or Records) Variables: The characteristics recorded about each individual.
Individuals: The objects that are described by a set of data. They may be people, animals, things, etc. (Also referred to as Cases or Records) Variables: The characteristics recorded about each individual.
3.2 Sources, Sinks, Saddles, and Spirals
 3.2. Sources, Sinks, Saddles, and Spirals 6 3.2 Sources, Sinks, Saddles, and Spirals The pictures in this section show solutions to Ay 00 C By 0 C Cy D 0. These are linear equations with constant coefficients
Bayesian Estimation Supersedes the t-test
 Bayesian Estimation Supersedes the t-test Mike Meredith and John Kruschke December 25, 2015 1 Introduction The BEST package provides a Bayesian alternative to a t test, providing much richer information