VISUAL ANALYTICS OVERVIEW
|
|
|
- Lee James
- 8 years ago
- Views:
Transcription

1 SAS VISUAL ANALYTICS OVERVIEW CONTEMPORARY TRENDS DAY - TIRANA 22 OCT 2015


2 TWO MINDSETS Requirements-based Integrate and Re-use Robust Top-down Approach Business Intelligence and Analytics Opportunity-based Immediate Use Agile and Exploratory Bottom-up Experiments
3 TOP REASONS FOR NOT USING BUSINESS INTELLIGENCE 44% Don t have all the data you need 41% Don t have the right attribute, relationships, or hierarchies 35% Are too restrictive in the data models 33% Don t allow to clean and integrate the data 28% Takes too long to get results Are too complex, cumbersome and complicated to use 28% Source: Forrester s BI Technographics Global Data and Analytics Survey, 2014

4 BUSINESS INTELLIGENCE & ANALYTICS MARKET THEMES Managed BI Managed Self-Service Self-service BI & Analytics Cloud Social Intelligence Analytical Visualization Data Wrangling Mobile
5 GARTNER: MAGIC QUADRANT FOR ADVANCED ANALYTIC PLATFORMS Gartner defines advanced analytics as, "the analysis of all kinds of data using sophisticated quantitative methods (for example, statistics, descriptive and predictive data mining, simulation and optimization) to produce insights that traditional approaches to business intelligence (BI) such as query and reporting are unlikely to discover." Gartner Magic Quadrant for Advanced Analytics Platforms by Gareth Herschel, Alexander Linden, Lisa Kart, 19 February This graphic was published by Gartner, Inc. as part of a larger research document and should be evaluated in the context of the entire document. The Gartner document is available upon request from SAS. Gartner does not endorse any vendor, product or service depicted in its research publications, and does not advise technology users to select only those vendors with the highest ratings or other designation. Gartner research publications consist of the opinions of Gartner's research organization and should not be construed as statements of fact. Gartner disclaims all warranties, expressed or implied, with respect to this research, including any warranties of merchantability or fitness for a particular purpose.
6
7 SAS VISUAL ANALYTICS Self-service Data Preparation SAS Visual Analytics Interactive Reporting & Dashboards Data Exploration Approachable Analytics
8 SAS VISUAL ANALYTICS Import and join data from variety of sources Self-Service Data Preparation Create column expressions and filter data Manage, run and schedule data queries Pivot rows into new columns Load tables, append tables & rows in-memory
9 SAS VISUAL ANALYTICS On-the-fly hierarchies for drill-down Interactive Reporting & Dashboards Tile & precision layouts for flexible design Predefined filters, groupings, formatting Add variety of charts & action elements Range or threshold alerts; Dashboards
10 SAS VISUAL ANALYTICS Autocharting chooses the best suitable graph Data Exploration What does it mean? for predictive relationships Interactive visuals to tell a compelling story Hierarchies, aggregations, dynamic filtering Add comments, share & collaborate
11 SAS VISUAL ANALYTICS Descriptive analytics, incl. correlations Approachable Analytics Forecasting and Scenario Analysis Text Analysis, including sentiment Decision Trees for classification Path Analysis


12 COLLABORATION AND INFORMATION SHARING MOBILE BI COLLABORATION APPLICATIONS DESKTOP APPLICATIONS WEB VISUALIZATIONS REPORTS DASHBOARDS COMMENTS INSIGHTS


13 SAS VISUAL ANALYTICS MEETING YOUR BUSINESS NEEDS THROUGH FLEXIBILITY SSOD SAS In-Memory Analytics Traditional on premise Deployments Public Private SAS Visual Analytics for SAS Cloud
14 CUSTOMER SUCCESS STORIES
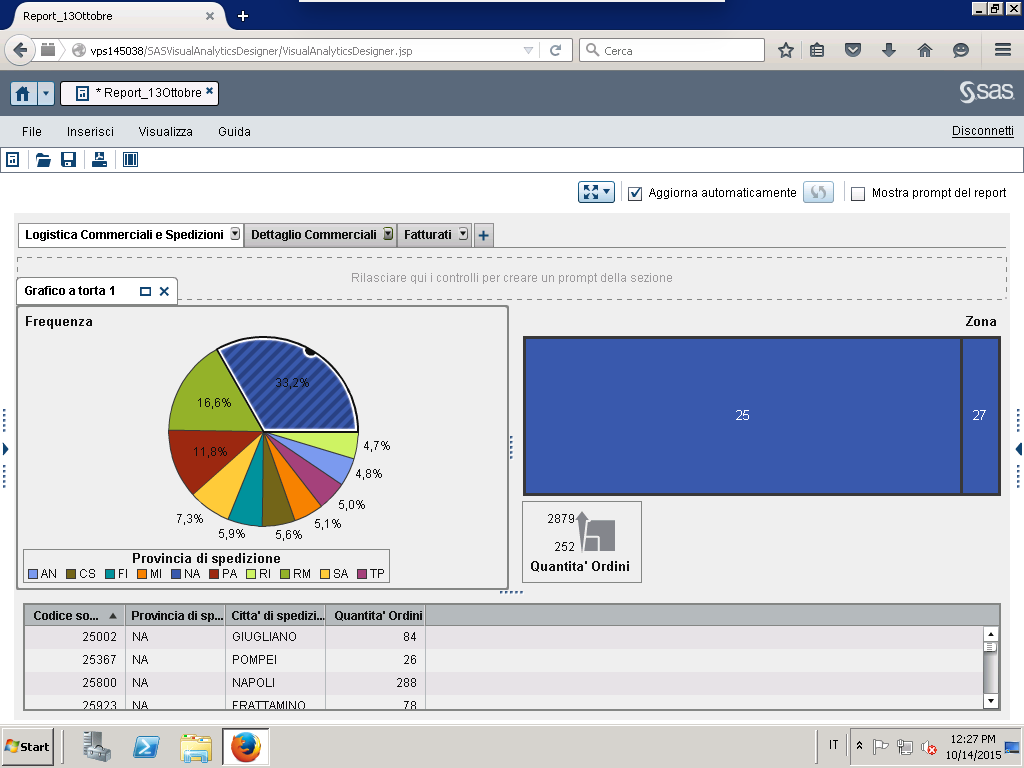
15 DIRECT SALES Stanhome Stanhome is a direct sales company that distributes household, health and beautyproducts Stanhome is a company from Yves Rochergroup The Italian subsidiary was founded in 1962 With a capillary sales structure divided into zones, Branches, Groups & Agents Input Data from AS400 in csv and xls formats Approximately 25GB of data 10 Power Users (from which 5 are concurrent) 200 Light Users (from which 40 are concurrent) Copyr i g ht 2014, SAS Ins titut e Inc. All rights res er ve d.

16 Stanhome Italia & SAS Visual Analytics Requirements: For all the reports a temporal filter must be taken into consideration (from year/wk - to year/wk) selectable by the end user All reports must be published with a cascade of permissions. In terms of consultation by the management, it should be able to "navigate" between different levels (Zones, Branches, Groups) At each closing week /cycle indicators must be available (total sales, gross sales for Brand, Recruitment, Order, Average amount of the Order, Lists, Actives) at the Branch and Area levels. The reports must be interactive (not only with a table view but also through graphs and dashboards).
. Sale Analysis: These are reports that allow the visualization of the on goingr evenue (by type goods / line of product / sale type.")
17 Stanhome Italia & SAS Visual Analytics Requirements: Cycle Initiatives Analysis: At each closing cycle, there have to be provided reports containing sold net / quantity / NSP / Cos% /% Disc. per Brand and Type of Offer (both cycle and YTD). Sale Analysis: These are reports that allow the visualization of the on goingr evenue (by type goods / line of product / sale type...) and let visualize the% variance comparing to the same period of the previous year.
18 Stanhome Italia & SAS Visual Analytics Next Steps: The ETL from AS400 is not under management in Stanhome Italy. Any change request takes time and money for its implementation. For this reason Stanhome has required to analyze the possibility of implementing an additional module of SAS (SAS Data Integration) that would make them independent Stanhome has asked to deepen the SAS solution for the Customer Intelligence
19
20
21

22

23

24

25 TRANSPORTATION The corporate dashboard stands for a management synthesis tool aimed to support strategic and operative choices of ADP, inside the following domains : Control of profit performance, finance, efficiency/productivity, quality, timely verification of company growth and mission; Early detection of possibly critical events through alerts; The definition of a person in charge for each aim chosen and of each indicator linked to it inside ADP company. Copyr i g ht 2014, SAS Ins titut e Inc. All rights res er ve d.
26 FIELD OF APPLICATION ADP Corporate dashboard is used for two types of performance: 1. The first one is linked to Finance; in order to analise all economic-financial information of ADP for the all Company; 2. The second one is Operative; regarding the specific activies performed by each airport handled by ADP.
27 FIELD OF APPLICATION The Finance performance is controlled through economic-patrimonial indicators defined by ADP Managenet. PERFORMANCE FINANZIARIA
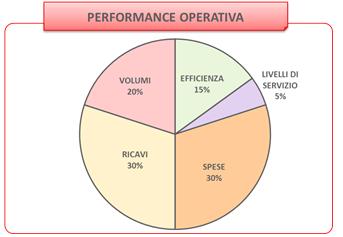
28 FIELD OF APPLICATION In order to evaluate the Operative Performance, AdP has defined different Business Units, each one with its own dashboard to control, for each specifical area created, for istance: staff, handling, ticketing and lost and found.etc etc PERFORMANCE OPERATIVA AREA TECNICA 20% STAFF 15% HANDLING 20% PRM 5% BIGLIETTERIA LOST&FOUND 5% COMMERCIALE EXTRA AVIATION 15% SECURITY 5% SVILUPPO AVIATION
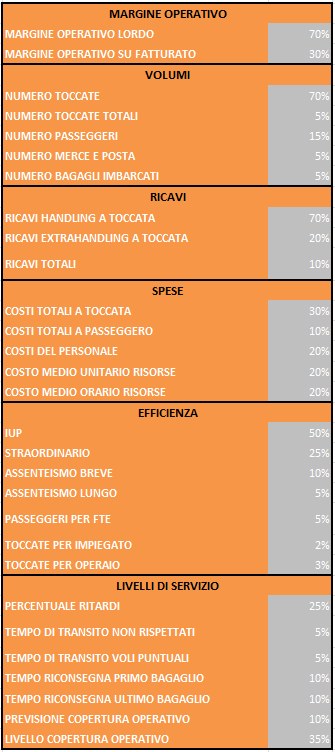
29 KPI ADP has defined a percentage of importance for each indicator inside the business Unit. At the same time, each indicator is considered as: present value, that is the final value of the indicator for the period examined; target value: that is the value chosen as goal. This value can be also an airport benchmark or a budget Company value expressly chosen by management
30 KPI If the present value is higher or lower than the target value according to the spercific trend of the indicator, the performance can assume three range of evaluation: red: negative performance, values between 0% and 80% yellow: accettable performance, values between 80% and100% Green : positive performance, values between 100% and 150%.
31 KPI Each indicator has three sublevels: 1 Level: general key indicator 2 level: general Key indicator devided for each airport (Bari e Brindisi) 3 Level: deeper level of the general Key indicator, according to the economic-operative caracterstics of the area.

32 System Information flow Chart
33 FINANCE
34 FINANCE
35 HANDLING
36 HANDLING

37 AVIATION
38 AVIATION


39 FINANCIAL SERVICES MANAGEMENT CONTROL MODEL ANALYSIS The Management Control model, is the solution for the processing, exploratory and visual analysis of the data provide by various banks participating in the model. Among the major benefits that are highlighted - Greater autonomy of the business user in data analysis - Ability to obtain accurate information and to discover hidden opportunities in the data analysis through fast, affordable to everyone analysis - Simplifying and speeding up the sharing information process among different users Using the techniques of data discovery, it helps to overcome many critical issues, such as: - The high number of data to verify and investigate - The multiplicity of the dimensions of present analysis - The risk of focusing on unimportant situations Copyr i g ht 2014, SAS Ins titut e Inc. All rights res er ve d.


40 INFORMATION FLOW


41 FROM REAL COSTS TO PRICE
42 MANAGEMENT CONTROL MODEL ANALYSIS Reference period; Business Unit: All Single Business Unit Product: All Single Business Unit Clients: All Single Business Unit Type of Balance: Actual Month Average Average in the reference period EACH USER WILL BE ABLE TO SEE ONLY DATA RELATED TO ITS OWN BRANCH

43 LOCAL AUTHORITIES Regione Puglia: Corolla Project - Consolidated financial statements/balance The Corolla Project comes essentially from two needs: Initiating the process of accounting harmonization and consolidation as established by Legislative Decree no. 118/11, whose trial is now completed and the provisions of which is fully implemented since 1 January Establishing a dedicated and structured communication path to enable the exchange of data and information between the Puglia Region and the regional Agencies, participating Companies and Organizations, Entities subject to control and supervision. Copyr i g ht 2014, SAS Ins titut e Inc. All rights res er ve d.
44 PROJECT DEVELOPMENT MACRO AREAS Analysis of the accounting data of the participating Societies, agencies and other bodies of the region of Puglia and definition of the metamodel (metamodello) for the implementation of the platform for business intelligence, management of information flows, harmonization of accounting systems and data analysis Development of a platform of communication to and from the controlled entities for the acquisition and control of defined flows relevant for the control, harmonization and consolidation of budgets and implementation and customization of the "Consolidated WEB" solution based on SAS technology:
45 FROM THE ANALYSIS TO THE DEFINITION OF THE METAMODEL: THE PROJECT AREAS 1. Upload data from the Authorities Local Entities must: keep up to date their data in the platform (ei. Personal details); insert in the platform the accounting information (Financial Statement; Intercompany Parties; Variations and events relevant to the consolidation); insert in the platform documents useful to the purposes of their informative obligations (Statutes, Minute of meetings, data on personnel, appointments and remuneration). 2. Information Control Information will be controlled according to the criteria defined by the Region of Puglia. 3. Harmonization Modify the form of the balance to adapt it to the balance target schema
46 COROLLA WEB PORTAL One of the strengths of the project Corolla is the web portal through which the Region of Puglia and the various entities exchange information. Through the portal itself several features are made available to the companies: - Entity Registry (with update possibilities) - Synthesis of economic data - Registry of entity offices - Registry of the current and previous mandate Entities organs - Acquisition relevant acts - Financial Monitoring In addition, the portal makes available a document area through which both the regional entity and individual companies can use to archive documents not necessarily structured: a real feature of document management.

47 COROLLA WEB PORTAL ENTITY REGISTRY Società di cartolarizzazione Società controllata Società in house Partecipata Agenzia Regionale Agrocoltura, silvicoltura e pesca Estrazione di minerai da cave e miniere Attività manifatturiere Fornitura Energia Elettrica, GAS Fornitura di Acqua, reti fognarie,.. Costruzioni Commercio all ingrosso e al dettaglio.. Imprese non classificate Consolidamento Armonizzazione Controllo Pubblica tot pubblica Unico socio Pubblica tot pubblica con più soci Mista con prevalenta pubblica Mista con prevalenza privata Partecipazione paritaria Privata società di capitali In Attività In Liquidazione Commissariata Non attiva Cessata

48 HARMONIZATION AREA From the charts of accounts and financial statements analysis of the individual entities, initiates the harmonization process of their budgets towards a scheme of budgets or targets towards which will take place the consolidation operations. The budget target schema has been defined on the basis of the provisions of Legislative Decree no. 118/11 (Annex 11) and based on the information requirements finalized at the consolidation process. The harmonization procedures were defined transcoding the budget items of individual entities in the financial statements of the target schema. The harmonization procedures are carried out by the solution.
49 Following the harmonization process, the solution allows us to elaborate a budgetanalysis. This analysis gets developed in two ways: CONTROL: BUDGET ANALYSIS AREA 1. Budget Reclassification The solution carries out a procedure for budget reclassification, which would develop standard aggregates budget for individual institutions so as to allow the Puglia Region an economic monitoring of entities and the possibility of comparison among them.. 2. Budget Indicator From the harmonized data and the model of reclassification, the solution will enhance a number of financial indicators (ratios of profitability, patrimonial analysis, financial analysis, etc.). SINTESI DEGLI INDICI DI BILANCIO RICLASSIFICAZIONE DI CONTO ECONOMICO ESERC. n ESERC. N-1 A) VALORE DELLA PRODUZIONE 1 - Proventi da tributi 2 - Proventi da fondi perequativi 3 - Proventi da trasferimenti e contributi 4 - Ricavi delle vendite e prestazioni e proventi da servizi pubblici 5 - Variazioni nelle rimanenze di prodotti in corso di lavorazione, etc. (+/ Variazione dei lavori in corso su ordinazione 7 - Incrementi di immobilizzazioni per lavori interni 8 - Altri ricavi e proventi diversi TOTALE VALORE DELLA PRODUZIONE (A) - - B) CONSUMI 1 - Acquisto di materie prime e/o beni di consumo 2 - Variazioni nelle rimanenze di materie prime e/o beni di consumo (+/ Prestazioni di servizi 4 - Utilizzo beni di terzi 5 - Trasferimenti e contributi TOTALE CONSUMI (B) - - VALORE AGGIUNTO (A-B) - - C) COSTO DEL LAVORO 1 - Personale MARGINE OPERATIVO LORDO (MOL) (A-B-C) - - EBITDA 0% 0% D) AMMORTAMENTI, ACCANTONAMENTI E ONERI DI GESTIONE 1 - Ammortamenti e svalutazioni 2 - Ammortamenti di immobilizzazioni Immateriali 3 - Ammortamenti di immobilizzazioni materiali ANALISI REDDITIVITA' AZIENDALE (prima delibera distribuzione dividendi INDICE RAZIONALE FORMULA Anno n Anno n-1 Anno n-2 ROE (Return On Equity) (con capitale proprio inizio anno) Redditività del capitale proprio (Re/Cp)*100 >Rendimento Cct/Bot Incidenza gestione non caratteristica Incidenza della gestione non caratteristica sulla redditività complessiva (Re/Ro)x100 < 100% se industriale LEVERAGE (Leva Fnanziaria) Indice di indebitamento (Ti/Cp) se >3 rischio ROI (Return On Investment) Redditività del capitale investito (Ro/Ti)*100 bene se > Rod ROS (Return On Sales) Risultato operativo medio per unità di ricavo (Ro/Rv)*100 dipende da settore ROD (Return On Debt) Indice di onerosità del capitale preso a prestito da terzi (Of/Cd)*100 Rod<Roi Tasso di dipendenza da Regione Puglia Incidenza dei trasferimenti da Regione sul totale dei ricavi (Trasf/Ricavi totali)*100
50 CONSOLIDATED: ADMINISTRATION OF THE CONSOLIDATION PROCESS AREA The model implemented allows to analyze the data according to different viewpoints and dimensions: 1. Budgets database of individual entities according to their accounting plan. 2. Data harmonized to budget typology for individual entities according to configurable harmonizing rules 3. Consolidated data according to different consolidation levels. 4. Reclassification of consolidated budget and financial statements 5. Analysis of the contribution / results of each phase of the consolidation process (proportional method, aggregate, intercompany elimination, etc...) The solution provides the operational instrument through which the Region Consolidator will build the consolidated financial statements of the Puglia Region.
51 CASE STUDY SUMMARY Direct Sales Transportation Financial Institutes Local Authorities


52 THANK YOU
CALIFORNIA MUNICIPAL RATES GROUP SAS VISUAL ANALYTICS APRIL 29, 2016 JENNIFER WHALEY, SR SYSTEMS ENGINEER
 CALIFORNIA MUNICIPAL RATES GROUP SAS VISUAL ANALYTICS APRIL 29, 2016 JENNIFER WHALEY, SR SYSTEMS ENGINEER WHO IS SAS? UTILITIES SAS STRENGTH IN THE INDUSTRY 500 energy customers worldwide 100% of Fortune500
Bilancio al 31 dicembre 2003 Balance sheet as at 31 December 2003 ATTIVI ASSETS
 Bilancio al 31 dicembre 2003 Balance sheet as at 31 December 2003 ATTIVI ASSETS Liquidità 12/31/2003 2.912.774,33 12/31/2002 1.680.863,78 Liquid asset Crediti verso banche 106.530.505,08 63.142.592,75
Data Mining, Predictive Analytics with Microsoft Analysis Services and Excel PowerPivot
 www.etidaho.com (208) 327-0768 Data Mining, Predictive Analytics with Microsoft Analysis Services and Excel PowerPivot 3 Days About this Course This course is designed for the end users and analysts that
Introduction to Oracle Business Intelligence Standard Edition One. Mike Donohue Senior Manager, Product Management Oracle Business Intelligence
 Introduction to Oracle Business Intelligence Standard Edition One Mike Donohue Senior Manager, Product Management Oracle Business Intelligence The following is intended to outline our general product direction.
Business Intelligence with SharePoint 2010
 Business Intelligence with SharePoint 2010 August 2011 Asad Mahmood Head Of Business Analytics Consulting E: asad.mahmood@contemporary.co.uk T: @MrAsadMahmood Symon Garfield Chief Technology Officer E:
White Paper. Redefine Your Analytics Journey With Self-Service Data Discovery and Interactive Predictive Analytics
 White Paper Redefine Your Analytics Journey With Self-Service Data Discovery and Interactive Predictive Analytics Contents Self-service data discovery and interactive predictive analytics... 1 What does
DRIVING THE CHANGE ENABLING TECHNOLOGY FOR FINANCE 15 TH FINANCE TECH FORUM SOFIA, BULGARIA APRIL 25 2013
 DRIVING THE CHANGE ENABLING TECHNOLOGY FOR FINANCE 15 TH FINANCE TECH FORUM SOFIA, BULGARIA APRIL 25 2013 BRAD HATHAWAY REGIONAL LEADER FOR INFORMATION MANAGEMENT AGENDA Major Technology Trends Focus on
Common Situations. Departments choosing best in class solutions for their specific needs. Lack of coordinated BI strategy across the enterprise
 Common Situations Lack of coordinated BI strategy across the enterprise Departments choosing best in class solutions for their specific needs Acquisitions of companies using different BI tools 2 3-5 BI
Business Intelligence. A Presentation of the Current Lead Solutions and a Comparative Analysis of the Main Providers
 60 Business Intelligence. A Presentation of the Current Lead Solutions and a Comparative Analysis of the Main Providers Business Intelligence. A Presentation of the Current Lead Solutions and a Comparative
"The performance driven Enterprise" Emerging trends in Enterprise BI Platforms
 1 Month, Day, Year Venue City "The performance driven Enterprise" Emerging trends in Enterprise BI Platforms Kostiantyn Stupak Oracle BI representative in Ukraine 2 The Race to Gain Insight 2014? 50% 2009
IBM Cognos Express Essential BI and planning for midsize companies
 Data Sheet IBM Cognos Express Essential BI and planning for midsize companies Overview IBM Cognos Express is the first and only integrated business intelligence (BI) and planning solution purposebuilt
Create Mobile, Compelling Dashboards with Trusted Business Warehouse Data
 SAP Brief SAP BusinessObjects Business Intelligence s SAP BusinessObjects Design Studio Objectives Create Mobile, Compelling Dashboards with Trusted Business Warehouse Data Increase the value of data with
Session 805 -End-to-End SAP Lumira: Desktop to On-Premise, Cloud, and Mobile
 September 9 11, 2013 Anaheim, California Session 805 -End-to-End SAP Lumira: Desktop to On-Premise, Cloud, and Mobile Ashish C. Morzaria, SAP Disclaimer This presentation outlines our general product direction
Self-Service Business Intelligence
 Self-Service Business Intelligence BRIDGE THE GAP VISUALIZE DATA, DISCOVER TRENDS, SHARE FINDINGS Solgenia Analysis provides users throughout your organization with flexible tools to create and share meaningful
SAS Visual Analytics. fact sheet What does SAS Visual Analytics do? Benefits
 fact sheet What does SAS Visual Analytics do? SAS Visual Analytics provides a complete platform for analytics visualization, enabling you to identify patterns and relationships in data that weren t initially
Ignite Your Creative Ideas with Fast and Engaging Data Discovery
 SAP Brief SAP BusinessObjects BI s SAP Crystal s SAP Lumira Objectives Ignite Your Creative Ideas with Fast and Engaging Data Discovery Tap into your data big and small Tap into your data big and small
Status Evolution Balance Trends
 This summary represents opinions of Project Botticelli Ltd as of March 2011 only, and does not represent opinions or recommendations of Microsoft Corp, Gartner Group, Forrester Research, except when directly
Microsoft Dynamics NAV
 Microsoft Dynamics NAV Maximising value through business insight Business Intelligence White Paper October 2015 CONTENTS Reports were tedious. Earlier it would take days for manual collation. Now all this
Microsoft Business Intelligence solution. What makes Microsoft BI difference
 Business Intelligence today Microsoft Business Intelligence solution What makes Microsoft BI difference Case study and Demo Gartner BI Platform Software Revenue (in $Billions) CIO Priorities: Data Analysis
ENTERPRISE MINER UNIVERSITY OF AUCKLAND
 SAS ENTERPRISE MINER UNIVERSITY OF AUCKLAND PHILLIP HIGGINS SAS PREDICTIVE ANALYTICS WHY IS IT IMPORTANT? Business Interest Data Growth Technology SAS PREDICTIVE ANALYTICS MOVING FROM REAR VIEW TO FORWARD
Vendor briefing Business Intelligence and Analytics Platforms Gartner 15 capabilities
 Vendor briefing Business Intelligence and Analytics Platforms Gartner 15 capabilities April, 2013 gaddsoftware.com Table of content 1. Introduction... 3 2. Vendor briefings questions and answers... 3 2.1.
SAP S/4HANA Embedded Analytics
 Frequently Asked Questions November 2015, Version 1 EXTERNAL SAP S/4HANA Embedded Analytics The purpose of this document is to provide an external audience with a selection of frequently asked questions
INVESTOR PRESENTATION. Third Quarter 2014
 INVESTOR PRESENTATION Third Quarter 2014 Note to Investors Certain non-gaap financial information regarding operating results may be discussed during this presentation. Reconciliations of the differences
Qlik s Associative Model
 White Paper Qlik s Associative Model See the Whole Story that Lives Within Your Data August, 2015 qlik.com Table of Contents Introduction 3 Qlik s associative model 3 Query-based visualization tools only
Tableau Visual Intelligence Platform Rapid Fire Analytics for Everyone Everywhere
 Tableau Visual Intelligence Platform Rapid Fire Analytics for Everyone Everywhere Agenda 1. Introductions & Objectives 2. Tableau Overview 3. Tableau Products 4. Tableau Architecture 5. Why Tableau? 6.
Intelligence Reporting Standard Reports
 Intelligence Reporting Standard Reports Sage 100 ERP (formerly Sage ERP MAS 90 and 200) Intelligence Reporting empowers you to quickly and easily gain control and obtain the information you need from across
Microsoft Dynamics NAV
 Microsoft Dynamics NAV 2015 Microsoft Dynamics NAV Maximising value through business insight Business Intelligence White Paper December 2014 CONTENTS Reports were tedious. Earlier it would take days for
Oracle BI Applications. Can we make it worth the Purchase?
 Oracle BI Applications Can we make it worth the Purchase? Introduction Oracle Gold partner én Specialized Partner CRM On Demand, Oracle BI Applications. Oracle Business Solution partner Oracle s Siebel
White Paper March 2009. Seven S&OP Reports Every Manufacturing Executive Needs Sales & operations planning excellence with IBM Cognos software
 White Paper March 2009 Seven S&OP Reports Every Manufacturing Executive Needs Sales & operations planning excellence with IBM Cognos software 2 Contents 3 Business problems 4 Business drivers The S&OP
Better Business Analytics with Powerful Business Intelligence Tools
 Better Business Analytics with Powerful Business Intelligence Tools Business Intelligence Defined There are many interpretations of what BI (Business Intelligence) really is and the benefits that it can
Data Visualization Techniques
 Data Visualization Techniques From Basics to Big Data with SAS Visual Analytics WHITE PAPER SAS White Paper Table of Contents Introduction.... 1 Generating the Best Visualizations for Your Data... 2 The
Implementing Data Models and Reports with Microsoft SQL Server 20466C; 5 Days
 Lincoln Land Community College Capital City Training Center 130 West Mason Springfield, IL 62702 217-782-7436 www.llcc.edu/cctc Implementing Data Models and Reports with Microsoft SQL Server 20466C; 5
PBI365: Data Analytics and Reporting with Power BI
 POWER BI FOR BUSINESS ANALYSTS AND POWER USERS 3 DAYS PBI365: Data Analytics and Reporting with Power BI AUDIENCE FORMAT COURSE DESCRIPTION Business Analysts, Statisticians and Data Scientists Instructor-led
Cloud Self Service Mobile Business Intelligence MAKE INFORMED DECISIONS WITH BIG DATA ANALYTICS, CLOUD BI, & SELF SERVICE MOBILITY OPTIONS
 Cloud Self Service Mobile Business Intelligence MAKE INFORMED DECISIONS WITH BIG DATA ANALYTICS, CLOUD BI, & SELF SERVICE MOBILITY OPTIONS VISUALIZE DATA, DISCOVER TRENDS, SHARE FINDINGS Analysis extracts
APPROACHABLE ANALYTICS MAKING SENSE OF DATA
 APPROACHABLE ANALYTICS MAKING SENSE OF DATA AGENDA SAS DELIVERS PROVEN SOLUTIONS THAT DRIVE INNOVATION AND IMPROVE PERFORMANCE. About SAS SAS Business Analytics Framework Approachable Analytics SAS for
Optymyze Sales Performance Software
 Optymyze Sales Performance Software Optymyze provides a complete set of sales performance management applications that are designed to help enterprises improve the alignment, efficiency, productivity,
INVESTOR PRESENTATION. First Quarter 2014
 INVESTOR PRESENTATION First Quarter 2014 Note to Investors Certain non-gaap financial information regarding operating results may be discussed during this presentation. Reconciliations of the differences
IBM Cognos Insight. Independently explore, visualize, model and share insights without IT assistance. Highlights. IBM Software Business Analytics
 Independently explore, visualize, model and share insights without IT assistance Highlights Explore, analyze, visualize and share your insights independently, without relying on IT for assistance. Work
uncommon thinking ORACLE BUSINESS INTELLIGENCE ENTERPRISE EDITION ONSITE TRAINING OUTLINES
 OBIEE 11G: CREATE ANALYSIS AND DASHBOARDS: 11.1.1.7 DURATION: 4 DAYS Course Description: This course provides step-by-step instructions for creating analyses and dashboards, which compose business intelligence
Demonstration of SAP Predictive Analysis 1.0, consumption from SAP BI clients and best practices
 September 10-13, 2012 Orlando, Florida Demonstration of SAP Predictive Analysis 1.0, consumption from SAP BI clients and best practices Vishwanath Belur, Product Manager, SAP Predictive Analysis Learning
<no narration for this slide>
 1 2 The standard narration text is : After completing this lesson, you will be able to: < > SAP Visual Intelligence is our latest innovation
Data Doesn t Communicate Itself Using Visualization to Tell Better Stories
 SAP Brief Analytics SAP Lumira Objectives Data Doesn t Communicate Itself Using Visualization to Tell Better Stories Tap into your data big and small Tap into your data big and small In today s fast-paced
How To Create A Business Benefit Dashboard Analysis Report In Microsoft Excel
 Get 8 ready-to-use reports that give you immediate insight into and across your business. Delivered in the familiar environment of Microsoft Excel, the reports are fully customizable, and flexible with
Implementing Data Models and Reports with Microsoft SQL Server
 Course 20466C: Implementing Data Models and Reports with Microsoft SQL Server Course Details Course Outline Module 1: Introduction to Business Intelligence and Data Modeling As a SQL Server database professional,
IBM Cognos Express. Breakthrough BI and planning for midsize companies. Overview
 IBM Cognos Express Breakthrough BI and planning for midsize companies Overview IBM Cognos Express is the first and only integrated business intelligence (BI) and planning solution purpose-built to meet
Pastel Accounting Business Intelligence Centre
 Get 8 ready-to-use reports that give you immediate insight into and across your business. Delivered in the familiar environment of Microsoft Excel, the reports are fully customisable, and flexible with
Smarter Infrastructure Instrumented, Interconnected, Intelligent... Patterns of Innovation
 Mohammad Albataineh Smarter Infrastructure Brand Leader IBM Software, Middle East and Africa Smarter Infrastructure Instrumented, Interconnected, Intelligent... Patterns of Innovation Technology has never
Introducing SAP Cloud for Analytics. Pras Chatterjee, Senior Director Product Marketing, EPM November 2015
 Introducing SAP Cloud for Analytics Pras Chatterjee, Senior Director Product Marketing, EPM November 2015 Legal disclaimer The information in this presentation is confidential and proprietary to SAP and
Business Intelligence Solutions for Gaming and Hospitality
 Business Intelligence Solutions for Gaming and Hospitality Prepared by: Mario Perkins Qualex Consulting Services, Inc. Suzanne Fiero SAS Objective Summary 2 Objective Summary The rise in popularity and
Microsoft 20466 - Implementing Data Models and Reports with Microsoft SQL Server
 1800 ULEARN (853 276) www.ddls.com.au Microsoft 20466 - Implementing Data Models and Reports with Microsoft SQL Server Length 5 days Price $4070.00 (inc GST) Version C Overview The focus of this five-day
Business Intelligence Cloud Service Deliver Agile Analytics
 Business Intelligence Cloud Service Deliver Agile Analytics Copyright 2014 Oracle Corporation. All Rights Reserved. You need a powerful platform for advanced analytics, one that s also intuitive and easy
Building Your Company s Data Visualization Strategy
 Building Your Company s Data Visualization Strategy Ian Mayor SAP BI Product Strategy Session 0702 2014 SAP AG or an SAP affiliate company. All rights reserved. Public 1 Legal disclaimer The information
IAF Business Intelligence Solutions Make the Most of Your Business Intelligence. White Paper November 2002
 IAF Business Intelligence Solutions Make the Most of Your Business Intelligence White Paper INTRODUCTION In recent years, the amount of data in companies has increased dramatically as enterprise resource
<Insert Picture Here> Oracle BI Standard Edition One The Right BI Foundation for the Emerging Enterprise
 Oracle BI Standard Edition One The Right BI Foundation for the Emerging Enterprise Business Intelligence is the #1 Priority the most important technology in 2007 is business intelligence
Implementing Data Models and Reports with Microsoft SQL Server 2012 MOC 10778
 Implementing Data Models and Reports with Microsoft SQL Server 2012 MOC 10778 Course Outline Module 1: Introduction to Business Intelligence and Data Modeling This module provides an introduction to Business
SAP BusinessObjects Edge BI, Standard Package Preferred Business Intelligence Choice for Growing Companies
 SAP Solutions for Small Businesses and Midsize Companies SAP BusinessObjects Edge BI, Standard Package Preferred Business Intelligence Choice for Growing Companies SAP BusinessObjects Edge BI, Standard
DATA WAREHOUSE BUSINESS INTELLIGENCE FOR MICROSOFT DYNAMICS NAV
 www.bi4dynamics.com DATA WAREHOUSE BUSINESS INTELLIGENCE FOR MICROSOFT DYNAMICS NAV True Data Warehouse built for content and performance. 100% Microsoft Stack. 100% customizable SQL code. 23 languages.
Independent process platform
 Independent process platform Megatrend in infrastructure software Dr. Wolfram Jost CTO February 22, 2012 2 Agenda Positioning BPE Strategy Cloud Strategy Data Management Strategy ETS goes Mobile Each layer
Selecting the Right SAP BusinessObjects BI Client Product based on your business requirements for SAP BW Customers
 Selecting the Right SAP BusinessObjects BI Client Product based on your business requirements for SAP BW Customers Ingo Hilgefort Director Solution Management Disclaimer This presentation outlines our
SalesLogix Advanced Analytics
 SalesLogix Advanced Analytics SalesLogix Advanced Analytics Benefits Snapshot Increase organizational and customer intelligence by analyzing data from across your business. Make informed business decisions
The IBM Cognos family
 IBM Software Business Analytics Cognos software The IBM Cognos family Analytics in the hands of everyone who needs it The IBM Cognos family Overview Business intelligence (BI) and business analytics have
Interim Report on Operations at 31 March 2015
 Interim Report on Operations at 31 March 2015 Retelit S.p.A. Registered Office at Viale Francesco Restelli 3/7-20124 Milan Share Capital 144,208,618.73 fully paid-up Register of Companies of Milan, Tax
EA104 World Premiere of SAP BusinessObjects Design Studio. Eric Schemer, Senior Director Product Management, BI Clients, SAP AG October, 2013
 EA104 World Premiere of SAP BusinessObjects Design Studio Eric Schemer, Senior Director Product Management, BI Clients, SAP AG October, 2013 Disclaimer This presentation outlines our general product direction
CRGroup Whitepaper: Digging through the Data. www.crgroup.com. Reporting Options in Microsoft Dynamics GP
 CRGroup Whitepaper: Digging through the Data Reporting Options in Microsoft Dynamics GP The objective of this paper is to provide greater insight on each of the reporting options available to you within
Empowering Teams and Departments with Agile Visualizations
 SAP Brief SAP Lumira, Edge Edition Objectives Empowering Teams and Departments with Agile Visualizations A data visualization solution for teams and departments A data visualization solution for teams
Oracle Hyperion Planning
 Oracle Hyperion Planning Oracle Hyperion Planning is an agile planning solution that supports enterprise wide planning, budgeting, and forecasting using desktop, mobile and Microsoft Office interfaces.
Sage PFW ERP Intelligence
 Sage PFW ERP Intelligence Sage PFW ERP Intelligence Standard Reports Get 6 ready-to-use reports that give you immediate insight into and across your business. Delivered in the familiar environment of Microsoft
ORACLE HYPERION PLANNING
 ORACLE HYPERION PLANNING ENTERPRISE WIDE PLANNING, BUDGETING, AND FORECASTING KEY FEATURES Hybrid data model facilitates planning, analysis and commentary Flexible workflow capabilities Reliability with
Oracle BI 11g R1: Create Analyses and Dashboards
 Oracle University Contact Us: Local: 1800 103 4775 Intl: +91 80 67863102 Oracle BI 11g R1: Create Analyses and Dashboards Duration: 5 Days What you will learn This Oracle BI 11g R1: Create Analyses and
TURN YOUR DATA INTO KNOWLEDGE
 TURN YOUR DATA INTO KNOWLEDGE 100% open source Business Intelligence www.spagobi.org @spagobi Why choose SpagoBI suite? A COMPREHENSIVE PRODUCT A complete, innovative and flexible suite allowing you to
Empower Individuals and Teams with Agile Data Visualizations in the Cloud
 SAP Brief SAP BusinessObjects Business Intelligence s SAP Lumira Cloud Objectives Empower Individuals and Teams with Agile Data Visualizations in the Cloud Empower everyone to make data-driven decisions
Τhe SAS BI delivers business-critical answers ahead of the competition Yannis Salamaras Senior Business Intelligence Consultant SAS Greece & Cyprus
 Τhe SAS BI delivers business-critical answers ahead of the competition Yannis Salamaras Senior Business Intelligence Consultant SAS Greece & Cyprus The Value of the Information What s wrong with this picture?
TECHNICAL PAPER. Infor10 ION BI: The Comprehensive Business Intelligence Solution
 TECHNICAL PAPER Infor10 ION BI: The Comprehensive Business Intelligence Solution Table of contents Executive summary... 3 Infor10 ION BI overview... 3 Architecture... 5 Core components... 5 Multidimensional,
«Software Open Source come fattore abilitante dei Progetti per le Smart Cities»
 «Software Open Source come fattore abilitante dei Progetti per le Smart Cities» Le esperienze nell Electronic Ticketing, nel Wireless Sensor Networks, nei Telematic Services & Location Based Systems Enrico
BUSINESS INTELLIGENCE
 BUSINESS INTELLIGENCE Microsoft Dynamics NAV BUSINESS INTELLIGENCE Driving better business performance for companies with changing needs White Paper Date: January 2007 www.microsoft.com/dynamics/nav Table
Implementing Data Models and Reports with Microsoft SQL Server
 CÔNG TY CỔ PHẦN TRƯỜNG CNTT TÂN ĐỨC TAN DUC INFORMATION TECHNOLOGY SCHOOL JSC LEARN MORE WITH LESS! Course 20466C: Implementing Data Models and Reports with Microsoft SQL Server Length: 5 Days Audience:
A BUSINESS INTELLIGENCE PLATFORM
 A BUSINESS INTELLIGENCE PLATFORM Transforming Data to Actionable Intelligence Rapid technology enablement by organizations has led to significant increase in the quantum of data generated by businesses.
BI4Dynamics provides rich business intelligence capabilities to companies of all sizes and industries. From the first day on you can analyse your
 BI4Dynamics provides rich business intelligence capabilities to companies of all sizes and industries. From the first day on you can analyse your data quickly, accurately and make informed decisions. Spending
How To Choose A Business Intelligence Toolkit
 Background Current Reporting Challenges: Difficulty extracting various levels of data from AgLearn Limited ability to translate data into presentable formats Complex reporting requires the technical staff
Product Strategy Update OTM SIG Conference
 Product Strategy Update OTM SIG Conference Derek H. Gittoes Vice President, Product Strategy August 11, 2014 Copyright 2014, Oracle and/or its affiliates. All rights reserved. Program Agenda 1 2 3 4 Current
ORACLE UTILITIES ANALYTICS
 ORACLE UTILITIES ANALYTICS TRANSFORMING COMPLEX DATA INTO BUSINESS VALUE UTILITIES FOCUS ON ANALYTICS Aging infrastructure. Escalating customer expectations. Demand growth. The challenges are many. And
Need for Business Intelligence
 Wisdom InfoTech Need for Business Intelligence INFORMATION AT YOUR FINGER TIPS May 2007 ABRAHAM PABBATHI Principal Consultant BI Practice Wisdom InfoTech 18650 W. Corporate Drive Suite 120 Brookfield WI
Data Visualization Techniques
 Data Visualization Techniques From Basics to Big Data with SAS Visual Analytics WHITE PAPER SAS White Paper Table of Contents Introduction.... 1 Generating the Best Visualizations for Your Data... 2 The
Pastel Evolution Business Intelligence Centre
 Get 12 ready-to-use reports that give you immediate insight into and across your business. Delivered in the familiar environment of Microsoft Excel, the reports are fully customisable, and flexible with
Consuming Real Time Analytics and KPI powered by leveraging SAP Lumira and SAP Smart Business in Fiori SESSION CODE: 0611 Draft!!!
 Consuming Real Time Analytics and KPI powered by leveraging SAP Lumira and SAP Smart Business in Fiori SESSION CODE: 0611 Draft!!! Michael Sung SAP Consuming Real Time Analytics and KPI powered by leveraging
Consumption of OData Services of Open Items Analytics Dashboard using SAP Predictive Analysis
 Consumption of OData Services of Open Items Analytics Dashboard using SAP Predictive Analysis (Version 1.17) For validation Document version 0.1 7/7/2014 Contents What is SAP Predictive Analytics?... 3
SQL Server 2012 Business Intelligence Boot Camp
 SQL Server 2012 Business Intelligence Boot Camp Length: 5 Days Technology: Microsoft SQL Server 2012 Delivery Method: Instructor-led (classroom) About this Course Data warehousing is a solution organizations
How To Understand Business Intelligence
 An Introduction to Advanced PREDICTIVE ANALYTICS BUSINESS INTELLIGENCE DATA MINING ADVANCED ANALYTICS An Introduction to Advanced. Where Business Intelligence Systems End... and Predictive Tools Begin
ANALYTICS IN BIG DATA ERA
 ANALYTICS IN BIG DATA ERA ANALYTICS TECHNOLOGY AND ARCHITECTURE TO MANAGE VELOCITY AND VARIETY, DISCOVER RELATIONSHIPS AND CLASSIFY HUGE AMOUNT OF DATA MAURIZIO SALUSTI SAS Copyr i g ht 2012, SAS Ins titut
How To Improve Efficiency With Business Intelligence
 I White Paper Table of Contents Executive Summary.. 3 Improving Operational Efficiency With BI Is A High Priority.. 3 Why BI Is Important.. 3 BI Incorporates Multiple Applications.. 4 Data Consolidation
SharePoint BI. Grace Ahn, Design Architect at AOS
 SharePoint BI Grace Ahn, Design Architect at AOS 1 SharePoint Saturday St. Louis 2015 Session Evaluations Schedule and evaluate each session you attend via our mobile app that can be used across devices
CUSTOMER Presentation of SAP Predictive Analytics
 SAP Predictive Analytics 2.0 2015-02-09 CUSTOMER Presentation of SAP Predictive Analytics Content 1 SAP Predictive Analytics Overview....3 2 Deployment Configurations....4 3 SAP Predictive Analytics Desktop
Sage 200 Business Intelligence Datasheet
 Sage 200 Datasheet provides you with full business wide analytics to enable you to make fast, informed desicions, complete with management dashboards. It helps you to embrace strategic planning for business
primitive or basic That s how over 50% of global organisations surveyed, described their ability to use their data in executive decisions.
 primitive or basic That s how over 50% of global organisations surveyed, described their ability to use their data in executive decisions. Source: Economist Intelligence Unit Report: the evolving role
Making confident decisions with the full spectrum of analysis capabilities
 IBM Software Business Analytics Analysis Making confident decisions with the full spectrum of analysis capabilities Making confident decisions with the full spectrum of analysis capabilities Contents 2
SBI2013: Building BI Solutions using Excel and SharePoint 2013
 UNDERSTANDING MICROSOFT'S BI TOOLSET 3 DAYS SBI2013: Building BI Solutions using Excel and AUDIENCE FORMAT COURSE DESCRIPTION Business Analysts and Excel Power Users Instructor-led training with hands-on
3 myths of email analytics. and how they are impacting your results
 3 myths of email analytics and how they are impacting your results Date: 11/17/2008 The volume of insights you can gain by adding ad hoc analysis capabilities to your standard set of email reporting metrics
Agil visualisering och dataanalys
 Agil visualisering och dataanalys True Business and IT collaboration in Analytics Niklas Packendorff @packendorff SAPSA Impuls 2014 Legal disclaimer The information in this presentation is confidential
Next Generation Business Performance Management Solution
 Next Generation Business Performance Management Solution Why Existing Business Intelligence (BI) Products are Inadequate Changing Business Environment In the face of increased competition, complex customer
Data Warehouse design
 Data Warehouse design Design of Enterprise Systems University of Pavia 21/11/2013-1- Data Warehouse design DATA PRESENTATION - 2- BI Reporting Success Factors BI platform success factors include: Performance