Modeling Of Oil Spill Trajectory and Fate in Sudanese Red Sea Coastal Water
|
|
|
- Britton Harrison
- 7 years ago
- Views:
Transcription
1 Modeling Of Oil Spill Trajectory and Fate in Sudanese Red Sea Coastal Water Masoud Gamiel Ahmed 1, Basheir M. Elhassan 2 and K. E.Bashar 3 1 Civil Engineering Department, Sudan University of Science and Technology (SUST) 2 Chemical Engineering Department, University of Khartoum 3 Civil Engineering Department, Omdurman Islamic University Abstract- Prediction and simulation of the trajectory and weathering of marine oil spills are essential to the development of pollution response and contingency plans, and the evaluation of environmental impact assessments. In this study, SL Ross Trajectory and fate modeling was applied to identify the shortest time for oil to reach Bashayer Red Sea shoreline in order to model the worst case scenarios. Four different scenarios were tested out, two for winter and two for summer. Results showed that in winter the spill movement is towards south and southwest while it moves to the northwest in summer. In both cases the spill will contact Bashayer Marine Terminal (BMT) shoreline within 4 hours in winter and 6 hours in summer rely on the combined effect of wind and tidal current. It was also shown that between 47.7 to 64% of the oil remain on the surface after 10 hours of spill. KEYWORDS: Oil spill, SL Ross model, Bashayer Marine Terminal (BMT), Shoreline contact.!" # / *+#01/ 2 SL Ross.+-' ) *+, ($ %& ' %#9,9 :(8 &) ) ) +$6!76!6 / ; 5: 5: <: =$ 9>?(2 / %!6 / ($6!76 ')/ & (2 / / ; 6 <: *: A )2 / / 9 6!6 / 9 4@#76 / 2 10) D< C ( 9 B 63 (5 & 9 Introduction The world production of crude oil is about 3 billion tons per year and half of it is transported by sea (1). Being strategically positioned between the Indian Ocean and Mediterranean Sea, the Red Sea has been extensively used by international maritime traffic. A significant amount of oil is spilled into the sea from natural and non natural sources. Oil pollution threatens coastal environment and affects adversely the biological life and ecology. Trajectory models are used to identify the shortest time for oil to reach the shoreline. Such information is required in identifying response requirements. The intension is to model the worst case scenarios. The results of the trajectory and fate model calculation determine both travel times and location of shoreline oiling, together with slick volume and amounts evaporated, dispersed and beached. The three basic questions of practical importance concerning given oil spills are as follows: where will it move to, when will it get there, and what will be its state when it arrives. The main objective of this paper identify the shortest time for Sudanese crude oil to reach the Red Sea 64
2 shoreline by modeling several scenarios and identifying the worst case scenarios using SL Ross trajectory model. A hypothetical accidental spill of Sudanese crude oil was used in this study. SL Ross model Description SL Ross is a company that is recognized internationally as a leader in oil spill management and control. The oil spill behavior model developed at SL Ross is one of the most comprehensive available models and has been "ground-truthed" on a number of experimental and real offshore spills. The model describes the trajectory and behavior of marine oil spills as a function of type, size, oil properties and prevailing environmental conditions. The oil slick is represented by a collection of particles; each of these particles has the ability to account for spreading and weathering of the slick as it moves through the marine environment, affected by winds and sea current. A videotape management system is also built into the model. The user selects the location and the system automatically identifies the predicted video clip for that portion of the shore, advances the media to that location and plays the video record either on-screen or on the television set. Model Formulation SL Ross spreading model relies on the work of Fay (2) and Mackay et al (3), but includes the modifications to account for oil viscosity changes and the development of a yield stress in the oil (i.e., pour point). Longer term spreading takes into account oceanic diffusion processes according to relationship developed by Okubo (4). Evaporation models use the work of Stiver and Mackay (5) with modification developed by Ross and Mackay (6). Natural dispersion is modeled using Audunsons (7). Natural dispersion model is modified to account for oil density, viscosity, interfacial tension and pour point. For emulsification the model uses the relationship developed by Zagorski and Mackay (8) with modification by Bobra (9), Ross and Mackay (6). The movement of slicks discharged in the model is determined through the vector addition of the local surface water current and 3% of the prevailing wind speed. Wind forecast are entered by the user for each spill scenario of interest based on the best available data. Surface water currents are provided, in map form that identifies the spatial variation in the water velocities. If surface water current varies with time, such as in a tidal situation, a number of map sets can be used to represent the variation. The model is given a schedule of the time histories for the use of the predicted map at a given time in the life of the spill. Simulation Case A simulation example is proposed to illustrate the use of the assessment of the risk of Portsudan and Bashayer shore contamination by offshore oil spills. The results of the trajectory and fate mode calculation produce both travel times and location of shoreline oiling, together with slick volume and amounts evaporated, dispersed and beached. A simulation of a hypothetical accidental oil spill of 1000 m 3 of Nile Blend (NB) Sudanese crude oil with density of kg/ m 3 was used. The sizes of spills were selected based on consultation with experts and in line with common practice. The spill is located at Latitude 19 o 24' 13'' and Longitude 37 o 12' 32'' at the Bashayer sea surface. The initial location of the oil slick is shown by a star in the Figures. Wind and tidal current are two main factors to control the oil spill distribution. Of course, the winds will likely change speed and direction over the period of time being simulated. Thus the wind predictions are the key assumption. Unfortunately, wind forecasts are difficult to be accurate. In this study, wind prevailing condition at any specified season was considered based on 30 years historical records of wind data and 65
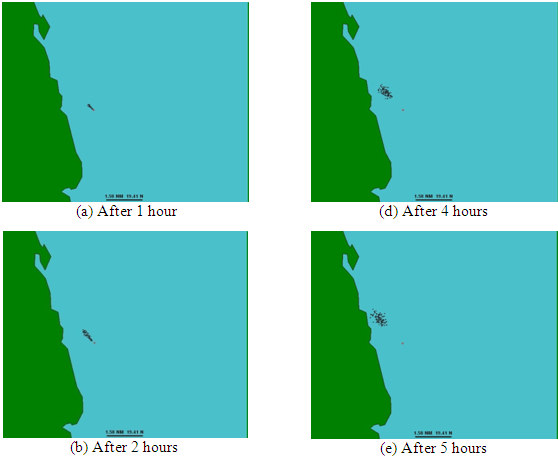
3 wind direction obtained from Sudan Meteorological Authority. Two main situations were modeled, winter and summer conditions. In winter scenario conditions the sea temperature condition taken as 25 o C, the air temperature as 30 o C, with a current which moves from north to south. A completely inverted situation, in the summer where currents flow towards north, sea temperature condition of 35 o C, and air temperature of 40 o C were considered. Four different scenarios were carried out in this study, two for winter and two for summer. Prevailing wind condition in winter was taken to be 10 and 9 knots with prevailing direction of Northeast and North, respectively. In the summer conditions, the oil was subjected to prevailing wind speed of 8 and 4 knots with prevailing direction of east and northeast. The wind data for the period was obtained from Sudan Meteorological Authority. As the model simulates the movement of the oil slick and its change in the size, it also determines at every time step whether the periphery of the oil slick has contacted the shoreline or not. The simulation time used was 10 to 21 hours. The length of simulation time was chosen according to the time of oil-shore contact. Two figures for scenario 1 and scenario 3 were selected to simulate positions of oil slick. RESULTS Winter (First scenario) This scenario used a wind speed of 10 knots. The simulation results are shown in Figures 1 and 2. The results show that the movements of oil rely on the combined effect of wind and tidal current. The spill was moving to the southwest, mimicking the prevailing wind and current conditions. The model indicates that oil would reach the coastline approximately 4 hours after the initial release. The slick may affect large area of the shore after six hours. The shoreline interaction oil represent about 5.6% of total amount spilled at the beginning of the contact (5 hours after the release), this amount increases rapidly to 18.9% at the hour 6 then fall gradually to reach 11.3% at the hour 10. After 6 hours, oil started to return back to the sea. fate(%) Time(hr) oil evaporated oil on suface oil in water column shoreline interaction Figure 1: Fate of Nile Blend crude oil (scenario 1) 66
4 (a) After 1 hour (d) After 4 hour (b) After 2 hour (e) After 5 hour (c) After 3 hour (f) After 6 hour 67
. reach to about 58% at the end of hour 10. Consequently shoreline interaction started to Immediately at the beginning of spill the decrease.")
5 (g) After 7 hours (i) After 9 hours (h) After 8 hours (j) After 10 hours Figure 2(a-j): Simulated trajectories of NB crude oil slick originated at offshore location using wind prevailing of 10 knots NE (scenario 1). reach to about 58% at the end of hour 10. Consequently shoreline interaction started to Immediately at the beginning of spill the decrease. The length of the shoreline lighter fractions of oil evaporate. It has been affected by an oil spill depends on the size observed that this evaporation will remove of the oil slick, on the wind direction after as much as 20% of the spill during the first 4 the initial shore contact, as well as on hours, after that evaporation will increase longshore currents that may cause further the loss of spilled oil gradually to reach 24% migration of the oil slick along the shoreline. at the hour 10. The dispersion into the water For example, if the wind continues in a column is gradually increased (from 1% at direction normal to the shoreline, then the hour 1 to 6.5% at hour 5) then the amount affected length of the shoreline will be at remains constant at 6.6% till the end of least equal to the diameter of the oil slick at simulation. Results showed that, oil may the time of initial contact (10). accumulate along the coast and may be Clearly oil does not remain permanently on removed partially by evaporation and reentrain to the water column through the the sea surface. It may disperse into the water column either completely or partially flow. Similar phenomena may happen for under the action of natural forces. According the tidal zone. These areas may change to to the simulations, at the first hour 89% of dry point during the ebb-tide period. This the spilled oil remains on the water surface, process is essential for the evaluation of the the amount decreased gradually due to degree of coast impact. weathering processes such as evaporation to Winter (Second scenario) 68
6 This scenario used a wind speed of 9 knots, the winds were predominantly from the north and the current moves from north to south (the most common situation in this period) (11, 12). The simulation suggests that north winds would hold the oil to the shore. Simulation time was 15 hours. Simulation clearly shows the spill moving to the south, following the prevailing wind and current directions. After 9 hours oil started to move a bit towards shore due to geographical characteristics at that area of Bashayer terminal, it seems like a semi-enclosed basin and hence oil accumulates at this basin. Accumulation of spill increased with time which may affect large area of shore at that place. Oil started to hit the shoreline after 11 hours from the spillage. After contact with the shoreline, the model changes progressively the shape of the oil slick from elongated shape to a semicircle. Within 11 hours, about 0.6 % of the spilled oil landed on Bashayer Red Sea beaches increased to 2.6% after 14 hours from the start of oil spill. Oil travels as far as 8 kms from the spill site. The lightest, most toxic fractions probably evaporated within the first 4 hours and constituted more than 20% of the total amount (1000 m3). 14 hours after the spill, about 57% of the oil remained on the surface, 14% of the total oil spilled entered to water column and 26% has evaporated. Summer (Third scenario) Figure 3 shows the simulated trajectories for the third scenario. The model was carried out to reflect the simulation of the likely trajectory of the Nile Blend (Sudanese) crude oil spill at prevailing wind of 8 knots, with East prevailing wind direction. According to the simulations, the oil slick was moving to the Northwest i.e. towards the Bashayer coast. The model indicated that oil would reach the coastline approximately 6 hours after the initial release (Figure 3.f). Computations showed that if the countermeasures are taken after 1 hour about 12 % of Nile Blend crude oil lost by evaporation. Evaporation rate increased very steep at the first four hours (from 11.4% at the first hour to 22% at the fourth hour) then the process increased gradually to 26.4% at the end of the hour 10. The lightest, most toxic fractions evaporated rapidly at first. The oil remains on the sea water surface decreased from 87.4% at the first hour to reach only 47.7% at the end of the hour 10. At this time the oil lost in the water column about 15%, while only 1.2% of the total oil spilled was entered to water column in the first hour. According to the simulations, the oil slick was moving back and forth with the tidal cycle. After 6 hours oil started to return back to the sea which made shoreline interaction decreased from 1.9 to 1.2% at 6 and 8 hours respectively, and then oil returned back to the shoreline which made shoreline interaction increased to11% at 10 hours after Nile Blend crude oil release (Figure 4). Summer (Fourth scenario) This scenario used a wind speed of 4 knots and the prevailing direction was NE. The output from these trajectories provides information on the likely trajectory of a spill by wind and current transport. The trajectory was allowed to continue for as long as 21 hours. The results of the simulation show that, the slick is moving in the northwest direction. The output from these trajectories provides information on the likely trajectory of a spill to contact shoreline. The first map consists of a source and an initially visible spot of oil, both located near the oil terminal. The diagram of this spot increase gradually as it moves towards the shore due to spreading. 69
7 70

8 Figure 3 (a-j): Simulated trajectories of NB crude oil slick originated at offshore location using wind prevailing of 8 knots E (Scenario 3). The winds and current tended to carry the oil in Northwest direction along the coast. Oil started to hit the shoreline after 16 hours from the spillage. After contact with the shoreline, the circle shape of the oil slick, increased and became more and more elongated as the oil slick was pushed against the shore. Result showed that largest spot of the spilled oil was concentrated around the small gulf at the coast. The shoreline interaction oil represent about 0.6% of the total amount spilled at the beginning of the contact (16 hours after the release), this amount increased gradually to reach 13.2% at the hour 21. Oil on surface seawater decreased rapidly from 90.1% at first hour to only 38.8% at the hour 21. This is due to the evaporation of the light component of the Nile Blend crude oil, as well as the chemical and biological weathering processes of the NB crude oil. The fate of spilled oil showed that evaporation removed 9.4% of the total spilled amount (1000 m 3 ) during the first hour, the amount increased rapidly to more than 20% at the fourth hour, then the removal due to evaporation increased gradually to reach 28.4% by the end of the hour 21. At this point, the dispersion into the water column was greatly increased (19.6 % of the total amount of spilled oil). The oil in water column at hour 1 was 0.5% of the total spilled oil. 71
9 fate of oil (%) Time (hr) Figure 4: Oil fate in summer Conclusion A simulation of a hypothetical accidental oil spill of Nile Blend (NB) crude oil using SL Ross model showed that, the movements of oil rely on the combined effect of wind and tidal current. In winter the spill moving to the south and southwest while it move to the northwest in summer. In both cases the spill will contact Bashayer Marine Terminal (BMT) shoreline. The results show that the shortest time to reach the shoreline in winter was from 4 to 11 hours and 6 to 16 hours in summer, depends on wind speed and direction. Acknowledgment The authors would like to express their appreciation to Prof. Kerdany. The Head of crises Management system, integrated simulators complex. Arab Academy of Science, Technology, and Maritime Transport, Alexandria, Egypt, who allowed us to use the facilities of the Academy to apply the model. References 1. Clark, R.B. (1992). Marine Pollution 3 rd ed., Clarendon Press. 2. Fay, J. A., (1971). Physical processes in the spread of oil on a water surface. In Proceedings of the Joint Conference on Prevention and Control of oil spills, American Petroleum Institute, pp Mackay, D. S., Buist, I., Mascarenhas, R & Paterson, S., (1980). Oil spill processes and models, Environment Canada, Ottawa, Ontario. 4. Okbo, A., (1971). Oceanic diffusion diagrams, Deep-Sea research, 18: Stiver, W. and D. Mackay, (1983). Evaporation rate of spills of hydrocarbons and petroleum mixtures, Environmental protection Service, Environment Canada, EE-8, 6. Ross, S.L. and D. MacKay, (1988). Laboratory studies of the behavior and fate of waxy crude oil spills, Environmental Studies research funds, Report 84, Ottawa, 7. Audunsons, T., (1980). The fate and weathering of surface oil from the Bravo blowout, Marine Environmental Research Zagorski, W and Makkay, D., (1982). Studies of water in oil emulsions, Environment Canada Manuscript Report, EE-34, Ottawa, Ontario pp Bobra, M. A., (1989). A catalogue of oil properties, Environmental Emergencies 72
10 10
http://www.youtube.com/watch? v=pe-1g_476na&feature=player_embed
 On April 20, 2010, the explosion of the BP Deepwater Horizon oil drilling platform, located 90 km offshore in the Mississippi Canyon, caused a 87-day blowout of the Macondo well. During this period, crude
Module No. # 02. Impact of oil and gas industry on marine environment
 Health, Safety and Environmental Management in Petroleum and offshore Engineering Dr. Srinivasan Chandrasekaran Department of Ocean Engineering Indian Institute of Technology, Madras Module No. # 02 Lecture
Near shore and shoreline oil spill response Current status and need for future development
 Near shore and shoreline oil spill response Current status and need for future development Svein Ramstad SINTEF Gunnar Pedersen Akvaplan-niva The 3rd Norway Russia Arctic Offshore Workshop St Petersburg,
Wave Tank Dispersant Effectiveness Tests on Alaskan Crude Oils
 687 Wave Tank Dispersant Effectiveness Tests on Alaskan Crude Oils Randy Belore SL Ross Environmental Research Limited Ottawa, ON, Canada randy@slross.com Abstract A study was conducted by SL Ross for
The concepts developed in this standard include the following: Oceans cover about 70% of the surface of the Earth.
 Name Date Grade 5 SOL 5.6 Review Oceans Made by SOLpass - www.solpass.org solpass100@comcast.net Reproduction is permitted for SOLpass subscribers only. The concepts developed in this standard include
Straits of Mackinac Contaminant Release Scenarios: Flow Visualization and Tracer Simulations
 Straits of Mackinac Contaminant Release Scenarios: Flow Visualization and Tracer Simulations Research Report for the National Wildlife Federation Great Lakes Regional Center By David J. Schwab, Ph.D.,
Report Tidal Power Generation Systems
 The American University in Cairo Engineering Department ENGR 318 Spring 2001 Report Tidal Power Generation Systems Submitted to: Prof. Dr. Mahmoud Gilany By: Sherif Masoud Maher Amer Mohamed Samir Introduction
Environmental and Economical Oil and Groundwater Recovery and Treatment Options for hydrocarbon contaminated Sites
 2014 5th International Conference on Environmental Science and Technology IPCBEE vol.69 (2014) (2014) IACSIT Press, Singapore DOI: 10.7763/IPCBEE. 2014. V69. 15 Environmental and Economical Oil and Groundwater
Some Preliminary Macroeconomic Impacts of the 2010 Deepwater Horizon Oil Gusher on Alabama
 Some Preliminary Macroeconomic Impacts of the 2010 Deepwater Horizon Oil Gusher on Alabama Samuel Addy, Ph.D. and Ahmad Ijaz Center for Business and Economic Research Culverhouse College of Commerce and
Tides and Water Levels
 Tides and Water Levels What are Tides? Tides are one of the most reliable phenomena in the world. As the sun rises in the east and the stars come out at night, we are confident that the ocean waters will
OPRC Level II CONTINGENCY PLANNING, RESPONSE MANAGEMENT AND ORGANIZATION
 OPRC Level II CONTINGENCY PLANNING, RESPONSE MANAGEMENT AND ORGANIZATION Outline 1. Purpose and types of plans 2. Structure of a contingency plan 3. The response organization 4. Escalation of the response
2. The map below shows high-pressure and low-pressure weather systems in the United States.
 1. Which weather instrument has most improved the accuracy of weather forecasts over the past 40 years? 1) thermometer 3) weather satellite 2) sling psychrometer 4) weather balloon 6. Wind velocity is
Dispersion of Oil released from the Deepwater Horizon MC 252 Oil Spill following Subsurface Injection of Corexit 9500. Kenneth Lee
 Dispersion of Oil released from the Deepwater Horizon MC 252 Oil Spill following Subsurface Injection of Corexit 9500 Kenneth Lee Photos\Lee_Ken\IMG_0530_ppt.JPG Kenneth Lee Centre for Offshore Oil, Gas
ESTIMATING CLEANUP COSTS FOR OIL SPILLS
 #168, 1999 International Oil Spill Conference ESTIMATING CLEANUP COSTS FOR OIL SPILLS Dagmar Schmidt Etkin Oil Spill Intelligence Report Cutter Information Corp. Arlington, Massachusetts, U.S. ABSTRACT:
6. Base your answer to the following question on the graph below, which shows the average monthly temperature of two cities A and B.
 1. Which single factor generally has the greatest effect on the climate of an area on the Earth's surface? 1) the distance from the Equator 2) the extent of vegetative cover 3) the degrees of longitude
Pollution Response RESPONDING TO AN OIL SPILL
 Pollution Response RESPONDING TO AN OIL SPILL Most oil spills within New Zealand waters are likely to happen close to the coast or in harbours. This makes it extremely difficult for responders to prevent
Techniques of Oil Spill Response in the sea
 IOSR Journal of Applied Physics (IOSR-JAP) e-issn: 2278-4861. Volume 6, Issue 1 Ver. I (Jan. 2014), PP 36-41 Techniques of Oil Spill Response in the sea Obi 1, E. O., Kamgba 2, F. A., and Obi 3, D. A.
Satellite monitoring of oil spills in the Mediterranean Sea for 1999-2004
 Satellite monitoring of oil spills in the Mediterranean Sea for 1999-2004 Konstantinos Topouzelis, O. Muellenhoff, G. Ferraro, B. Bulgarelli E.C. Joint Research Centre Institute for the Protection and
User s Guide. Zuniga Point. Point Loma
 User s Guide Welcome to the Location File for San Diego Bay, located in the southwestern corner of the U.S. San Diego Bay has an excellent natural harbor, which has made it a busy commercial port. San
Management of Marine Environment ENVS 590. Instructor Dr. Assad A. Al-Thukair
 Management of Marine Environment ENVS 590 Instructor Dr. Assad A. Al-Thukair Contingency Planning Background Elements of Contingency Planning Information gathering Strategy development Operational plan
Best available techniques for oil spill containment and clean-up in the Mediterranean Sea
 Water Resources Management IV 527 Best available techniques for oil spill containment and clean-up in the Mediterranean Sea F. Cumo 1, F. Gugliermetti 1 & G. Guidi 2 1 Department of Technical Physics,
Experience: An Oil Spill from a Crude Oil Pipeline
 International Journal of Environmental Monitoring and Analysis 2015; 3(6-1): 56-65 Published online October 15, 2015 (http://www.sciencepublishinggroup.com/j/ijema) doi: 10.11648/j.ijema.s.2015030601.17
Sihwa Tidal Power Plant: a success of environment and energy policy in Korea
 Sihwa Tidal Power Plant: a success of environment and energy policy in Korea May 2007 Prof. Nohyoung Park Korea University Energy Situations in Korea Korea started its industrial development in the 1970s,
In-situ Bioremediation of oily sediments and soil
 1 Peter Werner, Jens Fahl, Catalin Stefan DRESDEN UNIVERSITY OF TECHNOLOGY In-situ Bioremediation of oily sediments and soil 2 WHAT IS OIL? MIXTURE of aliphatic and aromatic hydrocarbons Different composition
Oil spill contingency planning
 Oil spill contingency planning N-04700-GN0940 Rev 2, July 2012 Core concepts The Regulations specify that the EP must contain an oil spill contingency plan (OSCP) which includes appropriate oil spill response
Oil Spill Response Planning with MINLP. 1. Introduction. 2. Problem Statement. Volume nn Number m xxxxxber 20nn 1
 Volume nn Number m xxxxxber 20nn 1 Oil Spill Response Planning with MINLP Fengqi You and Sven Leyffer Argonne National Laboratory 9700 South Cass Avenue, Argonne, Illinois 60439, USA (youf@mcs.anl.gov,
Dear Editor. Answer to the General Comments of Reviewer # 1:
 Dear Editor The paper has been fully rewritten and the title changed accordingly to Referee 1. Figures have been updated in order to answer to the well-posed questions of the reviewers. The general structure
Science. Services. Solutions.
 Science. Services. Solutions. www.apasa.com.au Overview RPS APASA is a leading provider of high-quality environmental modelling services to support offshore and coastal industries in Australia, South-East
Simulate an Oil Spill Cleanup
 This website would like to remind you: Your browser (Apple Safari 7) is out of date. Update your browser for more security, comfort and the best experience on this site. Activitydevelop Simulate an Oil
Oil spill risk assessment and response planning for offshore installations
 Finding 6 Oil spill risk assessment and response planning for offshore installations FINAL REPORT Oil Spill Response Joint Industry Project The global oil and gas industry association for environmental
Water & Climate Review
 Water & Climate Review 1. The cross section below shows the direction of air flowing over a mountain. Points A and B are at the same elevation on opposite sides of the mountain. 4. The graph below shows
APPENDIX XI. OIL SPILL CLEANUP AGENTS (OSCAS) PROCESS: Requirements for the Use of Oil Spill Cleanup Agents
 PROCESS: Requirements for the Use of Oil Spill Cleanup Agents") APPENDIX XI OIL SPILL CLEANUP AGENTS (OSCAS) PROCESS: Requirements for the Use of Oil Spill Cleanup Agents BACKGROUND An OSCA is defined as any chemical, or any other substance, used for removing, dispersing,
APPENDIX XI OIL SPILL CLEANUP AGENTS (OSCAS) PROCESS: Requirements for the Use of Oil Spill Cleanup Agents BACKGROUND An OSCA is defined as any chemical, or any other substance, used for removing, dispersing,
NSW - MEP : Maritime and marine risk assessment of calamitous (oil) spills
 spills") Prepared for: NoordzeeWind NSW - MEP : Maritime and marine risk assessment of calamitous (oil) spills Report OWEZ_R_280_20_07_2006 July, 2006 Z3644.00 Prepared for: NoordzeeWind NSW - MEP : Maritime and
Prepared for: NoordzeeWind NSW - MEP : Maritime and marine risk assessment of calamitous (oil) spills Report OWEZ_R_280_20_07_2006 July, 2006 Z3644.00 Prepared for: NoordzeeWind NSW - MEP : Maritime and
LNG SAFETY MYTHS and LEGENDS
 LNG SAFETY MYTHS and LEGENDS Doug Quillen ChevronTexaco Corp. Natural Gas Technology Investment in a Healthy U.S. Energy Future May 14-15, 2002 Houston Introduction North America is Becoming the Focal
SENATE RESOLUTION No. 78 STATE OF NEW JERSEY. 214th LEGISLATURE INTRODUCED JULY 1, 2010
 SENATE RESOLUTION No. STATE OF NEW JERSEY th LEGISLATURE INTRODUCED JULY, 00 Sponsored by: Senator SEAN T. KEAN District (Monmouth) Senator ANDREW R. CIESLA District 0 (Monmouth and Ocean) Co-Sponsored
CGC1D1: Interactions in the Physical Environment Factors that Affect Climate
 Name: Date: Day/Period: CGC1D1: Interactions in the Physical Environment Factors that Affect Climate Chapter 12 in the Making Connections textbook deals with Climate Connections. Use pages 127-144 to fill
Part 4. The IXTOC-I Well Blowout: The Gulf of Mexico. Mexico, 1979. Contents Part 4. Geography of the Gulf of Mexico... 27
 Part 4 The IXTOC-I Well Blowout: The Gulf of Mexico Mexico, 1979 Contents Part 4 Geography of the Gulf of Mexico... 27 The Environmental Damage to the Gulf of Mexico... 28 The IXTOC-I Cleanup and Recovery...
SOUTHERN OCEAN CURRENTS. http://www.polar.org/antsun/oldissues2002-2003/sun121502/current.html
 Map from: SOUTHERN OCEAN CURRENTS http://www.polar.org/antsun/oldissues2002-2003/sun121502/current.html FROM: The Antarctic Coastal Current Joanna Gyory, John Cangialosi, Ieng Jo, Arthur J. Mariano, Edward
HEADS MARINE ENVIRONMENT SURVEILLANCE SYSTEM
 HEADS MARINE ENVIRONMENT SURVEILLANCE SYSTEM Hydrocarbon Early Automatic Detection System indracompany.com HEADS MARINE ENVIRONMENT SURVEILLANCE SYSTEM HEADS (Hydrocarbon Early Automatic Detection System)
Name Period 4 th Six Weeks Notes 2015 Weather
 Name Period 4 th Six Weeks Notes 2015 Weather Radiation Convection Currents Winds Jet Streams Energy from the Sun reaches Earth as electromagnetic waves This energy fuels all life on Earth including the
BEACH NOURISHMENT COMBINED WITH SIC VERTICAL DRAIN IN MALAYSIA.
 BEACH NOURISHMENT COMBINED WITH SIC VERTICAL DRAIN IN MALAYSIA. Claus Brøgger 1 and Poul Jakobsen 2 The present paper presents measurements and results from a three year full scale Pilot Project with the
BMP Guidelines. Environmental Impact Assessment (EIA) report for activities related to hydrocarbon exploration and exploitation offshore Greenland
 report for activities related to hydrocarbon exploration and exploitation offshore Greenland") BMP Guidelines for preparing an Environmental Impact Assessment (EIA) report for activities related to hydrocarbon exploration and exploitation offshore Greenland Danish National Environmental Research
BMP Guidelines for preparing an Environmental Impact Assessment (EIA) report for activities related to hydrocarbon exploration and exploitation offshore Greenland Danish National Environmental Research
Separation of oil and water in oil spill recovery operations*
 Pure Appl. Chem., Vol. 71, No. 1, pp. 95 101, 1999. Printed in Great Britain. 1999 IUPAC Separation of oil and water in oil spill recovery operations* Knut Gaaseidnes and Joseph Turbeville MiljoLab AS,
PE s Research activities and potential links to MM5. Red Ibérica MM5 Valencia 9th -10th June 2005
 PE s Research activities and potential links to MM5 Red Ibérica MM5 Valencia 9th -10th June 2005 PE and its R&D Area Puertos del Estado (PE) is a Public Institution that deals with the administration of
Type Example Density Volatility Toxicity Clean-up 1 Jet fuels, gasoline. Highly (evaporates in one to two days)
") OIL SPILLS What is oil used for? And how much do we use? Each day, Canada uses more than 1.7 million barrels of oil. Oil is used to fuel vehicles and heat buildings, as well as lubricate machinery and
OIL SPILLS What is oil used for? And how much do we use? Each day, Canada uses more than 1.7 million barrels of oil. Oil is used to fuel vehicles and heat buildings, as well as lubricate machinery and
5-Minute Refresher: WEATHERING AND EROSION
 5-Minute Refresher: WEATHERING AND EROSION Weathering and Erosion Key Ideas Weathering is the wearing away of the surface of rock, soil, and minerals into smaller pieces. Example of weathering: Wind and
The Deepwater Horizon Oil Spill Part I. Unit Conversion
 The Deepwater Horizon Oil Spill Part I. Unit Conversion Why? The Deepwater Horizon oil spill (also known as the BP oil spill) began on 4/20/2010 and ended when the well was capped on 7/15/2010. The spill
Proposal for Improve the Electrical Power Supply in Port Sudan Town
 Proposal for Improve the Electrical Power Supply in Port Sudan Town Naeim Farouk Department of Mechanical Engineering, Faculty of Engineering, Red Sea University, Port Sudan Sudan nmfarouk@gmail.com, naeemgely@yahoo.com
WATER AND DEVELOPMENT Vol. II - Types Of Environmental Models - R. A. Letcher and A. J. Jakeman
 TYPES OF ENVIRONMENTAL MODELS R. A. Letcher and A. J. Jakeman Centre for Resource and Environmental Studies, The Australian National University, Australia Keywords: environmental models, environmental
1. In the diagram below, the direct rays of the Sun are striking the Earth's surface at 23 º N. What is the date shown in the diagram?
 1. In the diagram below, the direct rays of the Sun are striking the Earth's surface at 23 º N. What is the date shown in the diagram? 5. During how many days of a calendar year is the Sun directly overhead
CONTINGENCY PLANNING FOR MARINE OIL SPILLS TECHNICAL INFORMATION PAPER
 CONTINGENCY PLANNING FOR MARINE OIL SPILLS TECHNICAL INFORMATION PAPER 16 Introduction An effective response to a spill of oil is dependent to a great extent on the preparedness of the organisations and
Ohmsett Trains Oil Spill Responders
 Ohmsett Trains Oil Spill Responders William Schmidt Jane-Ellen Delgado MAR Incorporated/Ohmsett Test Facility, Atlantic Highlands, NJ 07716 Ken Trudel SL Ross Environment Research, Ltd. Ottawa, Canada
How Do Oceans Affect Weather and Climate?
 How Do Oceans Affect Weather and Climate? In Learning Set 2, you explored how water heats up more slowly than land and also cools off more slowly than land. Weather is caused by events in the atmosphere.
Wind resources map of Spain at mesoscale. Methodology and validation
 Wind resources map of Spain at mesoscale. Methodology and validation Martín Gastón Edurne Pascal Laura Frías Ignacio Martí Uxue Irigoyen Elena Cantero Sergio Lozano Yolanda Loureiro e-mail:mgaston@cener.com
How To Find Natural Oil Seepage In The Dreki Area Using An Envisat Image
 rn ORKUSTOFNUN National Energy Authority Searching for natural oil seepage in the Dreki area using ENVISAT radar images. Ingibjorg J6nsd6ttir and Arni Freyr Valdimarsson, Faculty of Earth Sciences School
COASTAL DAMAGE INSPECTION SOUTHWEST VITI LEVU, FIJI AFTER CYCLONE SINA
 COASTAL DAMAGE INSPECTION SOUTHWEST VITI LEVU, FIJI AFTER CYCLONE SINA Brendan J. Holden SOPAC Technical Secretariat July 1992 SOPAC Technical Report 148 Prepared for: South Pacific Applied Geoscience
WEATHERING, EROSION, AND DEPOSITION PRACTICE TEST. Which graph best shows the relative stream velocities across the stream from A to B?
 NAME DATE WEATHERING, EROSION, AND DEPOSITION PRACTICE TEST 1. The diagram below shows a meandering stream. Measurements of stream velocity were taken along straight line AB. Which graph best shows the
IHCANTABRIA and Marine Renewables
 IHCANTABRIA and Marine Renewables Assessment and forecast of energy resources in the marine environment (waves, wind, currents, tides) Design, development and testing of marine renewable energy technologies
The Integration of Hydrographic and Oceanographic Data in a Marine Geographic Information System U.S. Hydro 2015
 The Integration of Hydrographic and Oceanographic Data in a Marine Geographic Information System U.S. Hydro 2015 Karen Hart CARIS USA Oceanography and Hydrography Defined Oceanography: The branch of Earth
Monsoon Variability and Extreme Weather Events
 Monsoon Variability and Extreme Weather Events M Rajeevan National Climate Centre India Meteorological Department Pune 411 005 rajeevan@imdpune.gov.in Outline of the presentation Monsoon rainfall Variability
Hurricanes and Storm Surge www.hcfcd.org/tropicalweather
 Hurricanes and Storm Surge www.hcfcd.org High-level winds fl ow outward Strong surface winds spiral inward EYE Calm, sometimes cloudfree, sinking air Air sinks in calm area at the storm s eye THUNDERSTORMS
METIER Course No. 6: Remote Sensing & Hydrosphere Helsinki 6 November 2008 Kati Tahvonen Finnish Environment Institute
 The Use of Remote Sensing, Drifting Forecasts and GIS Data in Oil Response and Pollution Monitoring METIER Course No. 6: Remote Sensing & Hydrosphere Helsinki 6 November 2008 Kati Tahvonen Finnish Environment
RUSSIAN LEGISLATION AND OIL SPILL RESPONSE
 1 RUSSIAN LEGISLATION AND OIL SPILL RESPONSE Dr. G.N. Semanov, Dr. A.A.Ivanchin CNIIMF, ltd Kavalergardskaya str., 6, St.Petersburg, 191015, Russia. RUSSIA HAS NOTICEABLY INCREASED OIL TRANSPORTATION BY
EPA Oil Spill Research Grant Program
 EPA Oil Spill Research Grant Program Mitch Lasat, Ph.D. National Center for Environmental Research Role of the National Center for Environmental Research (NCER) - Manage EPA/ORD extramural research grants
Oil Spill Response Methods
 Oil Spill Response Methods Summary: This lecture gives students an overview of the equipment, procedures, and strategies used in oil spill response. This lesson builds on The Fate of Spilled Oil (although
Storm tide is the water level rise during a storm due to the combination of storm surge and the astronomical tide.
 INTRODUCTION TO STORM SURGE Introduction to Storm Surge BOLIVAR PENINSULA IN TEXAS AFTER HURRICANE IKE (2008) What is Storm Surge? Inland Extent Storm surge can penetrate well inland from the coastline.
imgkid.com OIL SPILLS
 OIL SPILLS imgkid.com OIL SPILLS An oil spill occurs when liquid petroleum hydrocarbon is released into the environment. The term applies to spills in the ocean or coastal waters, rivers, or on land. Oil
Natural Resource Damage Assessment and Restoration
 Natural Resource Damage Assessment and Restoration Sarah Allan NOAA Office of Response and Restoration Anchorage, AK sarah.allan@noaa.gov NOAA OR&R United States Department of Commerce National Oceanic
1) Summary of work performed and progress made during preceding month
 Summary of work performed and progress made during preceding month") Mapping and Characterization of Recurring Spring Leads and Landfast Ice in the Chukchi and Beaufort Seas, Coastal Marine Institute Project (NOFA MMS09HQPA0004T) Monthly progress report, June 2010 1) Summary
Mapping and Characterization of Recurring Spring Leads and Landfast Ice in the Chukchi and Beaufort Seas, Coastal Marine Institute Project (NOFA MMS09HQPA0004T) Monthly progress report, June 2010 1) Summary
ANALYSIS OF OIL SPILL TRENDS IN THE UNITED STATES AND WORLDWIDE
 ANALYSIS OF OIL SPILL TRENDS IN THE UNITED STATES AND WORLDWIDE Dagmar Schmidt Etkin Environmental Research Consulting 75 Main Street Winchester, Massachusetts 189 ABSTRACT: This presentation examines
8.5 Comparing Canadian Climates (Lab)
") These 3 climate graphs and tables of data show average temperatures and precipitation for each month in Victoria, Winnipeg and Whitehorse: Figure 1.1 Month J F M A M J J A S O N D Year Precipitation 139
These 3 climate graphs and tables of data show average temperatures and precipitation for each month in Victoria, Winnipeg and Whitehorse: Figure 1.1 Month J F M A M J J A S O N D Year Precipitation 139
Education and research programs at FEA in areas related to the oil and gas sector
 Education and research programs at FEA in areas related to the oil and gas sector October 11, 2013 Accreditation The American University of Beirut (AUB) has been accredited since 2004 by the Commission
Chapter 18 Introduction to. A f r i c a
 Chapter 18 Introduction to A f r i c a Ch. 18:1 Landforms & Resources 1. Africa s shape & landforms are the result of its location in the southern part of the ancient supercontinent of. Pangaea Over thousands
4.4 GRAPHICAL AND ANALYTICAL SOFTWARE VISUALIZATION TOOLS FOR EVALUATING METEOROLOGICAL AND AIR QUALITY MODEL PERFORMANCE
 4.4 GRAPHICAL AND ANALYTICAL SOFTWARE VISUALIZATION TOOLS FOR EVALUATING METEOROLOGICAL AND AIR QUALITY MODEL PERFORMANCE Irene Lee * Exponent Inc., Natick, Massachusetts 1. INTRODUCTION A critical part
MBJ Environmental Programmes
 MBJ Airports Limited Environmental Policy The following is MBJ Airports Limited s (MBJ) Environmental Policy for Sangster International Airport (SIA): Integrate environmental management measures with planning,
Introduction to Natural Resource Damage Assessment
 Introduction to Natural Resource Damage Assessment Topics Overview Legal: Laws and Regulations NRDA Process Scaling Injuries and Restoration Restoration in the Arctic Summary 2 1 Top Three Things to Know
Storm tide is the water level rise during a storm due to the combination of storm surge and the astronomical tide.
 INTRODUCTION TO STORM SURGE Introduction to Storm Surge National Hurricane Center Storm Surge Unit BOLIVAR PENINSULA IN TEXAS AFTER HURRICANE IKE (2008) What is Storm Surge? Inland Extent Storm surge can
Lesson Plan for Oil Spills Part 2: Cleaning Up an Oil Spill Written by Phillip Tu (UC Berkeley) and adapted by Liz Roth-Johnson (UCLA)
 and adapted by Liz Roth-Johnson (UCLA)") Lesson Plan for Oil Spills Part 2: Cleaning Up an Oil Spill Written by Phillip Tu (UC Berkeley) and adapted by Liz Roth-Johnson (UCLA) Introduction An oil spill is the release of a liquid petroleum hydrocarbon
Lesson Plan for Oil Spills Part 2: Cleaning Up an Oil Spill Written by Phillip Tu (UC Berkeley) and adapted by Liz Roth-Johnson (UCLA) Introduction An oil spill is the release of a liquid petroleum hydrocarbon
Climate Change Impacts in the Asia/Pacific Region
 Climate Change Impacts in the Asia/Pacific Region Global CC threat CC in the A/P region The Stern Review and IPCC 4 th Assessment Report both state that climate change will have adverse impact on people
Waves disturbances caused by the movement of energy from a source through some medium.
 Oceanography Chapter 10 Waves disturbances caused by the movement of energy from a source through some medium. Floating Gull- Figure 10.1 water is not moving only the energy is moving through the water.
FRANCE NATIONAL ORGANISATION
 FRANCE NATIONAL ORGANISATION 13.1. INTRODUCTION France has decided not to form a single multi-purpose force to combat accidental pollution in the marine environment. Co-ordination of the existing services
AP ENVIRONMENTAL SCIENCE 2015 SCORING GUIDELINES
 AP ENVIRONMENTAL SCIENCE 2015 SCORING GUIDELINES Question 3 Oil spills can be devastating in scope and damage. Since 1900, there have been many oil spills around the world that have had significant ecological
Southeastern New Hampshire Hazardous Materials Response Team
 Southeastern New Hampshire Hazardous Materials Response Team Boom Deployment Each oil spill presents different challenges depending on the type of oil spilled, the location, weather, time of day, the manpower
RESTORATION AND ENHANCEMENT OF SOUTHERN CALIFORNIA LAGOONS
 RESTORATION AND ENHANCEMENT OF SOUTHERN CALIFORNIA LAGOONS by Hany Elwany, Ph.D. Scripps Institution of Oceanography Headwaters to Oceans Conference 25 October 2003 CE Ref #03-22 San Diego County Lagoons
ATTACHMENT F ONSHORE PIPELINES DECOMMISSIONING GUIDELINE 1. INTRODUCTION
 ATTACHMENT F ONSHORE PIPELINES DECOMMISSIONING GUIDELINE 1. INTRODUCTION After concession is expired or at the end of its economic life, pipeline network and all associated structures are due for decommissioning
How do abiotic factors and physical processes impact life in the ocean?
 This website would like to remind you: Your browser (Apple Safari 7) is out of date. Update your browser for more security, comfort and the best experience on this site. Activitydevelop Ocean Abiotic Factors
CSCAP MEMORANDUM No. 15 The Security Implications of Climate Change
 CSCAP MEMORANDUM No. 15 The Security Implications of Climate Change A Memorandum from the Council for Security Cooperation in the Asia Pacific (CSCAP) June 2010 CSCAP Memorandum No. 15 The Security Implications
CIESIN Columbia University
 Conference on Climate Change and Official Statistics Oslo, Norway, 14-16 April 2008 The Role of Spatial Data Infrastructure in Integrating Climate Change Information with a Focus on Monitoring Observed
The Four Seasons. A Warm Up Exercise. A Warm Up Exercise. A Warm Up Exercise. The Moon s Phases
 The Four Seasons A Warm Up Exercise What fraction of the Moon s surface is illuminated by the Sun (except during a lunar eclipse)? a) Between zero and one-half b) The whole surface c) Always half d) Depends
Tide - rhythmic oscillation of the ocean surface due to gravitational & centrifugal forces ( inertia ) between the Earth, Moon and Sun.
 between the Earth, Moon and Sun.") Chapter 4: The Changing Level of the Sea Tides Longer Scale Variations Influence on Beaches Tide - rhythmic oscillation of the ocean surface due to gravitational & centrifugal forces ( inertia ) between
Chapter 4: The Changing Level of the Sea Tides Longer Scale Variations Influence on Beaches Tide - rhythmic oscillation of the ocean surface due to gravitational & centrifugal forces ( inertia ) between
Operation Oil Spill Cleanup
 Name Class Date Inquiry Lab Operation Oil Spill Cleanup DESIGN YOUR OWN Offshore oil drilling and the use of supertankers for transporting oil pose the risk of oil spills. Oil spills can damage commercial
ENVIRONMENTAL CHANGES
 reflect How do you respond to environmental changes? Maybe you wear different types of clothes in different seasons. Maybe you only ride your bike during certain times of the year. What if you moved to
Real-time Ocean Forecasting Needs at NCEP National Weather Service
 Real-time Ocean Forecasting Needs at NCEP National Weather Service D.B. Rao NCEP Environmental Modeling Center December, 2005 HYCOM Annual Meeting, Miami, FL COMMERCE ENVIRONMENT STATE/LOCAL PLANNING HEALTH
APPENDIX 2A. Shah Deniz Production Sharing Agreement Extract
 APPENDIX 2A Shah Deniz Production Sharing Agreement Extract Shah Deniz Production Sharing Agreement Extract ARTICLE 26 - Environmental Protection and Safety 26.1 Environmental Standards Contractor shall
Physical Sciences, Mathematics & Engineering Division Earth & Space Sciences Program
 Physical Sciences, Mathematics & Engineering Division Earth & Space Sciences Program Geology 20: General Oceanography ONLINE An Introduction to Geological and Physical Oceanography Fall Quarter, 2015 GEOL
Project abstracts (not edited) of winners of Phase 1 of the SBRI call on Adaptive Autonomous Ocean Sampling Networks
 of winners of Phase 1 of the SBRI call on Adaptive Autonomous Ocean Sampling Networks") Project abstracts (not edited) of winners of Phase 1 of the SBRI call on Adaptive Autonomous Ocean Sampling Networks NOC-DSTL-Innovate UK SBRI team Version 1: 01.04.2015 SBRI NOC-AAOSN-205 - Extending
Project abstracts (not edited) of winners of Phase 1 of the SBRI call on Adaptive Autonomous Ocean Sampling Networks NOC-DSTL-Innovate UK SBRI team Version 1: 01.04.2015 SBRI NOC-AAOSN-205 - Extending
SIXTH GRADE WEATHER 1 WEEK LESSON PLANS AND ACTIVITIES
 SIXTH GRADE WEATHER 1 WEEK LESSON PLANS AND ACTIVITIES WATER CYCLE OVERVIEW OF SIXTH GRADE WATER WEEK 1. PRE: Evaluating components of the water cycle. LAB: Experimenting with porosity and permeability.
Nenad Mladineo. Marko Mladineo. Marin Stosic
 Nenad Mladineo University of Split, Faculty of Civil Engineering, Architecture and Geodesy, Croatia mladineo@gradst.hr Marko Mladineo University of Split, Faculty of Electrical Engineering, Mechanical,
April 20, 2012. Two years later: the tragedy of the Deepwater Horizon oil spill
 April 20, 2012 Two years later: the tragedy of the Deepwater Horizon oil spill The most significant findings from the investigations that succeeded the Deepwater Horizon rig explosion are that the safety
FDOU Project 26B Task 4 Our Florida Reefs Community Working Group Scenario Planning Results
 FDOU Project 26B Task 4 Our Florida Reefs Community Working Group Scenario Planning Results Florida Department of Environmental Protection Coral Reef Conservation Program Project 26B FDOU Project 26B Task