NatureMaps 3.0 Help Guide
|
|
|
- Chad McGee
- 7 years ago
- Views:
Transcription
1 NatureMaps 3.0 Help Guide
2 Creative Commons Attribution 4.0 Crown in right of the State of South Australia, Department of Environment, Water and Natural Resources, 2016
3 Table of Contents Section 1: Getting Started... 5 NatureMaps Layout... 6 Navigating Around the Map... 7 Selecting a base map... 7 Layer List Panel... 8 Identify Address or Location Search Right Click Menu Section 2: Using the NatureMaps Toolbar Tabbed Toolbar General Tools Initial Extent Previous Extent Print Tool Query Builder Tool Filter Builder Tool Upload Data Tool Zoom to XY Tool Plot Coordinates Tool Google Street View Share Map via Select Tools Point Multi Point Line Polygon Rectangle Extended Select Tools Measure Tools Line Measurement Freehand Line Measurement Polygon Measurement Freehand Shape Measurement Circle Measurement Rectangle Measurement Editing Measurements... 42
4 Exporting Measurements Draw Tools Drawing Styling Editing Drawings Exporting Drawings Find Tools NPWSA Reserve Marine Park Hundred LGA Flora Tools Species List Rated Species List Show a Species Distribution Show Species by Subregion Fauna Tools Species List Rated Species List Show a Species Distribution Show Species by Subregion... 51
5 Section 1: Getting Started
6 NatureMaps Layout Address or Location Search: type an address or a location to search on 7 Zoom buttons: zoom in or out using the + or - buttons 2 Toolbar tabs: tools are grouped by function. Select the tab to display the required tools 8 Bookmark: create or open a bookmark 3 Toolbar: contains the tools that interact with the map or perform a specific function 9 Panel tabs: displays a tab for each open panel. Click the tab to swap between the different panels eg Home, Layer List, Results 4 Toolbar icon: shows or hides the toolbar when you click the icon 10 Base Maps: lists the base maps you can select from 5 Panel icon: expand, Collapse or hide the information panel using this button 11 Coordinate display: select the coordinate system to display 6 Geolocation: Activate geolocation tools 12 Map Tip: map tip appears when you left click on a feature. Click View Additional Details to find out more information

7 Navigating Around the Map In NatureMaps most navigation can be done using the mouse, but at times you may also use a key press in combination with a mouse click and dragging across the map. If you re using a touch screen, touch a spot on the map and move your finger to move the map around. Double tap or pinch outwards to zoom in. Pinch inwards to zoom out. On the desktop map, you can use the following controls: To Pan or move the map. Move the map left or right. Move the map up or down Zoom in or out using the Mouse Zoom in or out using the Map Tools Do this Click and hold the left mouse button and drag the map in any direction. Press the Left or Right arrow keys on the keyboard. Press the Up or Down arrow keys on the keyboard. Scroll the mouse wheel away from you to zoom in; towards you to zoom out. Click the Plus + or Minus - to zoom in or out. Zoom in to a specific region on the map. Zoom in or out using the keyboard Press SHIFT, hold down the left mouse button and drag a rectangle around the area you want to zoom in to. Press the Plus + key to zoom in. Press the Minus - key to zoom out. Selecting a base map The base map menu in the bottom left of the map view lists the base maps available. There are currently 3 base maps you can choose from: Topo the topographic basemap resembles a traditional paper based topographic map. It is best suited to use in regional areas, however, depending on the intended use can also be used in metropolitan areas. Street Map - This can be considered a pseudo "Street Directory" type map which also includes the parcel cadastre when zoomed in far enough. Imagery - Is a tile cache of the South Australian Governments latest aerial photography
8 Layer List Panel The Layer List Panel shows a list of all the layers currently available through NatureMaps. From here you can turn layers on and off as desired. When you first open the Layer List you ll be presented with the top level folders. To expand the folder click on the activate the folder. next to the Folder name, and check the box to

9 To turn a layer on click the check box next to the layer name. If a layer name is greyed out and italic, this means that it has a scale dependency. You will be able to check it on but it won t became active until you have zoomed to the appropriate scale. Top Folder Level Sub Folder Level Active Layer Scale Dependant Layer Certain folders within NatureMaps have a restriction whereby only one layer in that folder can be activated at a time. This is indicated by a circle check option One layer is activated under these folders, toggle between the layers to see other features. You will need to uncheck the folder itself to turn off the layer.
10 To view the metadata and, where available, the data download for a particular layer. Click on the arrow to the right of the Layer name and select the Metadata or Data Download link. Identify In the new version of NatureMaps the traditional Identify button has been replaced by a left mouse click Map Tips function. When you left click on a feature you will be presented with the map tips box showing a brief attribute description of that feature

11 If more than 1 feature is present click on the arrow to cycle through identified features More attribute details are available, on an identified feature, when you click the View Additional Details option
12 Address or Location Search NatureMaps uses the Address Validation Service from Location SA to enable you to search for street addresses or gazetted locations within South Australia To find a specific address, type the address you wish to find in the Dialog Box type and click on the magnifying glass, or, hit Return on your keyboard. The closest match results to your query are returned in the left hand side panel. Select the matching result in the Results Panel and NatureMaps will zoom to that location.

13 To find a place or location, type the location you wish to find in the Dialog Box type and click on the magnifying glass, or, hit Return on your keyboard. Depending on the search parameters entered a large number of results might be returned. Try refining your search parameter to something more specific. Select the matching result in the Results Panel and NatureMaps will zoom to that location.
 at selected location 6 Add some text at that location 2 Coordinates at that location.")
14 Right Click Menu Using the right mouse button at any point on the map, you can find information about that location and perform a number of actions Address information (where available) at selected location 6 Add some text at that location 2 Coordinates at that location. Change coordinate display by selecting the 7 Centres the map screen to that location appropriate coordinate system from the display options at the bottom of the screen 3 Find out information about features displayed at that location 8 Zooms screen to the initial start-up extent 4 Draw a point on the screen at that location 9 Clears any highlighted features 5 Plot coordinates on the screen for that location 10 Retrieves, where available, imagery information (capture date and resolution) at that location. Note: please ensure that imagery base map is activated
15 Section 2: Using the NatureMaps Toolbar

16 Tabbed Toolbar The tools in NatureMaps are now available from a series of Tabs at the very top of the map view. General Tools The General Tools menu contains the general tools that are used within NatureMaps Initial Extent Returns the map view to the opening/initial extent of the map view Previous Extent Zooms back to the previous map extent Print Tool Activates the Print function

17 Select the desired layout from the Layout dropdown list Select the desired format from the Output Format dropdown list. Enter the output scale you wish for the printed map

18 Enter the desired title in the Title text box, then click OK to generate the map. When the Map is completed, click on the link to open the map. You can then save or print the map as required. Query Builder Tool The Query Builder tool enables you to construct queries that search for specific features in a layer. The results of a query list the features in the specified layer that match the query conditions. In addition, each feature in the query results is marked on the map with a pushpin. The features do not have to be visible at the current scale for the pushpins to show. Once you have activated the Query tool, select the layer to run the query on.
 Chose an operator: Numeric and Date fields offer mathematical functions (=,<,>); Text fields offer partial matches or whole matches")
19 Select the field you wish to query (e.g. If you wanted to see fires that happened in 2014, choose Fire Year) Chose an operator: Numeric and Date fields offer mathematical functions (=,<,>); Text fields offer partial matches or whole matches (=, starts with etc.). Choose a value: for numeric fields, enter a number; For text fields, enter text. - Example values are available in a drop-down menu. At this point you can further refine your query by selecting the Add Another Condition button. In this example, the query results returned from the Fire History layer would only be the bushfires that occurred in 2015
20 You can then view all the results in a tabular form by selecting the Switch to Table options from the Panel Actions Menu

21 Filter Builder Tool The Filter Builder Tool works similarly to the Query Builder Tool, however a filter limits the features that show on the map based on a set of criteria. Upload Data Tool The Upload Data Tool allows you to upload files containing spatial, coordinate or address data. The data is uploaded as a new feature layer, and can be interacted with as with any other layer. This includes support for identify, query and filter operations. The uploaded data is only visible whilst the map is open, when the session ends the data is removed from the map. Supported file types for upload include:.csv.xlsx.kml.shp.gpx.zip containing multiple shapefiles NOTE: When uploading a single shapefile (.shp) you must also select all associated files, including.prj,.dbf,.shx etc. Uploading a shapefile Click Bowse to find the file(s) for upload, then click Upload

22 Enter the desired Layer name, then click Proceed Select the desired styling, then click Proceed The uploaded shapefile is then displayed on the map

23 Uploading a csv, gpx or xlsx Click Bowse to find the file for upload, then click Upload Select the X and Y axis columns and the appropriate Spatial Reference, then click Confirm Enter the desired Layer name, then click Proceed

24 A dialog box will appear, stating how many records will be mapped and how many have been rejected eg. Due to missing coordinates. Click Done Select the desired styling, then click Proceed The uploaded file is then displayed on the map


25 Uploading a kml Click Bowse to find the file for upload, then click Upload Enter the desired Layer name, then click Proceed Select the desired styling, then click Proceed The uploaded file is then displayed on the map
26 Zoom to XY Tool The Zoom to XY Coordinate Tool allows you to enter a set of coordinates and zoom to that location on the map. From the dropdown list, select the desired projection and click OK. In this example MGA Zone 54 is chosen In the dialog box, enter the coordinates and click OK NatureMaps will then zoom to that location and place a point on the screen Tip: The style and colour of the point can be changed using the Edit function under the Draw Tools tab. Tip: The point can be deleted using the Erase function under the Draw Tools Tab.

27 Plot Coordinates Tool The Plot Coordinates Tool gives you the ability to plot a series of coordinates for specific locations on the map. Plotted coordinates can be printed or exported as a csv or xlsx from the results table. Plotted coordinates are removed from the map when the current session ends. 1 To plot a coordinate click at the location on the screen 5 The list of plotted coordinates is also displayed in the results table 2 The coordinate system can be changed from either the dropdown menu or coordinate display widget 6 From the Results Table action panel, the list of plotted coordinates can then be exported to a.csv or.xlsx file 3 To centre on a particular set of coordinates, click on the number next to the set. For further actions, click on the ellipse ( ) to the right of the set 7 Using the Snapping tools you can also select individual layers to snap the cursor to when plotting a coordinate. 4 Coordinates can also be manually added in the XY boxes and clicking Add 8 Coordinates Panel Action Menu
28 Clicking on the ellipse ( ) next to a set of coordinates, opens a Further Actions Panel Hide Coordinates Temporarily hides a set of coordinates from view. If a set is already hidden then the Show Coordinate option will be available Edit Allows you to edit the locations of a set of coordinates, either manually or by clicking on a new location on screen. When plotted coordinates are being edited the callout changes from black to blue Delete Deletes the set of coordinates and removes it permanently from the map. All displayed coordinates can be either hidden or deleted from the Coordinates Panel Action Menu


29 Tip: You can also plot a coordinate from the Right-Click menu and selecting Plot a Coordinate Google Street View The Google Street View Tool opens an integrated interactive panel to Google Street View When an integrated map is open, the viewer's map displays a marker that indicates the centre of the integrated map. Dragging the marker on the map pans and updates integrated map view.

30 You can pan and zoom the NatureMaps View and Google Street View maps independently of each other by using the standard map controls for panning and zooming. When you pan or move around in the Google Street View map, the marker on the NatureMaps view stays synchronized with the Google Street View map. Viewpoint Indicator: Shows the location marker that is used in NatureMaps. The Viewpoint Indicator is for information only it is not clickable. Center: Moves the location marker to the centre of the NatureMaps view and rescales Google Street View to match. Note: you may need to manually reposition the marker on a road for Google Street View to return Street View data. Dock/Undock: Allows the user to dock and undock the Google Street View map from the viewer. Depending on the browser settings, the map may undock to a new tab or to a new window. Note: Tablets and Smart Phones do not support the undocking function. Share Map via The Share Map via Tool give you the ability to share a link of the current map view and active layers via . Select Tools The Select Tools tab offers a series of selection/identify tools that will allow you to select and return information about features in NatureMaps. Point Activated Select Tools enable further options
31 Activate the Point tool and click or tap on a feature on the map to return information. Multi Point Activate the Multi Point tool and click or tap on features on the map (double click or double tap to finish) to return information. Line Activate the Line tool and click to start then draw a line (double click or double tap to finish) to intersect through the features on the map you are interested in. Polygon Activate the Polygon tool and click to start then draw a shape (double click or double tap to finish) around the features on the map you are interested in. Rectangle Activate the Rectangle tool and click and drag a rectangle around the features on the map you are interested in. Note: All Select Tools are Sticky meaning a tool will remain active until you click on it again. Extended Select Tools Depending on the Select Tool chosen a number of extra tools will be made available to you.
32 Enable Buffering Enabling buffering allows the surrounding area of a selected feature to be included in a select operation. For example you could select features that are within a certain distance of a point on the map Select the Point Tool and click Enable Buffering. Enter the required distance and measurement unit, then click at a location on the map In this example, all the drillholes within 100 meters of the centre of the oval are selected

33 Note: You can use the Buffer Tool with all the available Select Tools Tip: You can also apply a buffer to an already selected feature From the Selected Features Action Panel Menu, select Show Buffer Options Enter a Distance and Measurement Unit

34 Click Continue In the example above all the drill holes within 50m of the initially selected drill hole have now been selected.
 you wish to snap to, using the Select Snapping Layers function In the example below Enable Snapping has been activated and the cursor has")
35 Snapping Snapping allows you to precisely select features on the map by snapping to the nearest point, vertex or edge of that within the radius around the mouse pointer. When snapping you must ensure that you select the Layer(s) you wish to snap to, using the Select Snapping Layers function In the example below Enable Snapping has been activated and the cursor has snapped to the nearest drill hole feature within the cursors radius. Note: Snapping is only available in the desktop environment, it is not configured for tablets or smart phones. Note: The Snapping tool is not available for the Rectangle Select Tool Identifiable Layers By selecting the Identifiable Layers function you can choose which layers are affected by the Select Tools. Note: All Layers are selectable/identifiable by default.

36 Measure Tools The Measurement Tools allow you to measure distance and area on the map. You can also edit your measurements and export as a csv, xlsx and shapefile using other tools and functionality within NatureMaps. Line Measurement Activated Measure Tools enable further options To measure a line select the Line Measurement Tool and click to start measuring a line, click at each direction change point then double click to finish. For a precise measurement along a feature in the Layers List, enable Snapping. Snapping allows you to precisely measure a feature on the map by snapping to the nearest point, vertex or edge within the radius around the mouse pointer. When snapping you must ensure that you select the Layer(s) you wish to snap to, using the Select Snapping Layers function

37 Freehand Line Measurement To measure a freehand line, click at the starting point, keeping the mouse button pressed, draw the line. Release the mouse button to finish.
, select the Polygon Measure Tool, click on the map to start, click at each direction change point then double click to finish.")
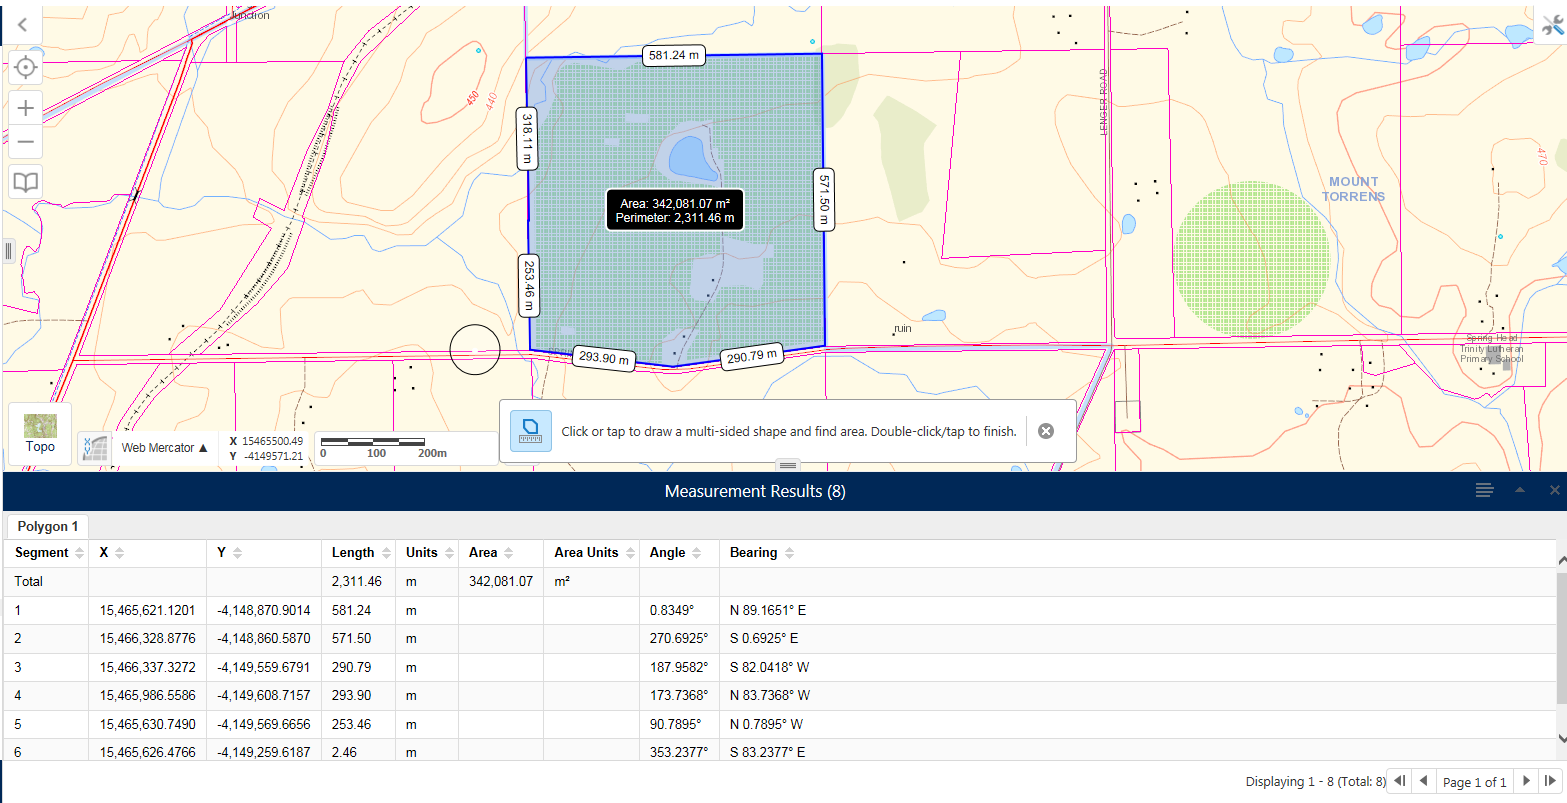
38 Note: The measurement results table is not supported with a freehand measurement. Note: The Snapping function is not supported with a freehand measurement. Polygon Measurement To measure a multi-sided shape (polygon), select the Polygon Measure Tool, click on the map to start, click at each direction change point then double click to finish. For a precise area measurement of a feature in the Layers List, enable Snapping. Snapping allows you to precisely measure a feature on the map by snapping to the nearest point, vertex or edge within the radius around the mouse pointer. When snapping you must ensure that you select the Layer(s) you wish to snap to, using the Select Snapping Layers function
39

40 Tip: You can change the units of measurement for the Length and /or Area of a measurement from the Measurements dropdown list that becomes available once a measurement tool has been activated Freehand Shape Measurement To measure a freehand shape, select the Freehand Shape Tool click at the starting point, keeping the mouse button pressed, draw the shape. Release the mouse button to finish.

41 Note: The measurement results table is not supported with a freehand measurement. Note: The Snapping function is not supported with a freehand measurement. Circle Measurement To measure a circle on screen, select the Circle Measurement Tool, click a point on the screen and drag out the circle, then release the mouse button to finish. Note: The Snapping function is not supported with a circle measurement. Note: The measurement results table is not supported with a freehand measurement.
42 Rectangle Measurement To measure a rectangle on screen, select the Rectangle Measurement Tool, click a point on the screen and drag out the area, then release the mouse button to finish. Note: The Snapping function is not supported with a rectangle measurement. Editing Measurements When a measurement is performed, the segment, perimeter, or area can be edited using the Edit Tool, the measurements are automatically recalculated and adjusted on the map.

43 Individual measurements can be erased (deleted) using the Erase Tool. When selected, click on a measurement to immediately and permanently delete. Note: This cannot be undone The Clear Tool permanently erases all measurements and drawings in the current map session. You will be presented with the following warning before proceeding. Exporting Measurements You can export the measurement results to a file, by opening the Panel Actions Menu in the Results Table and selecting either Export to CSV or Export to XLSX

44 You can also export your measurement graphic as a Shapefile. However, the area, perimeter and segment lengths are NOT exported. To export to a shapefile, open the Draw Tools tab and select the Export Drawing Tool
45 Draw Tools Activated Draw Tools enable further options You can add text, point, line and polygon drawings to the map using the various drawing options under the Draw Tools Tab. Some of the draw options also participate in the Snapping Function. Snapping allows you to precisely select features on the map by snapping to the nearest point, vertex or edge within the radius around the mouse pointer. When snapping you must ensure that you select the Layer(s) you wish to snap to, using the Select Snapping Layers function Note: the following draw options do not participate in the Snapping Function; Freehand Line Arrow Ellipse Circle Rectangle Drawing Styling There are a number of style choices for the various drawing options. These can be selected either prior to commencing the drawing or afterward by selecting the graphic with the Edit Tool active. To select an appropriate style select the Style Tool
 using the")

46 Editing Drawings You can edit an existing graphic by using the Edit Tool. You can then resize, shape and restyle the drawing as desired Individual drawings can be erased (deleted) using the Erase Tool. When selected, click on a measurement to immediately and permanently delete. Note: This cannot be undone The Clear Tool permanently erases all measurements and drawings in the current map session. You will be presented with the following warning before proceeding.
47 Exporting Drawings The Export Drawings Tool creates a shapefile(s) in an Export.zip file containing all of the drawings. The shapefile format is a vector data format for GIS software developed by Esri. Shapefiles support point, line, and area features. A valid shapefile requires one.shp file as well as a.shx and.dbf file. If the Edit Drawings tool is enabled, the Export Drawings tool will be disabled. When the Export Drawings tool is selected, a confirmation dialog will appear. Once accepted, the Export.zip file is saved to your PC. The Export.zip contains the user's drawings as shapefiles. Separate shapefiles are exported for each type of drawing. For example, if a map contained multiple point drawings and multiple polygon drawings, the export will contain a combined point.shp file and a combined polygon.shp file. Combined shapefiles can have the following names: Point.shp Polygon.shp Polyline.shp Exported shapefiles do not include any measurements, although the geometry values and scale will be preserved. Similarly, exports do not include text or drawing styles from the onscreen drawing. Note: Export Drawings is not available on Tablets or Smart Phones Find Tools The Find Tools are a few quick search and zoom to tools for some commonly searched for features in NatureMaps. After selecting the desired feature in the dropdown menu, NatureMaps will zoom to, highlight that feature, and turn it on in the Layer List.

48 NPWSA Reserve Select a NPWSA Reserve from the dropdown list and click Search to zoom to that feature. Marine Park Select a Marine Park from the dropdown list and click Search to zoom to that feature. Hundred Select a Hundred from the dropdown list and click Search to zoom to that feature.
 layer for an area of interest.")
49 LGA Select a Local Government Area (LGA) from the dropdown list and click Search to zoom to that feature. Flora Tools Species List The Create Species List Tool generates and downloads a unique species list from the Flora Supertable (BDBSA) layer for an area of interest. Area of interest can be a DEWNR Reserve Natural Resource Management (NRM) Region or District IBRA Subregion Rated Species List The Rated Species List Tool generates and downloads a unique species list of both nationally and state rated Flora species for a manually defined area of interest (rectangle/polygon/current extent)
50 Show a Species Distribution The Show a Species Distribution Tool displays the distribution of a selected species or genus in South Australia from the Flora Supertable (BDBSA) layer Show Species by Subregion The Show Species by Subregion Tool shows where a Flora species has a conservation rating at subregional level in South Australia. Fauna Tools Species List The Create Species List Tool generates and downloads a unique species list from the Fauna Supertable (BDBSA) layer for an area of interest. Area of interest can be a DEWNR Reserve Natural Resource Management (NRM) Region or District IBRA Subregion Rated Species List The Rated Species List Tool generates and downloads a unique species list of both nationally and state rated Fauna species for a manually defined area of interest (rectangle/polygon/current extent)
51 Show a Species Distribution The Show a Species Distribution Tool displays the distribution of a selected species or genus in South Australia from the Fauna Supertable (BDBSA) layer Show Species by Subregion The Show Species by Subregion Tool shows where a Fauna species has a conservation rating at subregional level in South Australia.
52
Geocortex HTML 5 Viewer Manual
 1 FAQ Nothing Happens When I Print? How Do I Search? How Do I Find Feature Information? How Do I Print? How can I Email A Map? How Do I See the Legend? How Do I Find the Coordinates of a Location? How
3D-GIS in the Cloud USER MANUAL. August, 2014
 3D-GIS in the Cloud USER MANUAL August, 2014 3D GIS in the Cloud User Manual August, 2014 Table of Contents 1. Quick Reference: Navigating and Exploring in the 3D GIS in the Cloud... 2 1.1 Using the Mouse...
Help Document for WWW.SAGIS.ORG. Step by step, how-to instructions for navigating and using the Savannah Area GIS viewer.
 Help Document for WWW.SAGIS.ORG Step by step, how-to instructions for navigating and using the Savannah Area GIS viewer. 1 SAGIS Savannah Area GIS is focused on providing access to Geospatial data in a
Contents. The OWRB Floodplain Viewer. Creating Maps... 8. Helpful Tips... 10
 Contents QUICK START GUIDE... 2-5 Add layers...9 Search for Layers...9 COMPREHENSIVE GUIDE... 6 Navigate the map...6 Locate specific places...6 Add layer from file...9 Add layer from web...9 Display pop-up
Canterbury Maps Quick Start - Drawing and Printing Tools
 Canterbury Maps Canterbury Maps Quick Start - Drawing and Printing Tools Quick Start Guide Standard GIS Viewer 2 Canterbury Maps Quick Start - Drawing and Printing Tools Introduction This document will
GoodReader User Guide. Version 1.0 GoodReader version 3.16.0
 GoodReader User Guide Version 1.0 GoodReader version 3.16.0 Contents Operating GoodReader 1 Send PDF files to Your ipad 2 Copy Files with itunes 2 Copy Files to a Cloud Service 5 Download Files from the
How to use PGS: Basic Services Provision Map App
 How to use PGS: Basic Services Provision Map App The PGS: Basic Services Provision Map App The main features of the PGP Basic Services web application includes: Navigation Tools Map Tools Main Map Links
HELCOM Data and Map Service. User Manual
 HELCOM Data and Map Service User Manual Version 2.2 - February 2015 1 Table of contents 1. General Information... 3 1.1 Background... 3 1.2 Technical requirements... 3 1.3 Contact... 3 2. Accessing HELCOM
WebViewer User Guide. version 1.4.0. 2002-2013 PDFTron Systems, Inc. 1 of 13
 WebViewer User Guide version 1.4.0 1 of 13 Table of Contents Introduction...4 Desktop HTML5...5 Toolbar Menu...5 Display Modes...5 Zoom Options...5 Navigation Options...6 Tool Modes...6 Side Panel...7
WEB MAPPING TOOL DOCUMENTATION
 ENTERPRISE ZONES RE DESIGNATION WEB MAPPING TOOL DOCUMENTATION January 26, 2015 COVER PAGE TABLE OF CONTENTS INTRODUCTION 1 APPLICATION LAYOUT 2 WEB MAP NAVIGATION 3 LOCATION SEARCH 4 MAP LEGEND 5 BASEMAP
Texas Wildfire Risk Assessment Portal (TxWRAP) User Manual. Texas A&M Forest Service
 User Manual. Texas A&M Forest Service") Texas Wildfire Risk Assessment Portal (TxWRAP) User Manual Texas A&M Forest Service October 2012 Table of Contents 1 ABOUT TXWRAP... 7 1.1 ACCESSING TXWRAP... 7 1.2 GETTING SUPPORT... 8 Documentation...
Texas Wildfire Risk Assessment Portal (TxWRAP) User Manual Texas A&M Forest Service October 2012 Table of Contents 1 ABOUT TXWRAP... 7 1.1 ACCESSING TXWRAP... 7 1.2 GETTING SUPPORT... 8 Documentation...
Using the Kendall County GIS Basic GIS Viewer
 Using the Kendall County GIS Basic GIS Viewer Link to Viewer Gallery: http://gis.co.kendall.il.us/gisviewer_gallery.aspx Help and About Initial View Introduction Navigation Identify Tool Search Tool Search
WebViewer User Guide. version 2.1.0. 2002-2015 PDFTron Systems, Inc. 1 of 13
 WebViewer User Guide version 2.1.0 2002-2015 PDFTron Systems, Inc. 1 of 13 Table of Contents Introduction Desktop HTML5 Toolbar Menu Toolbar Buttons Page Navigation Display Modes Tool Modes Annotation
SMART Ink 1.5. Windows operating systems. Scan the following QR code to view the SMART Ink Help on your smart phone or other mobile device.
 SMART Ink 1.5 Windows operating systems User s guide Scan the following QR code to view the SMART Ink Help on your smart phone or other mobile device. Trademark notice SMART Ink, SMART Notebook, SMART
Map Navigation Controls. An Interactive, Locally Based Knowledge Resource LivingstonLive.org/maps OR gisapps/livingstonviewerinternal
 Livingston County s Internet Mapping Portal User Guide An Interactive, Locally Based Knowledge Resource LivingstonLive.org/maps OR gisapps/livingstonviewerinternal A vast majority of County government
Smoothboard 2.0 Updates. Software Version: 2.0 Document Version: 1.0
 Smoothboard 2.0 Updates Software Version: 2.0 Document Version: 1.0 Website Email : http://www.smoothboard.net : admin@smoothboard.net Attribution Non Commercial No Derivatives cc by-nc-nd http://creativecommons.org/licenses/by
ArcGIS online Introduction... 2. Module 1: How to create a basic map on ArcGIS online... 3. Creating a public account with ArcGIS online...
 Table of Contents ArcGIS online Introduction... 2 Module 1: How to create a basic map on ArcGIS online... 3 Creating a public account with ArcGIS online... 3 Opening a Map, Adding a Basemap and then Saving
DataPA OpenAnalytics End User Training
 DataPA OpenAnalytics End User Training DataPA End User Training Lesson 1 Course Overview DataPA Chapter 1 Course Overview Introduction This course covers the skills required to use DataPA OpenAnalytics
SMART Sympodium and Notebook Software 9.5
 SMART Sympodium and Notebook Software 9.5 What is a SMART Sympodium? Equipped with the same software as SMART Board interactive whiteboards, SMART Sympodium interactive pen displays are perfect for presenting
WFP Liberia Country Office
 1 Oscar Gobbato oscar.gobbato@wfp.org oscar.gobbato@libero.it WFP Liberia Country Office GIS training - Summary Objectives 1 To introduce to participants the basic concepts and techniques in using Geographic
www.lpi.nsw.gov.au SCIMS Online Support Guide
 www.lpi.nsw.gov.au SCIMS Online Support Guide November 2012 Document Status Revision Version 1.7 Version date 01/11/2012 Author Owner John Kelaher and Cheryl Wheeler Land and Property Information Surveying
Activity: Using ArcGIS Explorer
 Activity: Using ArcGIS Explorer Requirements You must have ArcGIS Explorer for this activity. Preparation: Download ArcGIS Explorer. The link below will bring you to the ESRI ArcGIS Explorer download page.
ArcGIS. Tips and Shortcuts. for Desktop
 ArcGIS Tips and Shortcuts for Desktop Map Navigation Refresh and redraw the display. F5 Suspend the map s drawing. F9 Zoom in and out. Center map. Roll the mouse wheel backward and forward. Hold down Ctrl
Editing Common Polygon Boundary in ArcGIS Desktop 9.x
 Editing Common Polygon Boundary in ArcGIS Desktop 9.x Article ID : 100018 Software : ArcGIS ArcView 9.3, ArcGIS ArcEditor 9.3, ArcGIS ArcInfo 9.3 (or higher versions) Platform : Windows XP, Windows Vista
Welcome to CorelDRAW, a comprehensive vector-based drawing and graphic-design program for the graphics professional.
 Workspace tour Welcome to CorelDRAW, a comprehensive vector-based drawing and graphic-design program for the graphics professional. In this tutorial, you will become familiar with the terminology and workspace
Introduction to Google SketchUp (Mac Version)
") Introduction to Google SketchUp (Mac Version) This guide is handy to read if you need some basic knowledge to get started using SketchUp. You will see how to download and install Sketchup, and learn how
Introduction to Google SketchUp (Mac Version) This guide is handy to read if you need some basic knowledge to get started using SketchUp. You will see how to download and install Sketchup, and learn how
ZoomText 10.1 for Windows 8 Quick Reference Guide Addendum
 ZoomText 10.1 for Windows 8 Quick Reference Guide Addendum This addendum to the ZoomText 10 Quick Reference Guide covers the new features and other changes specific to ZoomText 10.1 for Windows 8. For
City of Corpus Christi. Mobile GIS Viewer. For ipad
 City of Corpus Christi Mobile GIS Viewer For ipad MIS - GIS 3/9/2012 P a g e 1 Contents Requirements... 2 Installation... 2 Using the ArcGIS Mobile App... 4 Connect to the Corpus Christi Mobile GIS Map
Getting Started with the ArcGIS Predictive Analysis Add-In
 Getting Started with the ArcGIS Predictive Analysis Add-In Table of Contents ArcGIS Predictive Analysis Add-In....................................... 3 Getting Started 4..............................................
Browsing and working with your files and folder is easy with Windows 7 s new look Windows Explorer.
 Getting Started with Windows 7 In Windows 7, the desktop has been given an overhaul and makeover to introduce a clean new look. While the basic functionality remains the same, there are a few new navigation
Tips & Tricks for ArcGIS. Presented by: Jim Mallard, Crime Analysis Supervisor Arlington, Texas. 2007 IACA Conference Pasadena, Ca
 Tips & Tricks for ArcGIS Presented by: Jim Mallard, Crime Analysis Supervisor Arlington, Texas 2007 IACA Conference Pasadena, Ca Table of Contents Lock & Load Labels for Maximum Speed!...2 Choose your
Handout: Word 2010 Tips and Shortcuts
 Word 2010: Tips and Shortcuts Table of Contents EXPORT A CUSTOMIZED QUICK ACCESS TOOLBAR... 2 IMPORT A CUSTOMIZED QUICK ACCESS TOOLBAR... 2 USE THE FORMAT PAINTER... 3 REPEAT THE LAST ACTION... 3 SHOW
Using Microsoft Word. Working With Objects
 Using Microsoft Word Many Word documents will require elements that were created in programs other than Word, such as the picture to the right. Nontext elements in a document are referred to as Objects
SMART Board Beginning
 SMART Board Beginning Downloading the Software... 2 600 Series SMART Board... 2 800 Series SMART Board... 3 SMART Board Cleaning Options... 4 SMART Board Pens... 4 SMART Board Help... 4 Using the On Screen
Banner Document Management Suite (BDMS) Web Access Help
 Web Access Help") May 10 th, 2011 Banner Document Management Suite (BDMS) Web Access Help Division of Information Technology AppXtender Web Access Help: For questions regarding AppXtender Web Access, please contact the
May 10 th, 2011 Banner Document Management Suite (BDMS) Web Access Help Division of Information Technology AppXtender Web Access Help: For questions regarding AppXtender Web Access, please contact the
Kodiak Island Borough GIS Online Tools
 Kodiak Island Borough GIS Online Tools The Kodiak Island Borough website is located at http://www.kodiakak.us/ You can access the GIS resources by clicking on the MAP CENTER icon in the middle of the page,
Creating forms in Microsoft Access 2007
 Platform: Windows PC Ref no: USER 166 Date: 14 th January 2008 Version: 1 Authors: Derek Sheward, Claire Napier Creating forms in Microsoft Access 2007 This is the fourth document in a series of five on
Chapter 1. Creating Sketches in. the Sketch Mode-I. Evaluation chapter. Logon to www.cadcim.com for more details. Learning Objectives
 Chapter 1 Creating Sketches in Learning Objectives the Sketch Mode-I After completing this chapter you will be able to: Use various tools to create a geometry. Dimension a sketch. Apply constraints to
GeoMap.WA. user guide
 GeoMap.WA user guide Version 1.1 March 2011 Preface: The information provided is interpretive. The information is made available in good faith and derived from sources believed to be reliable and accurate
Introduction to Smart Board. Table of Contents. Connection Basics 3. Using the Board (Basics) 4. The Floating Tools Toolbar 5-6
 4. The Floating Tools Toolbar 5-6") Introduction to Smart Board Table of Contents Overview 2 Connection Basics 3 Using the Board (Basics) 4 The Floating Tools Toolbar 5-6 The Smartboard Smart Tool Buttons Collecting and Sharing Content with
Introduction to Smart Board Table of Contents Overview 2 Connection Basics 3 Using the Board (Basics) 4 The Floating Tools Toolbar 5-6 The Smartboard Smart Tool Buttons Collecting and Sharing Content with
Windows 8.1 Tips and Tricks
 Windows 8.1 Tips and Tricks Table of Contents Tiles... 2 Removing, Resizing and Moving Existing Tiles... 2 Adding New Tiles... 2 Returning to the Start Screen (Charms)... 3 The Search Feature... 3 Switching
How to georectify an image in ArcMap 10
 How to georectify an image in ArcMap 10 The University Library has a large collection of historical aerial photos for some North Carolina Counties ( http://www.lib.unc.edu/reference/gis/usda/index.html
Introduction to the TI-Nspire CX
 Introduction to the TI-Nspire CX Activity Overview: In this activity, you will become familiar with the layout of the TI-Nspire CX. Step 1: Locate the Touchpad. The Touchpad is used to navigate the cursor
Task Card #2 SMART Board: Notebook
 Task Card #2 SMART Board: Notebook Objectives: Participants will learn how to utilize the SMART Notebook. Table of Contents: Launching The SMART Notebook Page 1 Entering Text Page 1 Top Toolbar Page 2
Doña Ana County, NM Map Help
 Doña Ana County, NM Map Help Map Features Introduction 1. Toolbar 2. Zoom Control Buttons 3. Map/Legend Tabs 4. Layer Control 5. Parcel Search Tools 6. Selected Feature Attributes Toolbar The map toolbar
Getting Started With Mortgage MarketSmart
 Getting Started With Mortgage MarketSmart We are excited that you are using Mortgage MarketSmart and hope that you will enjoy being one of its first users. This Getting Started guide is a work in progress,
Internet Explorer 7. Getting Started The Internet Explorer Window. Tabs NEW! Working with the Tab Row. Microsoft QUICK Source
 Microsoft QUICK Source Internet Explorer 7 Getting Started The Internet Explorer Window u v w x y { Using the Command Bar The Command Bar contains shortcut buttons for Internet Explorer tools. To expand
Logo Design Studio Pro Guide
 Logo Design Studio Pro Guide This guide is distributed with software that includes an end-user agreement, this guide, as well as the software described in it, is furnished under license and may be used
In this session, we will explain some of the basics of word processing. 1. Start Microsoft Word 11. Edit the Document cut & move
 WORD PROCESSING In this session, we will explain some of the basics of word processing. The following are the outlines: 1. Start Microsoft Word 11. Edit the Document cut & move 2. Describe the Word Screen
Epson Brightlink Interactive Board and Pen Training. Step One: Install the Brightlink Easy Interactive Driver
 California State University, Fullerton Campus Information Technology Division Documentation and Training Services Handout Epson Brightlink Interactive Board and Pen Training Downloading Brightlink Drivers
Using the Cute Rich-Text Editor
 Using the Cute Rich-Text Editor This document is designed to provide users with a basic introduction to using the Cute rich-text editor to format text, create and modify tables, and to place charts and
BIGPOND ONLINE STORAGE USER GUIDE Issue 1.1.0-18 August 2005
 BIGPOND ONLINE STORAGE USER GUIDE Issue 1.1.0-18 August 2005 PLEASE NOTE: The contents of this publication, and any associated documentation provided to you, must not be disclosed to any third party without
LYON COUNTY GEOMOOSE 2 HELP DOCUMENT
 LYON COUNTY GEOMOOSE 2 HELP DOCUMENT TABLE OF CONTENTS Lyon County Geomoose 2 Help Document... 1 Introduction... 3 Quick Reference Chart... 4 The Interface... 4 The Table of Contents... 5 Quick Reference
Windows 8.1 Update 1 Supplement
 Illustrated Series Guide to Windows 8.1 Update 1 Changes June 2014 Table of Contents (CTRL+Click a link to navigate directly to Part 1, 2, 3, or 4.) Part 1: What Version of Windows Am I Using? Part 2:
VantagePoint PC Application Software USER MANUAL
 VantagePoint PC Application Software USER MANUAL 605-0183-004 A Overview Magellan VantagePoint software allows you to view, edit and store color maps on a personal computer, with zoom and pan functions
User s Guide to ArcView 3.3 for Land Use Planners in Puttalam District
 User s Guide to ArcView 3.3 for Land Use Planners in Puttalam District Dilhari Weragodatenna IUCN Sri Lanka, Country Office Table of Content Page No Introduction...... 1 1. Getting started..... 2 2. Geo-referencing...
CATIA Drafting TABLE OF CONTENTS
 TABLE OF CONTENTS Introduction...1 Drafting...2 Drawing Screen...3 Pull-down Menus...4 File...4 Edit...5 View...6 Insert...7 Tools...8 Drafting Workbench...9 Views and Sheets...9 Dimensions and Annotations...10
Watershed Ecosystem & Restoration Services (WERS Mapping Application) User s Guide
 User s Guide") Watershed Ecosystem & Restoration Services (WERS Mapping Application) User s Guide CONTACT Site Administrators: David Gillum, GISP, AACO, OIT Rick Fisher, AACO, WERS ITGILL00@aacounty.org rfisher@aacounty.org
Watershed Ecosystem & Restoration Services (WERS Mapping Application) User s Guide CONTACT Site Administrators: David Gillum, GISP, AACO, OIT Rick Fisher, AACO, WERS ITGILL00@aacounty.org rfisher@aacounty.org
User Guide for Windows 10
 User Guide for Windows 10 System requirements E10684 First Edition July 2015 To facilitate a smoother transition from your previous operating system, read the system requirements below before upgrading
Graphic Design Studio Guide
 Graphic Design Studio Guide This guide is distributed with software that includes an end-user agreement, this guide, as well as the software described in it, is furnished under license and may be used
Create and share a map with GIScloud.com
 Create and share a map with GIScloud.com GIS Cloud is a web based Geographic Information System powered by Cloud Computing and with the full power of desktop GIS. It allows users to create and access your
Reef Explorer User Guide
 Reef Explorer User Guide Contents USER INTERFACE...2 DATA CONTENT...3 BASEMAPS...4 ESRI BASEMAPS...4 National Geographic World Map...4 Light Gray Canvas Map...4 Ocean Basemap...4 World Terrain Base...4
Microsoft PowerPoint 2011
 Microsoft PowerPoint 2011 Starting PowerPoint... 2 Creating Slides in Your Presentation... 3 Beginning with the Title Slide... 3 Inserting a New Slide... 3 Adding an Image to a Slide... 4 Downloading Images
Advantage Cloud Access: Microsoft Remote Desktop for Android
 Advantage Cloud Access: Microsoft Remote Desktop for Android 2645 Townsgate Road, Suite 200 Westlake Village, CA 91361 Support: 800.888.8075 Fax: 805.497.4983 2013 Compulink Business Systems, Inc. All
This Skill Builder demonstrates how to define and place sketched symbols in drawings.
 Sketched Symbols This Skill Builder demonstrates how to define and place sketched symbols in drawings. A sketched symbol is a user-defined symbol. You create sketched symbols in the sketch environment
AutoDWG DWGSee DWG Viewer. DWGSee User Guide
 DWGSee User Guide DWGSee is comprehensive software for viewing, printing, marking and sharing DWG files. It is fast, powerful and easy-to-use for every expert and beginners. Starting DWGSee After you install
Introduction to SketchUp
 Introduction to SketchUp This guide is handy to read if you need some basic knowledge to get started using SketchUp. You will see how to download and install Sketchup, and learn how to use your mouse (and
Toolbars and Tabs in SMART Notebook Software
 Toolbars and Tabs in SMART Notebook Software This quick reference introduces you to the toolbar, full screen toolbar and side tabs in SMART Notebook collaborative learning software. Toolbar The SMART Notebook
Working With Animation: Introduction to Flash
 Working With Animation: Introduction to Flash With Adobe Flash, you can create artwork and animations that add motion and visual interest to your Web pages. Flash movies can be interactive users can click
Windows 8.1 User Guide
 Windows 8.1 User Guide This guide has been created to assist with lectures held in the ANU Information Commons. Further tips and training for using Windows 8.1 can be found on the IT Services website.
Guide to Viewing Maps in Google Earth
 Guide to Viewing Maps in Google Earth The BCT made the decision to provide the GIS (Geographic Information System) resources for Bat Groups in the form of Google Earth maps because they do not require
Florence School District #1
 Florence School District #1 Module 2: SMART Board Basics and Beyond 1 SMART Board Software and Beyond In SMART Notebook software, you can create or open SMART Notebook software (.notebook) files. After
Creating Hyperlinks & Buttons InDesign CS6
 Creating Hyperlinks & Buttons Adobe DPS, InDesign CS6 1 Creating Hyperlinks & Buttons InDesign CS6 Hyperlinks panel overview You can create hyperlinks so that when you export to Adobe PDF or SWF in InDesign,
DWGSee Professional User Guide
 DWGSee Professional User Guide DWGSee is comprehensive software for viewing, printing, marking and sharing DWG files. It is fast, powerful and easy-to-use for every expert and beginners. Starting DWGSee
Adobe Illustrator CS5 Part 1: Introduction to Illustrator
 CALIFORNIA STATE UNIVERSITY, LOS ANGELES INFORMATION TECHNOLOGY SERVICES Adobe Illustrator CS5 Part 1: Introduction to Illustrator Summer 2011, Version 1.0 Table of Contents Introduction...2 Downloading
Model 288B Charge Plate Graphing Software Operators Guide
 Monroe Electronics, Inc. Model 288B Charge Plate Graphing Software Operators Guide P/N 0340175 288BGraph (80207) Software V2.01 100 Housel Ave PO Box 535 Lyndonville NY 14098 1-800-821-6001 585-765-2254
Web GIS User Guide MainStreetGIS, LLC
 Web GIS User Guide MainStreetGIS, LLC www.mainstreetgis.com Navigation There are two ways to navigate the map interface: 1. Activate one of the map tools a. Zoom In Tool Activate the tool, then click on
ArcScan Tutorial. Copyright 1995-2010 Esri All rights reserved.
 Copyright 1995-2010 Esri All rights reserved. Table of Contents Exercise 1: Interactive vectorization........................... 3 Exercise 2: Automatic vectorization........................... 12 Copyright
Sharing Files and Whiteboards
 Your user role in a meeting determines your level of file sharing. The type of files you can share include documents, presentations, and videos. About Sharing Files, page 1 Changing Views in a File or
Ingham County Equalization/Tax Mapping Viewer Tutorial
 MAP LAYERS (RIGHT SIDE) All data layers listed here can be displayed on the map. To display a layer, make sure that the box is checked (by default parcel and city layers are displayed, uncheck to turn
WHAT S NEW IN WORD 2010 & HOW TO CUSTOMIZE IT
 WHAT S NEW IN WORD 2010 & HOW TO CUSTOMIZE IT The Ribbon... 2 Default Tabs... 2 Contextual Tabs... 2 Minimizing and Restoring the Ribbon... 3 Customizing the Ribbon... 3 A New Graphic Interface... 5 Live
Extracting Aerial Images From GIS Based Ortho Photos Using ArcMap 9
 Extracting Aerial Images From GIS Based Ortho Photos Using ArcMap 9 Tutorial Updated August 2006 CP-208 Plan Preparation Studio - Prof. Elizabeth Macdonald 2 In this tutorial we will learn to extract aerial
Basic AutoSketch Manual
 Basic AutoSketch Manual Instruction for students Skf-Manual.doc of 3 Contents BASIC AUTOSKETCH MANUAL... INSTRUCTION FOR STUDENTS... BASIC AUTOSKETCH INSTRUCTION... 3 SCREEN LAYOUT... 3 MENU BAR... 3 FILE
Microsoft Word 2010 Tutorial
 1 Microsoft Word 2010 Tutorial Microsoft Word 2010 is a word-processing program, designed to help you create professional-quality documents. With the finest documentformatting tools, Word helps you organize
Ofgem Carbon Savings Community Obligation (CSCO) Eligibility System
 Eligibility System") Ofgem Carbon Savings Community Obligation (CSCO) Eligibility System User Guide 2015 Page 1 Table of Contents Carbon Savings Community Obligation... 3 Carbon Savings Community Obligation (CSCO) System...
Ofgem Carbon Savings Community Obligation (CSCO) Eligibility System User Guide 2015 Page 1 Table of Contents Carbon Savings Community Obligation... 3 Carbon Savings Community Obligation (CSCO) System...
SDC. Schroff Development Corporation WWW.SDCACAD.COM PUBLICATIONS. MultiMedia CD by Jack Zecher
 MultiMedia CD by Jack Zecher An audioi/visual presentation of the tutorial exercises SDC PUBLICATIONS Schroff Development Corporation WWW.SDCACAD.COM AutoCAD 2002 Tutorial 2-1 Lesson 2 Geometric Construction
2012 Ward s Natural Science
 2012 Ward s Natural Science Contents Recommended System Requirements...3 Additional Assistance...3 QUICK START GUIDE Installation Instructions...4 How It Works...5 Your First View...6 Navigating the Library...7
Field and Farm Mapping Software
 GateKeeper Version 3.5 February 2015 Contents Introduction... 3 Part 1: Structure... 4 Field Map... 4 Farm Map... 4 Precision Farming Modules... 4 Precision Farming Actual... 4 Precision Farming Target...
Microsoft PowerPoint 2010
 Microsoft PowerPoint 2010 Starting PowerPoint... 2 PowerPoint Window Properties... 2 The Ribbon... 3 Default Tabs... 3 Contextual Tabs... 3 Minimizing and Restoring the Ribbon... 4 The Backstage View...
PDF MAPS FOR SMARTPHONES AND TABLETS
 INTRODUCTION Incident mapping often utilizes PDF documents of maps to be created for printing, archiving, and now for the ability to use these products in the field. With the release of Adobe Acrobat 9
Introduction to MyAvatar Learning how to use the tool
 Introduction to MyAvatar Learning how to use the tool Changes for Existing Users Taken from the Netsmart MyAvatar Training Guide v1.3 3/19/2012 Page 1 of 19 3/19/2012 What is myavatar Netsmart defines
JustClust User Manual
 JustClust User Manual Contents 1. Installing JustClust 2. Running JustClust 3. Basic Usage of JustClust 3.1. Creating a Network 3.2. Clustering a Network 3.3. Applying a Layout 3.4. Saving and Loading
TxDMV RTS Training Guide for Working with Cognos Reports
 TxDMV RTS Training Guide for Working with Cognos Reports April, 2015 About This Guide This Training Guide introduces the implementation of the Cognos enterprise reporting tool for the TxDMV Registration
CATIA Basic Concepts TABLE OF CONTENTS
 TABLE OF CONTENTS Introduction...1 Manual Format...2 Log on/off procedures for Windows...3 To log on...3 To logoff...7 Assembly Design Screen...8 Part Design Screen...9 Pull-down Menus...10 Start...10
Microsoft PowerPoint 2010 Handout
 Microsoft PowerPoint 2010 Handout PowerPoint is a presentation software program that is part of the Microsoft Office package. This program helps you to enhance your oral presentation and keep the audience
Sharing Presentations, Documents, and Whiteboards
 Chapter 19 19 Sharing Presentations, Documents, and Whiteboards Your user role in an event determines your level of sharing. Whichever role you take, the following table describes the basic tasks associated
ArcGIS Tutorial: Adding Attribute Data
 ArcGIS Tutorial: Adding Attribute Data Introduction A common need in GIS is to map characteristics, or attributes, of different geographic areas. These maps are called thematic maps. Examples of thematic
Instructions to view & create.kmz/.kml files from Google Earth
 Page 1 of 6 Instructions to view & create.kmz/.kml files from Google Earth Make sure you have Google Earth downloaded on your computer. If you don t, please visit this link to download Google Earth http://www.google.com/earth/download/ge.
Decreases the magnification of your chart. Changes the magnification of the displayed chart.
 OrgPlus Guide 1) Logging In 2) Icon Key 3) Views a. Org Chart b. Salary Org Chart c. Head Count/Span of Control 4) Viewing Profile/Explore/Bookmarks Panels a. Creating Bookmarks 5) Searching a. From the
Microsoft Publisher 2010 What s New!
 Microsoft Publisher 2010 What s New! INTRODUCTION Microsoft Publisher 2010 is a desktop publishing program used to create professional looking publications and communication materials for print. A new