MANUAL ON SEA LEVEL MEASUREMENT AND INTERPRETATION
|
|
|
- Marvin Robert Holmes
- 10 years ago
- Views:
Transcription
1 Intergovernmental Oceanographic Commission Manuals and Guides 14 MANUAL ON SEA LEVEL MEASUREMENT AND INTERPRETATION Volume I - Basic Procedures 1985 UNESCO

2 FOREWORD The IOC Assembly at its thirteenth Session by Resolution XIII-7 adopted the proposal for the Global Network of Sea-Level Stations prepared with the assistance of Dr. D. Pugh (U.K.) and Prof. K. Wyrtki, as a basis for an extension under the auspices of IOC of the existing sea-level network (included in the Annex to the Summary Report of the Thirteenth Session of the IOC Assembly). By this resolution Member States were urged to participate in the implementation of the Global Sea-Level Observing System which is required by the oceanographic community for research, in particular, in support of oceanographic experiments and programmes under the World Climate Research Programme, as well as for national practical applications. Similar to other international programmes, this project requires actions on both national and international levels. Preparation of the Manual on Sea-Level Measurement and Interpretation is considered as an important step towards unifying procedures for sea-level measurements and analysis and assisting those Member States who wish to install or reactivate their sealevel stations. This manual has been prepared by the staff of the United Kingdom Institute of Oceanographic Sciences associated with summer courses on sea-level observation and data reduction which have been held under the auspices of the Intergovernmental Oceanographic Commission. Although based on U.K. experience, this extends to analyses of records from many types of gauges and many coastal locations around the world. However, in other countries, slightly different procedures may be more appropriate. It is hoped that the material presented here will help countries which are planning national sea-level networks in response to recognised practical and scientific demands, in the spirit of the Resolution XIII-7 of the IOC Assembly of March 1985, which encouraged Member States to develop such networks. 2

3 CONTENTS Page 1. INTRODUCTION 1 2. SCIENCE OF SEA LEVEL CHANGES AND THEIR APPLICATIONS General Tides Meteorological Effects Extreme Levels for Design of Coastal Defences Tsunami Mean Sea Levels Long Term Trends Geological Evidence TIDE GAUGES Choosing a Tide Gauge Site The Float Operated Tide Gauge Installation Levelling and Datum Control Maintenance Other Types of Tide Gauges Remote Monitoring DATA REDUCTION The Nature of Tide Gauge Records Interpretation of Records Chart Labels and Zero Levels Mechanical Errors Weather Effects Extraction of Levels Statistics DATA EXCHANGE PROCEDURES General National Data Banks International Aspects The Permanent Service for Mean Sea Level Submission of Data to PSMSL APPENDICES Appendix 1. Summary of Essential Checks for Tide Gauge Operators. 62 Appendix 2. Suppliers of Tide Gauge Equipment. 63 Appendix 3. Application of X0 Filter for Computation of Mean Sea Level. 64 Appendix 4. Standard GF-3 Subset for Mean Sea Level (PSMSL) GLOSSARY 71 i

4 1. INTRODUCTION Measurement of sea level has a long history. Ancient people in many lands were able to link the regular movements of the sea to the movements of the moon and sun. Many also regarded tides as due to the powers of the Gods. Nineteenth century studies were related to vertical land movements in the belief that the average level of the sea was constant over long periods of time; changes of the mean sea level were related to land movement. It is now generally appreciated that neither the land nor the sea levels are permanent. There are vertical movements of the land associated with glacial changes and other tectonic processes. Changes in the mean sea level relate to changes in the volume of water in the oceans and to variations in the ocean currents. Modern studies of sea level are concerned with problems of marine transport, coastal erosion and the design of coastal defences against flooding. Scientifically tides and sea level changes have a controlling influence on many marine biological and geological processes. Changes of sea level over longer periods have important implications for coastal habitation and for climate changes. Recent proposals for co-ordinated studies of climate change have identified mean sea level as an important if indirect indicator of change and of the associated processes. These processes include glacial melting, expansion of sea water due to heating, and changes in sea surface gradients related to changes in currents through geostrophic balance. Changes in these currents in turn lead to changes in the poleward transfer of heat from the tropics. The IGCP- 200 programme on sea-level changes over recent geological times is another example of the various applications of studies of mean sea level changes. Global studies require a well distributed global network and proper international collaboration in defining observational standards, data collection, and publication. The Intergovernmental Oceanographic Commission has sponsored a series of courses at the Bidston Laboratory of the United Kingdom Institute of Oceanographic Sciences under the auspices of the Permanent Service for Mean Sea Level. This manual summarises the information presented at these courses. The emphasis is on techniques and on the practical aspects of site selection, maintenance, and critical data reduction. Additional material places these practical considerations in a scientific and engineering context. The courses and this manual have been developed by a team consisting of:- Bill Ainscow David Blackman John Kerridge David Pugh Sheila Shaw Lecturer, instruments Course co-ordinator Administration Chairman, Director PSMSL Lecturer, data reduction 1

5 Figure 2.1 Frequency distribution of hourly tidal levels at Newlyn ( ) showing that neap high and low water levels are the most probable. The influence of the weather spreads the observed distribution to higher and lower levels. 2

6 2. SCIENCE OF SEA LEVEL CHANGES AND THEIR APPLICATIONS 2.1 GENERAL The basis for any scientific analysis of sea level must be long series of careful measurements. Any instantaneous measurement of sea level in a series may be considered the sum of three component parts:- observed level mean sea level + tide + meteorological residuals Each of these component parts is controlled by separate physical processes and the variations of each part are essentially independent of the variations in the other parts. There are many ways of defining these components. An acceptable set of definitions is:- Tides are the periodic movements of the seas which have a coherent amplitude and phase relationship to some periodic geophysical force. The dominant forcing is the variation in the gravitational field on the surface of the earth due to the regular movements of the earth-moon and earth-sun systems. These cause gravitational tides. There are also weak tides generated by periodic variations of atmospheric pressure and on-shore off-shore winds which are called meteorological tides. Meteorological residuals are the non-tidal components which remain after removing the tides by analysis. They are irregular, as are the variations in the weather. Sometimes the term surge residual is used but more commonly surge is used to describe a particular event during which a very large non-tidal component is generated. Mean sea level is the average level of the sea, usually based on hourly values taken over a period of at least a year. For geodetic purposes the mean level may be taken over several years. The frequency with which different observed hourly levels occur over a long period of observation has a definite pattern. Where semidiurnal tides are dominant, the most frequent levels are near to Mean High and Mean Low Water Neap levels (see Figure 2.1). More elaborate techniques of analysis allow the energy in the sea level variations to be split into a series of frequency or spectral components. The main concentration of energy is in the semidiurnal and diurnal tidal bands, but there is a continual background of meteorological energy which becomes more important for longer periods or lower frequencies. 3

7 Figure 2.2 Tidal characteristics at five stations, showing different regimes: diurnal, mixed, semi-diurnal with strong spring-neap modulation in the Indian Ocean, semidiurnal with weather modulation in the N. Atlantic Ocean, and gross shallow water distortions. 4

8 2.2 TIDES Newton s theory of gravitational attraction predicts two symmetrical tidal bulges directly under and directly opposite the moon or sun. Tidal ranges would reach their maximum value of about 0.5 metres at equatorial latitude. The individual high water bulge would move around the earth from east to west in steady progression as the earth rotates under the moon or sun. These characteristics are clearly not those of the observed tides. The observed tides in the main oceans have ranges of about 1.0 metres, but there are several variations as shown in Figure 2.2. In some local areas of the continental shelves, ranges may exceed 10 metres. An extreme example is found in the Bay of Fundy, where ranges of 15 metres may sometimes occur. In most places the tides are dominated by semidiurnal patterns, but there are places where diurnal tides dominate. Elsewhere, there are mixed tidal regimes where the pattern may vary between semidiurnal and diurnal in its characteristics. In very local situations, where the water is shallow, extreme distortions of the tidal profiles occur. Tides propagate as long waves on a rotating earth. Their behaviour may be represented by co-amplitude and co-tidal maps. Reflection of progressive waves leads to standing waves, which on a rotating earth become amphidromic systems. Amphidromic systems are locations where there is zero tidal amplitude and around which the tidal waves progess in a clockwise sense in the southern hemisphere and an anti-clockwise sense in the northern hemisphere. Where the natural dimensions of a basin are close to a quarter wave-length of the progressive tidal wave, resonance occurs and the resulting amplitudes at the head of the basin may become very large. Tides spread from the oceans onto the shallower continental shelves where their speed of propagation is much slower. Energy is lost to overcome bottom friction resistance to the strong tidal currents. The ultimate distortion of the harmonic tidal wave occurs in estuaries and rivers where the depth is too shallow for the wave to propagate effectively. As a result, tidal bores are generated which are often spectacular and can do great damage. 2.3 METEOROLOGICAL EFFECTS Even the most carefully prepared tidal predictions differ from the sea levels actually observed because of the effects of the weather. The relative importance of the tidal and non-tidal movements depends on the time of year, the latitude, and the proximity of extensive shallow water areas. Typical standard deviations of observed levels from predicted tidal levels vary from 0.03 metres at tropical ocean islands to 0.25 metres or more in stormy high latitudes, where the continental shelves are shallow. Patterns of geological coastline development and sediment deposition often operate to produce flat low-lying fertile land adjacent to extensive shallow seas. The northern bay of Bengal is an outstanding example. People tend to settle on this low-lying land. If storm surges combine with high tides to produce severe flooding the most immediate danger is of drowning. However, the subsequent dislocation of normal services such as water supplies and sewerage gives rise to further dangers. Also, once flooded by sea water, previously fertile lands are unsuitable for growing crops for several years because of the saline deposit which remains after the floods have receded. 5

9 Physically the atmosphere acts on the sea in two distinctly different ways. Changes in atmospheric pressure produce changes in the pressures acting vertically on the sea surface. One millibar increase of atmospheric pressure decreases sea level by one centimetre. This is called the inverted barometer effect. The drag of the wind on the sea surface increases as the square of the wind speed, to a first approximation. This drag sets the water in motion in shallow water the flow is in the direction of the wind but in deeper water the transport is at right angles (to the right in the northern hemisphere). When the water transport is impeded by land boundaries there is an increase of water levels, the storm surge. For scientific analysis and for systems designed to predict imminent surges, it is usual to distinguish between tropical and extra-tropical surges. Tropical Surges These are generated by tropical storms which are small and very intense. These storms are generated at sea, from where they move in an irregular way until they meet the coast. Here they produce exceptionally large flood levels within the region of perhaps km. Tropical storms are difficult to monitor off-shore and their effects on a particular piece of coastline cannot be estimated from the statistics of observed floods because they are so rare. A combination of numerical and simple statistical models may be used to estimate the maximum flood levels, but their exact location depends on the track of each individual storm. Extra-Tropical Surges These are generated by storms which extend over several hundred kilometres and which are generally slow moving. They affect large areas of coast over periods which may extend to several days. At their centre is a region of low atmospheric pressure. The effects of the earth s rotation must be taken into account when making numerical predictions of the storm s behaviour and the resulting potential for flooding. 2.4 EXTREME LEVELS FOR DESIGN OF COASTAL DEFENCES The maximum extreme high water levels due to combinations of very high tides and very large surges which may be expected in some defined period such as 50 or 100 years is a necessary input to the design of coastal defence systems. The simplest approach is to compute the ratio between some normal tidal parameter and the level having a return period of N years. The factor may be determined for a standard port in the region and used for scaling non-tidal parameters at other sites where the long series of data are not available for independent analysis. Another method makes use of the highest levels observed in each of a number of years and ranks them in a statistical way to estimate by extrapolation maximum levels which may occur. Usually at least 25 years of maximum annual levels are needed for this kind of analysis. The most direct approach to estimating the probability of extreme levels uses the separate probabilities of tides and of surges and combines them statistically to calculate the probabilities of total levels. Where flooding results from extra-tropical surges, these techniques of data analysis are valid, but where the most serious flooding is likely to be due to tropical surges, then there will be insufficient data available to allow a proper statistical treatment of extreme events at any particular location. In this case it is usual to rely on 6
.")
10 numerical models or simple empirical models which relate maximum levels to varying storm track speeds, directions, and shelf width. 2.5 TSUNAMI A Tsunami is a wave generated by seismic activity and as such falls outside the two categories of forces responsible for normal sea level changes, tides and the weather. Not all submarine earthquakes produce tsunami. The important element is a vertical crustal movement which displaces the sea bed. The tsunami wave characteristics will depend on the amplitude of the displacement and the dimensions of the sea bed involved. Horizontal displacements of the seabed will be relatively ineffective. The waves travel at a speed given by (water depth * gravitational acceleration) ½. Amplitudes in deep water are small, probably not more than 1 metre. The Pacific Ocean and its coastlines are the most vulnerable to tsunami because of the seismically active surrounding plate boundaries. As the wave approaches shallow coastal waters its amplitude increases and there are multiple reflections and refractions which combine to give very large local amplitudes. A network of reporting tide gauges in the Pacific enables warnings of tsunami arrival to be given some hours in advance. 2.6 MEAN SEA LEVELS Mean sea level is calculated from long series of hourly (or sometimes three-hourly) observations. The simplest way is to take the arithmetic average, but more elaborate methods include the application of low-pass numerical filters to eliminate tides and surges before taking the average. The average of all high and low water levels is called the mean tide level; it is close to but not identical with mean sea level. Monthly and annual mean sea level series for a global network of stations are collected and published by the Permanent Service for Mean Sea Level, together with details of gauge location, and definitions of the datums to which the measurements are referred. Data is held for over one thousand stations: of these stations one hundred and twelve have recorded data from before The longest record held is from Brest, France, which begins in The physical location of gauges on the network is not ideal: the vast majority of gauges operate in the northern hemisphere and careful analysis is necessary to avoid bias in the interpretation. There is a continuing need for more data from the southern hemisphere, and from ocean islands. The change of mean sea level relative to a fixed point on land is a measure of the difference between the vertical movements of the sea s surface and of the land itself. Long-term changes of measured sea level are called secular changes. Global changes in the mean sea level are called eustatic changes. Vertical land movements of regional extent are called eperiogenic movements. Figure 2.3 shows variations in the monthly sea level over a ten year period at five well established stations. 7

11 Figure 2.3 The variations at Newlyn and Brest which are separated by only 200 kilometres are very similar. For Honolulu and San Francisco which are separated by half the width of the Pacific Ocean, there are many similarities but also many differences. The close agreement between variations at Newlyn and at Brest which are measured quite independently using different kinds of instruments shows that the oceanographic variability which we seek to describe and understand is much greater than the errors in the measurements. There are pronounced annual and semi-annual variations of mean sea level due to seasonal changes in atmospheric pressure, water density and ocean circulation. In summer months water density variations are likely to dominate and in winter months meteorological. 2.7 LONG-TERM TRENDS Figure 2.4 shows the long-term trends in sea level at several stations and the trends are summarised in Table 2.1. There is a general increase of mean sea levels of about m per century over the period of detailed measurements. However, there are considerable variations from this average figure. During periods of glaciation the sea levels fall because water is locked into the polar ice caps; as the glaciers recede the global sea level increases, but this general increase in level may not be apparent along coasts which have only recently been relieved of their ice burden. Along these coasts there is an isostatic land uplift which is measured as a decrease in local 8

12 Figure 2.4 Low level frequency changes of sea level at eight stations showing a general upward trend, except at Sitka, and significant interannual variations. Complete Series 1940 Onward Latitude Total Years Period SITKA (Alaska) N (0.4) -2.6 (0.3) NEWLYN N (0.2) 1.5 (0.4) BREST N (0.1) 0.0 (0.5) HALIFAX (Nova Scotia) N (0.1) 3.2 (0.3) SAN FRANCISCO N (1.5) 1.5 (0.4) HONOLULU N (0.2) 0.8 (0.4) BOMBAY N (0.1) -1.0 (0.4) SYDNEY (New South Wales) S (0.1) 2.0 (0.3) TABLE 2.1 Fits of linear trends to long series of annual mean sea levels; the estimated rates of sea level rise are given in cm per year and the standard errors of the estimates are given in brackets. 9
 BOMBAY 18 55 N 101 1878-1978 1.0 (0.1) -1.0 (0.4) SYDNEY (New South Wales) 33 51 S 85 1897-1981 0.7 (0.1) 2.0 (0.3) TABLE 2.")
13 sea level (see Sitka, Alaska, in Figure 2.4). Superimposed on the long-term trends are variations of several centimetres of amplitude, which have coherence over ocean but not global distances, and periods of several years. These inter-annual variations are not well understood, but they are related to changes in heat storage, circulation and heat transport. Studies of climate stability and climate change will be advanced by a better understanding of these sea level changes. In the absence of density variations and ocean circulation, the sea surface would assume a shape known as the geoid. However, there are density variations and currents which cause the actual mean sea level to vary from the geoid by up to a metre. Gradients in the mean sea level surface across ocean currents are necessary to balance Coriolis forces on a rotating earth. Changes in the strength of the currents will cause changes in the gradients, and hence in the mean sea level surface. The difference in mean sea level between two island gauges may therefore be an indication of the strength of the current passing between them. 2.8 GEOLOGICAL EVIDENCE Over geological periods there have been considerable vertical movements of the land relative to the sea extending over several thousands of metres. Evidence for lower sea levels than at present consists of submerged shore lines, deltas, and the extension of river valley systems well out across the continental shelf, sometimes as far as submarine canyons at a shelf break. Submerged forests, peat beds and shelves which contain organic material may be dated to investigate these changes. Evidence for relative upward land movement is seen in raised beaches, tidal flats and salt marshes as well as in wave-cut terraces and elevated sea cave systems in cliffs. Where tidal ranges are small, such as in the Mediterranean Sea, relative changes of sea level can be monitored by archaeological surveys of ancient harbours. In some cases changes in sea level are very sudden, as a result of local earthquakes. In other cases, such as the isostatic recovery from glacial loading, the changes are gradual. The combination of sea level changes measured by different techniques shows a relatively rapid rise of sea level from 20,000 years ago, gradually slowing down 8,000 years ago when levels were some 15 metres below those of today. The increase then proceeded more gradually until present levels were reached some 4,000 years ago. Since that time the changes have consisted of oscillations of small amplitude. The last ice age was only the latest in a succession of advances and retreats which have repeated throughout the past two million years. Throughout this Quaternary period, seventeen glacial-interglacial cycles have been identified. However, in the total geological record these periods of large glacial oscillations are unusual and can only be seen on four other occasions in the past 900 million years. 10

14 REFERENCES BARNETT, T.P. 1983: Recent changes in sea level and their possible causes. Climatic change, 5, DOODSON, A.T. & WARBURG, H : Admiralty manual of tides. London : HMSO. 270pp. GORNITZ, V., LEBEDEFF, S. & HANSEN, J : Global sea level trend in the past century. Science, 215, KASAHARA, K : Earthquake mechanics. Cambridge University Press. 284pp. LISITZIN, E : Sea level changes. Amsterdam : Elsevier. 286pp. MURTY, T.S : Seismic sea waves tsunamis. Bulletin of Fisheries Research Board of Canada, No 198, 337pp. MURTY, T.S : Storm surges meteorological ocean tides. Canadian Bulletin of Fisheries & Aquatic Sciences, No 212, 897pp. PATTULLO, J.G., MUNK, W.H., REVELLE, R. & STRONG, E : The seasonal oscillation in sea level. Journal of Marine Research, 1, PUGH, D.T. & FAULL, H.E : Tides surges and mean sea level trends. pp in Shoreline protection. (proceedings of a conference organised by the Institution of Civil Engineers, Southampton, 1982). London : Thomas Telford. 248pp. ROSSITER, J.R : An analysis of annual sea level variations in European waters. Geophysical Journal of the Royal Astronomical Society, 12, THOMPSON, K.R : An analysis of British monthly mean sea level. Geophysical Journal of the Royal Astronomical Society, 63, WUNSCH, C : The long-period tides. Reviews of Geophysics, 5, WYRTKI, K : Sea level variations : monitoring the breath of the Pacific. EOS, Transactions of the American Geophysical Union, 60,

15 3. TIDE GAUGES 3.1 CHOOSING A TIDE GAUGE SITE Before any attempt is made to choose a site for a tide gauge installation the following information should be considered:- 1) The type of tide gauge to be operated gauges, the size of structure necessary. 2) The area for which the tidal information is required and the use to which this information is to be put. Within the limits of the coast dictated by the above requirements, the site will then be chosen. In some instances the choice of site is quite clear, since the requirement is to monitor tidal levels at a specific point, such as a sewage outflow point, or a lock gate. In most instances however, the choice of site will not be so clear and can only be made by judging which of the following constraints are more significant and which can be more or less ignored. a) The installation when completed must be capable of withstanding the worst storm conditions likely to be encountered. Therefore, positions known to be subject to storm damage because of their exposure should, if possible, be avoided. If this is not possible, then this situation must be borne in mind when designing the installation. Where large waves or tsunami are possible, raising the level of the building may be necessary to prevent swamping or destruction. b) The ground on which the installation is to be built must be stable, not being liable to subsidence because of underground workings, or because it is recently made up of land (example: reclaimed by tipping). It must also not be liable to slippage in the event of heavy prolonged rain storms (i.e. must be adequately drained) or being eroded by river or sea action. Building direct on to solid rock is the ideal. c) The water depth must extend at least two metres beneath the lowest astronomical tide for successful operation of a stilling well. The outlet of the stilling well should be clear of the sea bed and be set deep enough to allow the float to operate about one metre below Lowest Astronomical Tide (LAT). d) River estuaries should, if possible, be avoided. Water flowing down the river mixes with sea water resulting in varying water density in the area and because of layering water drawn into the stilling well may be of different density than the surrounding water. Currents due to the river flow can cause draw-down in the stilling well and following heavy rainstorms debris floating down the river can become entangled with the stilling well causing blockage or may even cause impact damage. e) Areas where impounding (becoming cut-off from the sea) can occur at extreme low levels should be avoided. Similarly, sandbars slightly below the surface between the site and the open sea can result in uncharacteristic levels being measured. Monitoring across long shallow sloping beaches should also be avoided for the same reasons. f) Sharp headlands and sounds should be avoided since these are places where high currents occur. 12

16 Figure
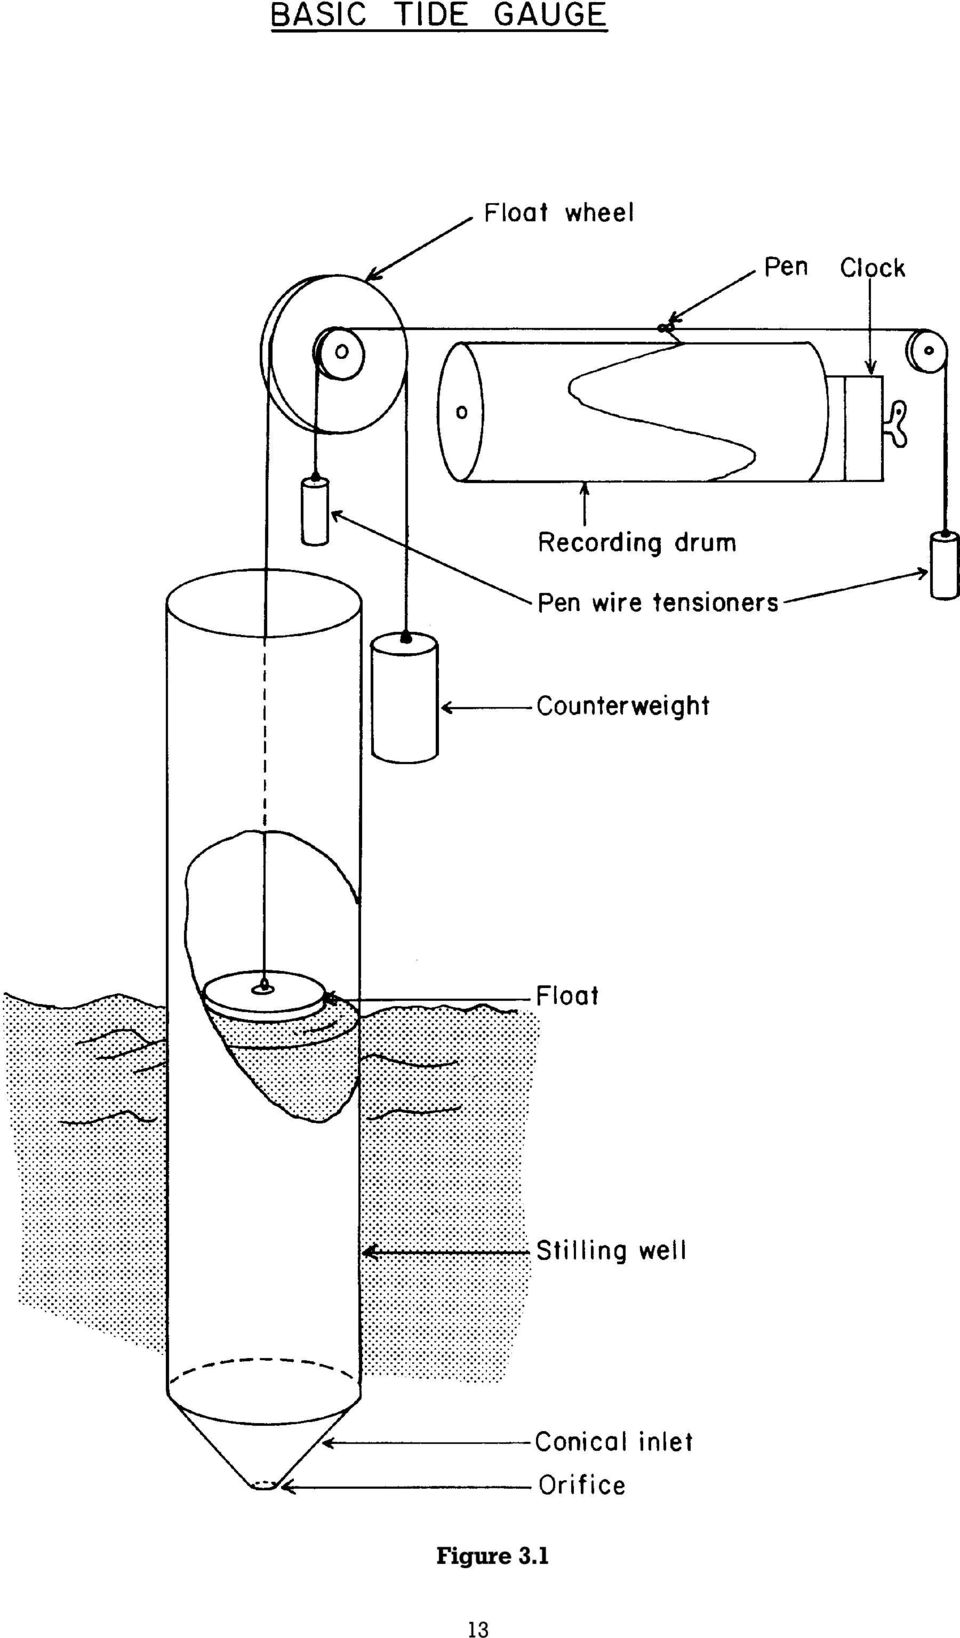
17 g) Proximity to outfalls can result in turbulence, currents, dilution and deposits, and should be avoided. h) A study should be made of shipping passing or mooring close to the proposed site, since there will be a risk of collision and propeller turbulence causing silt movement. i) Investigations should be made to determine if there is a possibility of construction work occurring in the area at some future time, which may affect the tidal regime at the site e.g. construction of new quays, breakwaters, locks or large factories having sluices or outfalls. j) Where an appreciable amount of continuous power is required it will be necessary to lay in a mains electrical supply to the site. If this is not possible an alternative supply may be obtained from storage batteries and a generator. If power is required only for recording or telemetry purposes then batteries may suffice. k) There must be adequate access to the site in the first instance to get materials on site during construction, and later for observation and maintenance visits. 3.2 THE FLOAT OPERATED TIDE GAUGE (i) The Basic Tide Gauge In its simplest form the installation for a float operated tide gauge could appear as shown in Figure 3.1. The float which sits on the surface of the water is connected by a cable passing over a pulley to a weight so that the position of the weight is determined by that of the float. As the float rises on rising water so the weight descends by the same amount and the cable passing over the pulley causes the pulley to rotate, the angle of rotation being directly proportional to the change in water level. The second pulley fastened to the same shaft will rotate through the same angle as the first pulley, but since its diameter is smaller the pen attached to the cord passing over this pulley will move through a smaller distance than the float although in exactly the same manner. The pen can be arranged to write on a chart and depict the movement of the float and hence the water surface although on a reduced scale. The ratio of the gauge is the relation between the pen movement and the actual water movement determined in this example by the relevant diameters of the two pulleys. If the recording paper is arranged to pass normal to the path of the pen at a fixed speed a curve will be drawn to give a continuous record of water height against time. The float is arranged to operate inside a stilling well which is necessary for satisfactory functioning. The well forms an enclosure to prevent the float from drifting in the presence of winds. By restricting the flow of water into and out of the well some damping of the water movement is achieved and eliminates the oscillations due to short period waves. (ii) The Practical Tide Gauge All analogue float operated tide gauges are based on the simple instrument already described. The designs of practical tide gauges differ from the basic model only by having features incorporated to improve accuracy and reliability. 14
 Where an appreciable amount of continuous power is required it will be necessary to lay in a mains electrical supply to the site.")
18 (iii) Float System A cable between the float and counterweight passing over a pulley is not normally employed since the cable is prone to slip on the pulley and at best can transmit little torque without slip occurring. The float wire is usually wound onto a drum having a spiral groove to locate the wire as it winds on and prevent overriding turns. The counterweight likewise is suspended from a similar drum. It is not normally convenient to have the counterweight operate through the same distance as the float since it will spend some time in water with consequent corrosion problems and reduced effect due to buoyancy. The weight is usually suspended from a much smaller diameter drum and hence travels through a much shorter distance than the float. The travel can be further reduced by passing the wire through a pulley or series of pulleys. As the range of the counterweight is less than that of the float so the mass of the counterweight must be increased in the same ratio to keep the system in balance. In several tide gauges the direct float counterweight link is employed: in these instances, either a perforated tape is used which registers with a sprocketed pulley, or a special pulley around which the wire is wrapped a number of turns. Modern floats are made from materials such as nylon or PVC which are little affected by the corrosive influence of seawater. Natural antifouling materials such as copper are also used. To be reliable a float must not leak and therefore should not be constructed from materials which are liable to corrode or split. The anti-fouling property is important since many forms of marine life seem to have a great affinity for items floating on the sea surface. The result is that the float grows as the marine life accumulates and gradually closes the gap between the float and walls of the well causing a sluggish response of the float. The float itself must not be allowed to come in contact with the wall of the well as this may cause the float to stick, particularly at joints in the well, and eventually wear away the float and cause leakage. Float and counterweight wires should be selected from corrosion resistant and non stretching materials. Stainless steel and phosphor bronze wires are the most common. It is important that the correct gauge of wire is used on any particular tide gauge since a change in diameter of the wire will affect the ratio of the tide gauge. Counterweights can be made from any heavy material such as cast iron, steel, brass or lead. The mass of the counterweight is important since it must be sufficient to overcome any friction in the gauge mechanism but not be so excessive that it reduces the float effect so that it is insufficient to overcome friction in the opposite direction. (iv) Gearing The drive from the float pulley shaft to the pen mechanism can take a variety of forms; all of these are designed with the primary aim of minimising backlash. In some gauges this is achieved by loading the gear train in one direction, in some by use of sprung anti-backlash gears, and in others by precision manufacture of all parts. (v) Pens A great variety of pens and pencils have been used in tide gauges to produce a trace on the chart, some not very successfully. The pen is required to write very slowly on the chart, and to do this successfully must neither dry up nor flood. Most gauges now-a-days use either fibre tip pens or capillary pens with disposable ink capsules. Each type lasts on average about two 15

19 months before requiring changing. The advantage of the fibre tip pen is that it is completely disposable and does not require any form of maintenance whereas a capillary pen requires frequent cleaning by soaking in methylated spirit. (vi) Recording Charts The recording chart can be mounted either on a rotating drum or take the form of a continuous roll or strip chart. The drum mounted chart is rectangular in shape when unrolled, marked with a graticule indicating height in one direction and time in the other. Drums are usually arranged to rotate one revolution every twenty four hours and so the chart is marked in hours from nought to twenty four. When fitting the chart to the drum it is important to obtain correct alignment of the graticule so that the zero time line and the twenty four hours line are coincident and there is no step in height readings at the join. A strip chart is in the form of a continuous roll of paper which winds from one spool to another at a constant speed. The paper is marked in heights across its width and time along its length. Recording drums and strip charts are driven at a constant speed by a clock mechanism. Hand wound eight day mechanical clocks are the most common though some tide gauges use electrically wound clocks and mains driven synchronous clocks. (vii) Punched Tape Recorders Some float operated tide gauges do not record on an analogue chart but record spot heights at fixed intervals of time on a roll of recording paper in the form of a series of punched holes. A compatible tape reader is required to translate data from these types of gauges INSTALLATION (i) Stilling Wells A stilling well is a tube placed vertically in the water, long enough to adequately cover any possible range of tides at the particular site. The bottom of the well is closed off except for a small entry for the water to flow in and out, the top is left open. There are two basic types of stilling well, one with a small orifice at the bottom and the other with a pipe inlet connected to the lower part of the well. Both designs do basically the same thing, that is damp out the higher frequency disturbances such as waves and ship wash but leave longer period variations such as tides and seiches unaffected. The main difference is that the pipe inlet well does it better and can be tuned to the designer s requirements. (ii) Orifice Inlet Orifices in wells vary in design and some are shown in Figure 3.2. The cone inlet is the most common since it has the advantage of being self draining with regard to silt and hence needs less frequent cleaning. A variation on this design is the cone inlet with removable orifice plug allowing simple cleaning of the inlet to remove silt and marine growth and also experimentation with the size of orifice. 16

20 Figure

21 Figure 3.3 shows the damping characteristic of the stilling well over a range of frequencies from seconds to twenty four hours. The degree of damping achieved with an orifice inlet is dependent on the amplitude of the disturbance, larger disturbances being more significantly reduced. The frequency at which the attenuation becomes insignificant is dependent on the size of the orifice whose recommended diameter should be one tenth that of the stilling well. However, at some sites it maybe found that a smaller orifice is desirable to reduce unwanted disturbances. The optimum can only be achieved by experimentation in obtaining the maximum reduction of the unwanted wave oscillations without significantly affecting the response of the well at tidal frequencies. Figure 3.3 (iii) Pipe Inlet Figure 3.3 also shows the attenuation produced in a stilling well having a pipe inlet. It will be noted that there is a critical frequency above which outside disturbances are virtually eliminated and below which, there is little if any attenuation. Using a combination of pipe lengths and diameters the critical frequency can be placed wherever desired. However, the theory from which this relationship is derived assumes laminar flow conditions, and these can only be achieved by use of relatively large diameter pipes necessitating them being quite long. Pipe inlet systems are seldom used, unless they are necessary in order to achieve a sufficient depth of water, since they are expensive to construct, prone to siltation problems and are difficult to clean. 18
22 (iv) Construction Stilling wells can be constructed from a number of materials the choice being dependent on what is locally obtainable and the most severe conditions likely to be experienced at the proposed site. Materials commonly used are grp (glass reinforced plastic), PVC or steel with a bitumen coating. The structure to which the stilling well is to be attached will be decisive in the design of the mountings. In the case of open piled piers it may be possible to mount the stilling well within the structure, fastened to the structure by simple clamps. In most instances it is necessary to build over the side of a quay, the stilling well being supported at a number of points in saddles built out from the quay wall. It is advisable to use stainless steel or phosphor bronze nuts and bolts to attach the lower section of the stilling well to allow ease of removal at such time when this is needed for maintenance or cleaning. (v) Errors in Stilling Wells Errors in measurements in stilling wells can be caused by a number of factors. Silt and marine growth in the area of the orifice has already been mentioned. These will cause the orifice to become effectively smaller and eventually block it completely. The orifice can also be blocked by a build-up of silt or sand outside the well as a result of natural currents or storms or ship s propellers. It is therefore important that a site is chosen where there is adequate depth of water beneath the inlet to prevent this occurring. This problem can be very difficult to combat in the case of pipe inlets. Errors can be caused by the water in the well not being of the same density as that outside the well. When stratification occurs, and this is most serious around river estuaries, the upper layers of the water will have a lower density than the lower layers. Since the well inlet is deep down in the water only the denser portions will be drawn in on the rising tide, the water in the well being more dense will have a lower surface level. Conversely, should lower density water be drawn into the stilling well at low water levels this will be retained within the well and hence the opposite effect can take place where the water in the stilling well is of lower density than that outside. In the presence of currents the water flowing past an orifice inlet will cause a local reduction in pressure around the region of the orifice and reduce the level of the water inside the stilling well. This effect is known as draw down and becomes noticeable when currents exceed about one and a quarter knots. (vi) Accommodation This refers to the housing used for the tide gauge installation. It is always recommended that the tide gauge instrument be housed in a building or hut to protect the equipment against extremes of weather conditions and to provide a low humidity environment where the affects of dampness, salt spray and extremes of temperature are minimised. In the UK, because of the generally cold and damp climate, buildings are kept heated to a constant temperature with sufficient ventilation to allow moisture in the atmosphere to disperse. When adequate moisture protection is not possible then the tide gauge case should be fitted with moisture absorbing material, such as silica gel, to keep the mechanism and the chart dry. It is important that the building should be capable of withstanding the worst storm conditions likely to be encountered since at this time tidal records are most important. If this is not possible, then the site is badly chosen and it should be moved to a point where there is more protection from severe storms. 19
23 The building should be provided with adequate lighting for all the tasks to be undertaken. At least one window providing natural light is also advisable to allow safety of movement in the event of failure of the normal lighting system. A float operated tide gauge should be positioned directly over the stilling well so that the float system can be direct operating and friction free. Where this is not possible then a system of guide pulleys is necessary to direct the float wire to the gauge. In all cases the tide gauge should be mounted on a substantial bench firmly anchored to the floor, and stiff enough not to move when leant against. The stilling well top should be covered for the following reasons: 1) Safety, to prevent persons from falling into the open aperture, as it is virtually impossible to rescue a person who has fallen down a stilling well. 2) To prevent loose items from dropping into the well such as books, pens, clothing. 3) To prevent the rise of damp air into the building. When a bench is positioned over the well the most convenient method is to fit a panel to the front of the bench to close off the area. There should be sufficient space on the bench for handling the gauge charts during routine maintenance. (vii) Visual Tide Staff (VTS) It is essential at any tide gauge site to have a VTS (or tide pole), as this is the sole means by which a direct reading of water level can be made by observations. This enables a quick check on the level indicated by the tide gauge. The VTS is normally erected in the form of a ruler edged staff placed vertically on a rigid attachment with a range at least equal to the greatest expected tidal range. The design in use on the A class network in the UK is shown in Figure 3.4. The colours used on the staff are black and yellow to give good contrast for ease of reading. The material used for the VTS must be non-warping and free from serious corrosion. It must also be easy to clean. The design shown in Figure 3.4 meets these requirements in being constructed of grp (glass reinforced plastic), with the markings printed into the resin with no raised portions. The VTS should be sited as close to the tide gauge as is practicable, and be positioned so that it is easy to read and preferably to be visible from the tide gauge house. It should not be sited where it is likely to be struck or scraped by passing ships or boats, or obscured when boats are tied up in the harbour. It is important that the VTS be vertical. If this is not possible, for instance when fixed to a sloping harbour wall where a vertical structure may not be built, then the graduations must be adjusted to give correct scaling at the angle of the slope. A VTS may be difficult to read under certain conditions and therefore the readings noted should be accompanied by the possible error band at the time of reading. In the presence of waves the tendency is to take the mean of the highest and lowest readings and this can lead to an error since all waves are not symmetrical in shape. The tendency is to give a higher reading than the true mean. The VTS being a solid object will cause an obstruction in flowing water and result in some disturbance to the surface level, the level tending to be raised on the upstream side and depressed downstream. When viewed from an acute angle it is easy to misread the level indicated on the staff particularly in bright sunlight and when the water is clear. A sighting line about twenty degrees to the water surface is the optimum. 20
24 Figure LEVELLING AND DATUM CONTROL (i) Bench Mark In everyday matters we subconsciously use datums, for example, when we say a tree is thirty feet high, we naturally assume the ground surface to be the datum from which we are measuring this height. However, when we come to consider the height of a large building on sloping ground we need more information to determine this, since our datum can no longer be the ground as it is not level. In this instance we need a clearly defined point for our datum reference. In the same way tidal observations must be referred to some fixed datum to be of full use. 21
25 For tidal observations a bench mark is used as the primary reference point. A bench mark is a clearly marked point located on a stable surface such as exposed rock, a quay wall or a substantial building. When a bench mark is on a horizontal surface it normally takes the form of a round headed brass bolt, the highest point of the domed head being the reference level. When on a vertical surface it can be in the form of a horizontal groove in the surface or on a metal frame attached to the surface, having a horizontal reference edge to which a measuring staff support can be fixed. It is not good practice to depend upon the stability of a single benchmark but to have a number, minimum three, within a mile which should always keep the same elevation relative to each other. If no changes are observed over long periods it is safe to assume that all are stable. However, it is essential that these bench marks are tied into the national levelling network, and periodically checked. The bench marks will then be given elevations referring to the datum of the national network. It is important that the bench marks as well as being stable be clearly identified both in themselves and with a map grid reference. (ii) Tide Gauge Datum The datum of a tide gauge is the ground plane level at which the tide gauge reads zero. The ground plane used will depend upon the requirements of the user. It is normal in the UK to use Admiralty Chart Datum as the datum for tidal recording instruments, although some harbour authorities use their own datums. The datum usually chosen in these cases is the sill of a lock or a shallow point in the harbour, so that the level indicated by the tide gauge shows the depth of water above these hazards. (iii) Admiralty Chart Datum Admiralty Chart Datum or Chart Datum is the low water plane below which the depths on a nautical chart are measured and above which tidal levels are measured. Chart Datum is a horizontal plane over a limited area and the elevation of this plane will vary around the coastline dependent on the tidal ranges at the places considered. (iv) Ordnance Datum Ordnance datum is an imaginary datum plane extending over a large area (in the case of UK over the whole of Great Britain). The elevation of this plane is derived from observations of mean sea level at a reference point over a long period, and thus ordnance datum is usually the same or very nearly the same as mean sea level. Once defined ordnance datum remains fixed. For any point on the coast a fixed difference exists between Chart Datum and Ordnance Datum. In tide tables the relations between Ordnance Datum and Chart Datum are shown for a number of places around the coast and these values normally remain unchanged and are roughly equal to half of the maximum expected tidal range. (v) Setting Tide Gauge Datum We will first consider the simplest type of tide gauge, the visual tide staff. When set correctly the VTS will be vertical i.e. normal to the horizontal plane in all directions and its zero will just 22
26 Figure
27 Figure
28 touch the imaginary datum plane. For practical considerations it is much simpler for us to consider the top of the VTS and if, for example, this is graduated from zero to plus six metres then we must ensure that the top of the staff is set six metres above the datum plane. This is achieved in practice by transferring the level from a local benchmark of known elevation to the VTS position (see Figure 3.5). Using this method of levelling it is possible to establish the elevation of any surface relative to the chosen datum. In the case of float operated tide gauges it is necessary to accurately determine the level of the water in the stilling well referred to the datum and then set the gauge to this reading. A contact mark is established close to the top edge of the stilling well and a manual probe, set to zero on the contact mark, is lowered down the well, until the probe tip is touching the water surface. Therefore, knowing the elevation of the contact mark and subtracting the distance from this mark to the water surface as indicated by the manual probe we obtain the value the tide gauge should be indicating. Once the tide gauge is correctly set further readings of the gauge taken at the same time as those on the manual probe should add up to a constant value, that is the elevation of the contact mark above the datum (see Figure 3.6). (vi) Levelling If the bench mark is a considerable distance from the VTS then levelling between the two points will need to be done in a number of stages. To carry out this procedure it is necessary to determine the staging points to be used and clearly mark these positioned about 50 metres apart on a hard surface. This can be done by painting a small ring around the point and on softer surfaces by driving in a round headed pin (see Figure 3.7). The levelling instrument is then set up between the Bench Mark and the first staging point and readings of the staff taken at the two positions. This is repeated along the route to the VTS. It is important that the pairs of readings are taken in the correct sequence, otherwise an erroneous height difference will result. Figure
29 (vii) Van de Casteele Test This test involves taking readings of a manual probe against tide gauge readings over a full tidal cycle. As previously stated the sum of these two readings should remain constant, but this is only true in the case of a perfect tide gauge. Hence the Van de Casteele test is designed to determine the accuracy of the tide gauge, as the results having been taken over a full tidal cycle are then used graphically to produce a diagram, the shape of which will identify tide gauge faults. (See accompanying test example in Figure 3.8 and examples of diagrams indicating various faults in Figure 3.9). (viii) Stilling Well Test Although a Van de Casteele test may show a float gauge to be operating satisfactorily the information recorded by the gauge will only be accurate if the stilling well is also functioning satisfactorily. Only in severe cases of blockage of the stilling well inlet will this be obvious from the record obtained from the tide gauge (trace very smooth, large lag on rising and falling tides, particularly at mid-tide). To determine the performance of the stilling well it is necessary to take simultaneous readings of the water level inside and outside the well over a tidal cycle. The inside level can be taken by the manual probe and outside by reading the VTS. When the sea is agitated VTS readings will obviously be less accurate, so the test must be made when conditions are suitable. This test may be combined with the Van de Casteele test, VTS readings being taken every hour. (ix) Tide Gauge Accuracy An ideal tidal record will show the true water heights referred to the datum used for the whole period of the record. This is not usually the case and most tidal records have errors of some kind which are not always recognised. This situation can result in extra work at the analysis stage and if not adequately corrected during analysis, erroneous data will accumulate. The intention therefore is to record data that is of the highest possible accuracy and where this required standard is not possible with the equipment in use, to provide sufficient information for corrections to be applied at the analysis stage. (x) Datum Stability Datum stability is impossible unless we have a tide gauge/chart combination which gives the correct scaling factor. If the gauge does have a scaling error then this must be eliminated or a better gauge substituted. In a float operated gauge random datum variation can be caused by one or more of the following factors:- a) incorrectly fitted chart The chart may be a poor fit on the drum leaving a gap or overlap at the join. A step may also occur at the join, resulting in the pen trace suddenly jumping in height at the crossover. A flange is normally provided at one end of the chart drum so that the chart can always be fitted with the edge of the chart touching the flange. Failure to follow this procedure when fitting the chart will result in a datum change each time the chart is replaced. 26
30 Figure
31 Figure
32 b) stretch in float wire It is possible for some stretch to occur in the float wire particularly after being newly fitted. Regular datum checks on the gauge will be necessary until stretching ceases. It is important to use the float wires specified by the manufacturer as these will have been specially chosen to have the best non stretch characteristic. c) backlash in gauge mechanism Backlash due to poor adjustment can be eliminated by resetting the gauge gear train. Backlash resulting from worn gears can only be eliminated by replacement of the suspect gears. The diagram produced during a Van de Casteele test will show evidence of excessive backlash as separation of the diagram contour for the rising and falling tides; the greater the separation the worse the condition indicated. d) deterioration of float All floats deteriorate after prolonged periods of immersion in salt water due to corrosive attack. A hollow float which has corroded right through the skin will gradually take on water and with the added mass float lower and lower until it eventually sinks. Marine growth will also accumulate on a float and that portion which is attached above the water line will increase the effective mass of the float causing it to float lower in the water. This growth can also reduce the gap between the float and the stilling well until movement of the float becomes sluggish such that it lags behind the changing water level. It is particularly important therefore that floats are periodically removed for cleaning, examination and repair or replacement if found defective. e) movement of gauge supports It should be ensured that the supports on which a tidal recorder is mounted are stable and rigid. Flexing of the table or bench on which the recorder is supported can cause sudden displacement of the float wire which results in over-lapping turns appearing on the float wire drum. Many tide gauge houses are mounted on cantilevered structures over the edge of quaysides. These supports must be rigid and not liable to flexing, or an up and down movement of the building and recorder will result. This movement will appear on the gauge record as noise, and will be particularly noticeable during periods of high winds or when persons move around inside the building. It is also possible for the building to gradually settle over a long period, but this will be evident by check levelling from the Tide Gauge Bench Mark (TGBM) to a reference point on the recorder mounting. The contact mark should not be used as this reference point since it is sometimes located on the top edge of the stilling well and is not necessarily connected to the structure of the building. With a properly installed good quality gauge which is regularly maintained these sources of error can be minimised and in most cases eliminated. It is particularly important to set the chart correctly on the recording drum. Any requirement to reset the datum should not be treated as routine but investigated to find the reason for needing this action. It must also be remembered that a partly choked stilling well inlet produces recording errors which can appear as changes in datum and therefore the performance of the well must be frequently monitored. 29
33 3.2.3 MAINTENANCE Dependent on local situations and the types of instruments employed a local operator may or may not be required. In general with instruments using a recording chart fixed to a drum it will be necessary to replace this on a weekly basis and an operator then becomes necessary. When instruments are employed which record on punched tape or magnetic tape or where no local records are produced e.g. when the remote monitoring station is set up, then only routine maintenance visits at monthly or greater intervals become necessary. In the case of a remote station requiring a local operator his duties fall into two categories, maintenance and observation. (i) Maintenance by Operator The operator s duties are mainly concerned with maintaining the correct running of the instruments according to the maker s recommended maintenance schedules. For this work to be effective the operator must be provided with tools, lubricants and spares which are likely to be required. The following is a typical list of spares for a float operated gauge:- pens float and counterweight wires and wire connectors float clock Maintenance is simple but nevertheless important. The mechanism must be kept adequately lubricated particularly bearings and slides. Wires must be regularly examined for deterioration and replaced at the first sign of fraying. Clocks should be regularly checked on a daily basis and the errors noted. Mechanical clocks can be adjusted to correct constant errors but must be replaced or repaired if the error is random. Clocks should be cleaned periodically and reset, this operation being best left to a qualified clock repairer. The operator is also required to ensure the building is kept in good condition and to arrange for repair in case of storm or other damage. A routine for cleaning the stilling well inlet must be instituted, the period between cleaning operations being dependent on local conditions of growth and silt deposition. Periodic inspection of the VTS is required to check the condition of its mountings and cleaning of the face. Check levelling at least each year between the group of local bench marks and the contact point and VTS is necessary. (ii) Timing Most analogue tide gauges employ mechanical clocks to rotate the recording drum or advance the strip chart. Some use electric clocks employing synchronous motors driven from the local mains electrical supply. All types of clock are susceptible to erratic operation. Mechanical clocks can vary in speed with tension in the spring and with temperature. Electric synchronous clocks respond to the supply frequency which may change during the day particularly at peak load periods and then be corrected overnight at the power station. The result is that the clock may appear to be correct at the same time each day but vary about this 30
34 time as the load changes. It is very difficult to adequately correct for clock variation but whenever this is noted it must be recorded, so that corrections can be made at the analysis stage. A good quality mechanical clock should be accurate to within 1 minute over a period of one week and this is normally adequate. Timing errors can also be produced by a badly fitted chart- where the ends either overlap or leave a gap. In this circumstance the timing is correct only at one particular time every twenty four hours with an accumulating error over the remaining period. Note: Uncorrected timing errors will result in the acceptance of incorrect height readings. This is particularly significant when tide levels are changing rapidly. Timing checks can only be made by use of an accurate watch or clock which has recently been set to a time signal. (iii) Mechanical Clocks These should be periodically cleaned and set by a reputable watch repairer and then tested before being put into use. The clock should also be wound at equal intervals e.g. weekly; be fully wound, but not overwound. The clock should be protected against the ingress of dust. Operation in a constant temperature is also beneficial. When fitting the clock the meshing of the gears must be carefully carried out to avoid backlash or binding. (iv) Synchronous Clocks There is no control over the frequency of the power supply. If large variations are common then an alternative type of clock should be sought. Electro-mechanical clocks are likely to be more accurate than pure mechanical types. Crystal source clocks are even more accurate but few are available with sufficient torque to drive a recording drum or strip chart. Where charts do not fit the drum correctly then either the drum is the wrong diameter or is damaged, or the chart is the wrong length. Whichever is found to be wrong must be replaced. We have dealt with reducing errors as far as is possible by careful preparation and operation. However it is not possible to be certain that small errors are not creeping in from time to time unless the daily checks are carried out correctly and conscientiously. When longer periods occur between checks i.e. unmanned gauges, errors can go unnoticed. In the latter case it is useful to have an automatic system for checking datum and timing errors which equates to the daily check. (v) Daily Checks Before starting the daily checks it is essential to have an accurate watch or clock which has been synchronised to a standard time signal within the previous hours. The standard daily check sheet which is used on the British National Tide Gauge Network is shown in Table 3.1. The instructions for use of this check sheet are given on the reverse side of the sheet (Table 3.2). 31
35 32
36 33
37 In some instances it may not be possible to read the VTS at the same time as the recorder unless two people are present. If only one person is present then the recommended procedure is first to check that the recorder is set to the correct time then read the VTS at a precisely known time and take the height reading on the recorder for this same time using the timing graticule. With recorders which only give a digital readout another procedure must be adopted:- e.g. Read gauge at = metres Read VTS at = 6.25 metres Read gauge again at = metres Enter VTS reading on check sheet Gauge reading is 6, ,272 = which is then entered on check sheet. 2 When there is an appreciable scend on the VTS the reading will become less accurate and a judgement of the accuracy of this reading should be shown on the check sheet e.g. 6.2 metres ˆ0.1 metres. The information logged on the daily check sheets should be a true record of observations in no way modified to give neater looking results, since the information so recorded can be useful in the detection of timing and datum errors and stilling well performance. In the case of dual installations i.e. where there are two tide gauges at the same site a cross check between readings of the two instruments can also be useful in detecting a system malfunction. (vi) Weekly Checks At weekly intervals when changing charts the following additional checks are carried out: chart change requiring glue. check and possibly change or refill pen. wind clock. align the new chart to the correct time. This must be checked again after a few minutes to allow any backlash effects to be noticed and corrected. write the start time and date on the new chart. A check between the VTS and the chart record should show the same agreement as the previous chart. If this is not so the reason should be found, it is not sufficient to reset the pen. If a manual probe is kept at the site this can be used each week to check that the gauge datum is being maintained. Where other types of gauges are used the procedures will obviously differ from the one given, but should in general be as indicated in the maker s manual. 34
38 (vii) Identification of Faults Faults may occur from time to time though with good preventive maintenance these should be rare. Whenever a malfunction occurs it is necessary to identify the cause of the fault so that corrective action can be taken. Some faults which occur may not be noticed unless the observational procedures are strictly adhered to. The Van de Casteele test will identify most gauge faults. Simultaneous recording of water levels inside and outside the stilling well will identify stilling well faults. Non linear timing faults can be seen from examination of the daily check sheets. In general the more accurately noted are the observations then the greater the possibility of quickly identifying faults. The actual observations should be noted on the check sheet and not modified figures in an attempt to show good agreement; e.g. in the presence of large waves it will not be possible to obtain an accurate reading from the VTS, so this fact should be stated on the check sheet. A diary should be kept a the tide gauge station in which entries are made at the time of each visit by whosoever visits stating reason for visit and work done and any other items worth noting. A summary of essential checks for tide gauge operators can be found in Appendix OTHER TYPES OF TIDE GAUGES Although float operated analogue recording tide gauges are predominant many other types are in common use and a few of these will be described. Appendix 2 contains the names of suppliers of tide gauge equipment known to the authors. (i) Float Operated Gauges with Punched Tape Recorders The principal of operation of these instruments is similar to that already described for the analogue float gauge, the difference being in the way tidal information is recorded. These instruments do not give a continuous record of the tidal level but record spot heights at predetermined intervals of time, normally every fifteen minutes. These instruments contain a coding unit driven from the float mechanism. The coding unit is designed to transfer a height reading onto a recording tape at each recording period. The height is punched out in a binary code form as shown in the examples in Figure Reading these records by hand is particularly laborious and an automatic reader is necessary to translate the information on the tape into a more usable form. (ii) Pneumatic Gauges The descriptions which follow are limited to gauges which operate on pneumatic bubbler systems. Figure 3.11 shows the basic essentials of a bubbler system. Air is passed at a metered rate along a small bore tube to a pressure point fixed under water well below the lowest expected tidal level. The pressure point normally takes the form of a short vertical cylinder with a closed top face and open at the bottom. A small hole is drilled about half way down its length and metered air is entered through a connection on the top surface. As air from the tube enters the pressure point it becomes compressed and pushes the water down inside the chamber until the level of the bleed hole is reached when the air bubbles out through the hole and back to the surface. Provided that the air flow rate is low and the air 35
39 Figure
40 supply tube is not unduly long the pressure of air in the system now equals that of the pressure due to the depth of the water above the bleed hole plus atmospheric pressure. A pressure recording instrument connected into this supply tube will now record the changes in water level as changing pressures according to the law: P m = ρgh + P A where ρ = density of the water g = gravitational constant h = depth of water above the bleed hole P A = atmospheric pressure Most pneumatic instruments using the bubbler principle operate in the differential mode, sensors being so constructed that the system pressure is opposed by atmospheric pressure within the instrument. Hence the resultant pressure experienced by the sensor becomes P m = ρgh making height directly proportional to the pressure. Figure 3.11 Certain design principles have to be observed in the operation of bubbler systems of which the following are some. a) system datum The datum of a bubbler system is the bleed hole in the side of the pressure point. It is essential that this does not change in position and therefore that the pressure point is securely and rigidly fixed when installed. 37
41 b) volume of pressure point The pressure point acts as a buffer so that pressure changes produced by surface waves cause only small variations in the elevation of the water/air surface inside the pressure point. The amplitude of this oscillation is not only dependent on wave amplitude but also the ratio of supply tube and pressure point volumes. c) tube length The length of the supply tube is important since it controls the size of pressure point required, the longer the tube so the larger the pressure point volume required. There are frictional losses in the air passing through the tube, the losses being greater in longer tubes. d) flow rate The flow rate needs to be adjusted so that bubbles issue from the bleed hole in the pressure point at all times in the tidal cycle. On a falling tide it is not necessary for air to be supplied down the tube as bubbles will continue to issue from the bleed hole because of the decrease in water pressure. However, on a rising tide air needs to flow into the system at a rate sufficient to maintain the position of the water/air interface inside the pressure point. The required flow rate for any system can be determined by calculation knowing the volume of the system and the maximum rate of rise of water level. Where seiches occur the maximum rate of rising water level will be increased to that of the positive going seiche on the rising tide. It will be seen from the above statements that for any proposed installation there are limits to be observed if the monitored pressure is to be the same as that experienced at the pressure point bleed hole within the required tolerance. Bottom pressure gauges which sit on the sea bed and record pressure at intervals over periods of a month or even a year, are beyond the scope of the discussion. Readers are referred to Howarth and Pugh (1983) for further details. 3.4 REMOTE MONITORING Equipment to provide a remote monitoring facility will normally use a convenient output from the tide gauge instrument. A wide variety of systems are in current use but in general will fall into one of the following classes (i) Local Monitor This can be in the form of a dial indicator, chart recorder or digital display connected to a transmitter on the tide gauge by a directly linked electrical cable. (ii) Remote Monitor This is similar in principle to the system already described but employs private wire telephone lines to transmit signals. 38
42 (iii) Interrogable Remote Monitor These systems are connected to public switched telephone network (PSTN) telephone lines at the tide gauge sites and are triggered by remote calls to pass spot readings of the tide level at the time of call. (iv) Data Logger These systems are connected to the PSTN telephone lines but are designed to pass a section of or all stored data by use of a compatible terminal at the receiving end. These systems are normally matched into the PSTN via modems. The standard of accuracy required for tide gauges also applies to all remote monitoring equipment. Where the transmitter equipment is dependent upon a mains electrical supply to provide power a stand-by battery which automatically takes over in case of supply failure must be provided. 39
43 REFERENCES GREAT BRITAIN. Ministry of Agriculture, Fisheries and Food Advisory committee on Oceanographic and Meteorological Research. Tides Gauges : Requirements. GREAT BRITAIN. Ministry of Agriculture, Fisheries and Food Committee on Tide Gauges. Operating instructions of tide gauges in the national network. HOWARTH, M.J. & PUGH, D.T : Observations of tide over the continental shelf of North- West Europe. pp in, Physical Oceanography of Coastal and Shelf Seas, (ed. B. John). Amsterdam : Elsevier. 470pp. (Elsevier Oceanography Series, 35). LENNON, G.W : The evaluation of tide gauge performance through the Van de Casteele test. Cahiers Oceanographiques, 20, LENNON, G.W : Sea level instrumentation, its limitations and the optimisation of the performance of conventional gauges in Great Britain. International Hydrographic Review, 48(2), LENNON, G.W : National network to monitor sea level and the committee on tide gauges. Dock and Harbour Authority, 57, PUGH, D.T : The physics of pneumatic tide gauges. International Hydrographic Review, 49(2), 7l-97. PUGH, D.T : Methods of measuring sea level. Dock and Harbour Authority, 57, PUGH, D.T : The design of coastal tide gauges. pp in, Symposium on tide recording (ed. R. Britton). London Hydrographic Society. 200pp. (Hydrographic Society Special Publication No 4). SEELIG, W.N : Stilling well design for accurate water level measurement. U.S. Army, Coastal Engineering Research Center, Technical Paper No
44 4. DATA REDUCTION 4.1 THE NATURE OF TIDE GAUGE RECORDS Observed water levels are recorded on many media. The most visually helpful for local use, and therefore the most commonly used, are graphical records on a clock-driven drum with a pen linkage to a float in a stilling well. Refinements can include:- 1) replacement of the well by a pressure sensitive system. 2) recordings on magnetic tape, or paper tape. 3) transmission of signals to distant recording mechanism. All these refinements require additional translation facilities and expertise for interpretation. In case of breakdowns it has been proven that the continuous graphical recording is a vital support system. This section will be focused primarily on graphical recordings and their accurate interpretation to obtain meaningful statistics. (i) Graphical Recordings For proper interpretation, all charts should be supplied with the following information:- 1) Time scale or paper speed clearly marked. 2) Height scale clearly marked. 3) Units. 4) Time zone in use e.g = British Summer Time; = West Indies,. Venezuela. 5) Time put on and removed; time marks noted by independent, accurate time piece. 6) Height checks noted by reference to independent height scale and national datum and visual tide scale or bench marks. 7) Completed check sheets to indicate 4 6 above AND any errors noted or corrected and problems encountered. a) 24-hour rotation drum can be left recording up to 14 days As the time of occurrence of tides is predominantly controlled by lunar time, high tides at most places in the world occur at a slightly later time each solar day. (A lunar day is approximately 24 hours 50 minutes, compared with a solar day of 24 hours). This factor can allow a tide gauge operator to leave a record on a 24 hour gauge drum for a number of days, so the recordings overlap over the same scale. For ease of interpretation, the safe time limit is dictated by local conditions (see Figures 4.l a, b and c). 41
45 Figure 4.1a 24 hour gauge drum recording for 13 days at Liverpool, England 42
46 Figure 4.1b 24 hour gauge drum recording for 7 days at Portpatrick, Scotland Figure 4.1c 24 hour gauge drum recording for 2 days at Belfast, Northern Ireland 43
47 b) 7 day drum usually changed once a week From the interpretation point of view, these types of gauges are rarely recommended, the size of the time scale is dictated by the circumference of the drum. For most tidal sites, the resulting scale is frequently too small to distinguish precise hourly levels particularly if the tidal range is anything more than 2 metres (see Figure 4.2). Figure day drum record from Madagascar. Tidal range 4 metres. Scale on original : 2mm = 1 hour, 5 cm = 1 m c) continuous roll lasts as long as the paper These records are often accompanied by an independent time marking pen, the trace of which can also be used to check the alignment of the paper as it moves on the gauge. Frequent checks of moving the pen to the zero line as a time and reference mark are also helpful for interpretation (see Figure 4.3). 44
48 Figure 4.3 Continuous roll recording from Australia 4.2 INTERPRETATION OF RECORDS Graphical tidal records, once removed from the gauge, should still contain a lot of information that must all be collated and accurately interpreted in order to maximise their use. They should be clearly labelled with dates and times by the operator and referenced to a known datum level. The tidal traces themselves are unique records of events at the gauge site so that effects of storms or high winds, for example, may be clearly seen, or errors in the mechanics of the instrument can be detected by examination of the nature of the pen trace. The following three sections indicate some of the features that cause problems for the interpreter. 45
49 4.2.1 CHART LABELS AND ZERO LEVELS (i) Time Zone If not labelled on the records, or not known, this can be reasonably established by plotting the times of predicted high waters on the tidal trace. (ii) Reference Datum Recorded tidal levels are of little value unless related to some reference point. All gauges should have a Bench Mark which can then be related to the national datum (see Figure 4.4). Figure 4.4 (iii) Dating of Records Always check that the number of tidal curves agree with the dates written on the chart. The pen may have stopped inking, the clock stopped or there may be an error on the labels. (iv) Additional Notes Checks against visual tide staffs or Van de Casteele checks on the well should be made available with the records. Notes about weather conditions or any mechanical difficulties are also extremely helpful towards accurate extraction of values, as on the Check Sheet shown in Table
50 Table MECHANICAL ERRORS In all cases, operator s comments on check sheets or charts themselves help to identify any problems. Many mechanical problems can have the same visual effect on the charts and without comment can be difficult to classify. If there are no comments to help, it is recommended to check out a strange tidal profile against records from a nearby site where available. This exercise proves whether the effect is mechanical and therefore a unique fault, or caused by weather conditions. The former can often be interpolated or corrected in some way, whereas meteorological effects should never be nullified. Whatever the mechanical error, the need from the data-reduction point of view (and ultimate analysis) is to minimise the gaps so caused. But this practice of filling gaps must be executed with caution and, where relevant, local knowledge of the tidal profile. Nothing is achieved by filling a gap in observations with predicted values, or artistic impressions when there is a likelihood of storms or high winds (see Figures 4.5 a, b and c). 47
51 Figure 4.5a Severe mechanical problem causing lag on recording Figure 4.5b Counterweight & float wire problems. Some interpolation possible. 48
52 Figure 4.5c Clock stoppages. Presence of storms prevents interpolation (i) Clock Failures Time errors are dealt with in section 4.3, but clock stoppages are fairly easily identified by a vertical line. So long as not more than one high tide and one low tide have lapsed before discovery of the fault, it is possible to draw in the likely tidal profile. The extent of the pen trace (because its mechanism is linked with the float gearings) will indicate the heights of high and low water thus making the remainder of the profile sketchable. Caution must be applied in guessing the times of these extremes, however. If severe weather effects are involved it is better to omit the record. If more than one tide has lapsed the ink trace will only indicate the extremes of levels achieved and interpolation must not be attempted. (ii) Ink Run Out or Pen Off Record If there are recordings of the profile either side of a missing section, it is possible to sketch in the missing trace. No more than six to seven hours should be attempted. As for clock stoppages above, the most critical portion of tide that should not be guessed are high and low waters. 49
53 (iii) Float Jamming This problem manifests itself as steps on the record, because the float is caught and then released. Small periods of up to an hour can be interpolated without trouble. If the fouling is severe however, the resultant records will also show the affects of siltation. (iv) Silt The effect of silt in the well will cause a delay in the flow of water with the tide. Occasionally this effect is visible on the record (particularly if the normal record is familiar), but more often the evidence is not clear until a full analysis is undertaken, unless the silt builds to a high level when the profile will be totally distorted. Sometimes silt will show as flats at low and high water, particularly at spring tides. If several days record are effected, it is advisable to leave a gap until the well is cleared which should be noted on the charts or check sheets. (v) Overriding Turns on Float Cable This problem does not always show at all on the tidal records, particularly if it is a constantly occurring problem. The only occasions when detection and interpolation is possible is if the wire suddenly releases after a few turns. This, like the float jamming, will show as small steps that can be sketched through WEATHER EFFECTS The effects of the tidal forces of the sun and moon on the Earth s oceans are distorted by the presence of land masses, variations in water depth and atmospheric conditions. Some of these effects are clearly evident on the tidal records. (i) Seiches These are short period oscillations typical of shallow enclosed basins like the North Sea and some enclosed harbours. These effects should be smoothed, or filtered out, when extracting tidal levels from the records (see Figure 4.6). (ii) Storm Surges Changes in winds and atmospheric pressure can cause the observed tidal level to be very different from the predicted value especially during storms. These can produce unusually high tides (positive surges), or unusually low tides (negative surges). The timing of the tides can also be considerably altered from the normal, making day sorting, where not already labelled, difficult. These effects should NOT be smoothed, or filtered out, when extracting tidal levels from the records (see Figure 4.7). 50
54 Figure 4.6 Seiches on records can be drawn through the centre with care Figure 4.7 Storm surges on records must not be smoothed 51
55 (iii) Tsunamis Seismic sea-waves are the destructive oceanic offspring of earthquakes and volcanic eruption. In areas where these occur (mainly Pacific islands) the effect on tide gauges is very destructive. Great efforts are made in these areas to make the installations severe storm proof (see Figure 4.8). Figure EXTRACTION OF LEVELS Generally, the higher degree of accuracy employed in the extraction of levels, the more useful they become. The extraction of the heights of Low Water and High Water each day, and averaging the findings over a month and year, produce MEAN TIDE LEVELS. The extraction of a) 3-hourly heights or b) hourly heights and averaging the results over a period of a month and year produce MEAN SEA LEVEL VALUES. The extraction of hourly heights fully corrected for gauge time and height errors over a long period, can be used for: a) Full Tidal Analysis b) Mean Sea Level Statistics c) Tidal Regime Studies. 52
56 Therefore, to maximise their use, it is preferable that all corrections are accurately applied when extracting levels. This can involve painstaking attention to detail and obtaining answers to the following questions: (i) Charts 1) What is the time zone? 2) What is the reference datum? 3) Do the dates given agree with the recordings? 4) Are there any additional notes with the records? 5) Are there any timing checks or datum checks apparent or noted? 6) Was the chart on straight? 7) Are there any timing or datum alterations apparent or noted? 8) Do continuity checks show a trend? 9) Do any trends disprove any other information? 10) Are any mechanical defects evident? Can they be corrected? 11) Are any meteorological effects evident? 12) Are there any records from a nearby site available which could be used as a comparison? (ii) Digital Gauges (Additional facilities are required to interpret the tape) 1) What is the time zone? 2) What is the datum? 3) Are the start and end times available? 4) Do the number of values obtained agree with the start and end times? 5) If a pressure gauge, are all the parameters available i.e. density, gas pressure, tube length etc.? (iii) Clock Errors Most gauge clocks suffer from losing or gaining naturally over a period and/or FRICTION. There may be BACKLASH i.e. despite the pen/clock being set correctly it may take some minutes for the drum to take up. the drive that is, for the friction in the mechanism to take hold. (iv) Continuity Checks By checking where the pen trace ends on each of a number of chart records, or for continuous roll, over a number of checks, the timing in the gearing can be established. Transfer a section of trace from chart a (off) to chart b (on) The result should be a continuous line. Any discontinuities denote an error in the gauge clock or operator error. Keep a record chart by chart, or from check to check, of the apparent errors. 53
57 Then apply the findings to the levels; e.g. 1) No apparent error read heights from chart scale. 2) Pen trace appears to finish late when compared with the following chart check that the following chart does NOT begin AND end early (chart started at wrong time by operator) - then read to the right to correct; little or nil at start of record (or last known correct time), increasing to scale of error (see Figure 4.9a). Figure 4.9a 3) Pen trace appears to stop early at the time of chart removal - check that the following chart does NOT begin AND end late (chart started at wrong time by operator)-then read to the left to correct; little or nil at start of record (or last known correct time), increasing to scale of error (see Figure 4.9b). Figure 4.9b 4) Backlash. This is very difficult to detect without the co-operation of a good tide gauge operator because the drum will merely have a delay in turning. There may be evidence of a small vertical trace of tidal motion to give a clue, but only when this problem is quite severe. 54
58 Usually a good operator with an accurate independent time piece completing check sheets, or marking clearly on the records, will soon indicate a trend in the gauge clock, such that it becomes a regular familiar feature. Check the number of hours or days involved the errors should be reasonably consistent. Otherwise suspect the time piece. (v) Other Errors to Consider 1) Chart set to wrong margin of drum. Continuity will appear high or low which can be misinterpreted as a tine error, inconsistent with other charts. Continuity shows new chart on high on a falling tide, low on a rising tide. But beware of seiches. 2) Chart set askew. Chart not aligned on sprockets or drum correctly. If the chart has been cut, check by realigning the ink traces, i.e. recreate the position on drum. Severe misalignments can be difficult to correct. The complete height/time scale may need redrawing. Remember the pen/float section is independent of the clock drive and printed chart. A gauge drum no matter how distorted (through being dropped for example) still revolves ONCE per 24 hours or once per week. The distortion can cause the chart to appear fitted incorrectly plus or minus inherent clock error. 3) Damp or warped charts caused by bad storage or humid conditions at the site. Again, the scale must be redrawn to accommodate the problem. 4) Varying paper speeds on continuous roll records. Usually these gauges have an independent tine marker pen which flicks at regular intervals. Check the speed by measuring the distance. This pen trace can also be used to indicate that the chart paper has maintained a straight path or drifted in which case height corrections must be applied. 4.4 STATISTICS : The Generation of Statistical Information (i) Mean Tide Levels Average of high and low water heights, ensuring equal number of each, to produce monthly and annual values. See example in Table 4.2. (ii) Mean Sea Levels 1. Average of hourly heights to produce monthly and annual values. See example in Table Filtered average of 3-hourly readings Z0 filter. 3. Filtered average of hourly readings X0 filter. N.B. The latter two methods of obtaining mean sea level statistics normally require some form of computing facility for efficient application. The most commonly used filter to compute Mean Sea Level is the Doodson X0. (see Appendix 3). 55
59 Table
60 57
61 (iii) Mean Low Waters and Mean High Waters The average of all the observed high water heights give Mean High Water and similarly the average of all low water heights produce Mean Low Water. (iv) Extreme Tidal Levels Records of the extreme high and low waters are usually maintained on a monthly basis. Both items (iii) and (iv) can be extracted from records of high and low water heights and times, which can therefore prove to be a most useful supplement to hourly levels. REFERENCES GRAFF, J. & KARUNARATNE, D.A : Accurate reduction of sea level records. International Hydrographic Review, 57(2), KARUNARATNE, D.A : An improved method for smoothing and interpolating hourly sea level data. International Hydrographic Review, 57(1), LENNON, G.W : The treatment of hourly elevations of the tide using an IBM International Hydrographic Review, 42(2), MINAKER, E.J : A proposed system for the handling of tide and water level data at MEDS. Canada, Marine Science Directorate, Manuscript Report Series, No 52, NOYE, B.J : Tide-well systems. 3. Improved interpretation of tide-well records. Journal of Marine Research, 32,
62 5. DATA EXCHANGE PROCEDURES 5.1 GENERAL This manual is principally concerned with the methods of analysis and data reduction. Although the measurements at a single site are valuable, the information which can be extracted by comparison of measurements at several sites, makes it highly desirable to define common methods of measurement and analysis. It also makes the systematic data banking of the observations and their general availability equally desirable. If trends in sea level are to be detected then, because of the many regional factors involved, data banking of the selected parameters on a global scale becomes imperative. This section summarises briefly arrangements which have been made for such international exchange, and the role of the Permanent Service for Mean Sea Level in coordinating monthly and annual mean values. 5.2 NATIONAL DATA BANKS It is usual to maintain national data banks of sea level in the form of hourly values, daily mean, monthly mean and annual mean values. The basic requirement would be sets of tabulated values, but as the volume of data increases, modern technology demands banking on magnetic tape using proper data banking procedures. National oceanographic data banks are usually the best equipped to undertake this work. 5.3 INTERNATIONAL ASPECTS Sea level data is exchanged internationally for operational purposes and for longer-term monitoring activities. The Integrated Global Oceans Services System (IGOSS) which is a joint Intergovernmental Oceanographic Commission and World Meteorological Organisation activity, provides for exchange of monthly mean sea levels within weeks of the end of the calendar month in question. The purpose is to obtain data with very little delay rather than to receive the final polished and extensively checked version. At present a pilot scheme for publishing maps of deviations of monthly sea levels from mean sea level averaged over a long period in the Pacific Ocean is underway. It is expected that this pilot scheme may be extended later to other oceans as part of the general developments in support of climate research. The International Oceanographic Data Exchange (IODE) was established by the Intergovernmental Oceanographic Commission in The major objective of the IODE is to collect, process, archive, retrieve and exchange oceanographic data and information on a world-wide basis, with the aim to render services to the scientific community, to the off-shore industry and to governments. Within the framework of IODE, responsible national oceanographic data centres have been appointed to assist in the development of special programmes. An example of such a centre for sea level was the role played by the Permanent Service for Mean Sea Level in the development of the MEDALPEX experiment. IODE also defines standard formats for international data exchange. Appendix 4 gives details of the 59
63 approved standard GF-3 subset for supplying mean sea level data to PSMSL. Similarly, PSMSL makes data available to users in the same format. 5.4 THE PERMANENT SERVICE FOR MEAN SEA LEVEL The Permanent Service for Mean Sea Level (PSMSL) was established in 1933 as an international data centre for mean sea level. Its present responsibilities include collection, publication and distribution of data and the analysis and interpretation of this data. Advice on practical aspects of sea level measurement and data reduction is also given. An example of the way in which PSMSL encourages uniform standards and procedures is the preparation of this manual, which is itself based on courses given at the Institute of Oceanographic Sciences, Bidston Observatory, United Kingdom, where PSMSL is housed. Data and other information are available free of charge to the scientific community. Up-to-date computer listings can be sent of monthly and annual mean values, and data are also available on magnetic tape in GF-3 format. A catalogue of all data held by PSMSL is available on request. PSMSL receives financial support from UNESCO through the Intergovernmental Oceanographic Commission and from the United Kingdom Natural Environment Research Council. Formally PSMSL is a member of the Federation of Astronomical and Geophysical Services, established by the International Council of Scientific Unions. It operates under the aegis of the International Association for the Physical Sciences of the Ocean. 5.5 SUBMISSION OF DATA TO PSMSL PSMSL is grateful to all organisations supplying mean sea level data for publication and does not seek to impose unnecessary conditions upon these contributors. However, the following common basic requirements are suggested for data submission:- 1) Units (feet, metres, etc.). 2) Statement of the datum to which the values refer. 3) Statement of the measured depth of that datum below the primary TGBM. 4) An indication of incomplete or interpolated data (see below). 5) Information of changes in datums, bench marks or relevant procedures since the previous batch of submitted data. Mean heights should preferably be in the metric system to the nearest millimetre and the datum to which the mean refers should ideally be the tide gauge zero. One of the most important things for users of the mean sea level data publications to know is the accuracy of the published figures. PSMSL recommends that incomplete records be treated according to the following guiding principles:- 1) Gaps in observed tidal records should be interpolated, if possible before computing monthly and annual means. 2) The interpolation should be performed at an early stage in the processing. 60
64 3) In cases where interpolation is impossible, the monthly mean should be compiled from the incomplete data. Where more than 15 days are missing from a month, the mean value should not be computed. 4) When sending mean values to PSMSL, authorities are requested to use suffixes after each monthly mean to indicate the exact number of missing days of data. The suffix should be in parenthesis, although if missing days have been interpolated then xx should be specified instead. Thus : 2487 (9) would mean 9 daily mean values were missing and not interpolated when computing the mean of 2487 mm. 913 (xx) would mean missing data were interpolated to provide the average of 913 mm. 5) No suffixes need to be placed after the annual mean. It is assumed that all data used to derive monthly means will be used to calculate the annual mean where this is given, and the user of the data will judge the reliability of the annual mean accordingly. 6) If annual means are computed by averaging the monthly means, the monthly means must first be weighted. The weights for each month should be the number of days for which readings were available. National and other authorities concerned with the measurement of sea level data are invited to discuss their problems with the Permanent Service for Mean Sea Level whose address is:- Bidston Observatory, Birkenhead, Merseyside L43 7RA, United Kingdom Telephone No Approaches may be made directly, or through the appropriate data exchange channels established by the Intergovernmental Oceanographic Commission with which PSMSL has close relationships. 61
65 APPENDIX 1 SUMMARY OF ESSENTIAL CHECKS FOR TIDE GAUGE OPERATORS The instructions which follow are extracted from the booklet Operating Instructions for Tide Gauges on the National Network issued to all operators of tide gauges in the U.K. national tide gauge network. They form a summary of the essential checks required to be undertaken by the operator and are normally displayed prominently inside the tide gauge building. DAILY CHECKS CHECK SHEET COLUMN READ TIDE STAFF AND TIME OF READING 4 READ RECORDER HEIGHT 5 READ RECORDER INDICATED TIME 3 ENTER TIME OF READING RECORDER 2 ENTER DATE 1 ENTER REMARKS INCLUDING FAULTS ETC. 6,7,8,9 ENTER CHECKER S INITIALS 10 DO NOT ADJUST THE GAUGE WEEKLY CHECKS CARRY OUT DAILY CHECKS REMOVE GRAPH SHEET FROM DRUM CUTTING ALONG GROOVE PROVIDED AND CLIP TO CHECK SHEET WIND CLOCK CHECK PEN. CLEAN AND REPLENISH AS NECESSARY FIT NEW GRAPH SHEET TO DRUM ENSURE BOTTOM EDGE OF SHEET IS AGAINST DRUM FLANGE AND GRADUATIONS ARE IN LINE ALL ALONG JOIN WRITE DATE AND TIME ON GRAPH SHEET AND FIT DRUM TO INSTRUMENT SET PEN ON CORRECT TIME AND ELIMINATE BACKLASH ENTER ON NEW CHECK SHEET DATE AND TIME NEW GRAPH SHEET PUT ON CARRY OUT DAILY CHECKS 62
66 APPENDIX 2 SUPPLIERS OF TIDE GAUGE EQUIPMENT (Known to authors of the manual) 1. A. Ott, GMBH 8960 Kempten Jagerstrasse 4-12 Postf GERMANY 2. Munro Sestrel Ltd Loxford Road Barking Essex IG11 8PE ENGLAND 3. Kent Instruments Biscot Road Luton Bedfordshire LU3 1AL ENGLAND 4. Aanderaa Instruments Fanaveien 13 P.O. Box Bergen NORWAY 5. Neyrtec BP 75 Centre de Tri Grenoble Cedex FRANCE 6. Leupold & Stevens, Inc P.O. Box 688 Beaverton Oregon, U.S.A. 7. Aga Navigation Aids also Beacon Works S High Street Lidingo Brentford TW8 OAB SWEDEN ENGLAND 8. Iastumenten Fabriek Van Essen Delft HOLLAND 63
67 APPENDIX 3 APPLICATION OF X0 FILTER FOR COMPUTATION OF MEAN SEA LEVEL The purpose of this low-pass filter is to remove the tidal energy at diurnal and higher frequencies from sea level elevations, and requires 39 hours of data for each value calculated. The filter is defined as follows, for 1 > t > 19:- F(t) = (2, 1, 1, 2, 0, 1, 1, 0, 2, 0, 1, 1, 0, 1, 0, 0, 1, 0, 1) The filter is symmetric, so that F(t) = F(-t), and is applied for each day, giving a mean computed as d= 19 1 XT = F( d) H( T+ d), d 0 30 d= 19 where H(t) are the sea level elevations, and T = 1200 hours. Example worked by hand Taking a central time of 1200 hours, 2 January, data from 3 days are involved:- 1 JANUARY Time Height * 1 * 1 * JANUARY Time Height * 1 * 1 * 2 * 1 * 1 * 2 * 1 * 1 * Time Height * 2 * 1 * 1 * 2 * 1 * 1 * 2 * JANUARY Time Height l.703 * 1 * 1 * 1 * SUM = metres /30 = metres (MSL for 2 January) 64
68 APPENDIX 4 65
69 66
70 67
71 68
72 69
73 70
74 GLOSSARY Analysis For the purpose of analysis the observed sea levels are separated into three components:- (1) Mean sea level (2) Tidal levels (3) Surge levels Chart Datum Chart datum is the low water plane, below which depths on a nautical chart are measured and above which tidal levels are measured. Contact Mark A permanent reference mark of known altitude at a tide gauge, from which the level of the water inside the float well can be directly measured. This mark is used to check the accuracy of heights displayed on the recorder and is located either on the frame of the recorder or on some stable object near the stilling well. Diurnal Tides Tides having periods of approximately 1 day. Extreme High or Low Water The highest or lowest elevation reached by the sea during a given period. Harbour Datum Harbour datum is a horizontal plane, defined by the local harbour authority, from which levels and tidal heights are measured by that authority. Harmonic Analysis The analysis of an observed sea level record into a set of harmonic constants which can be used for tidal predictions. Harmonic Constants Tides are periodic oscillations generated by and related to the motions and attractive forces of the moon, sun and earth system. The tide can be represented by the sum of a series of sine waves of determined frequency harmonic constituents. The parameters of each sine wave are called harmonic constants, and are the amplitude (half the height) of the wave and phase, or time of occurrence, of the maximum. Higher High Water (H.H.W.) The highest of the high waters of any specified day. Higher Low Water (H.L.W.) The highest of the low waters of any specified day. 71
75 Highest and Lowest Astronomical Tide (H.A.T. & L.A.T. ) The highest and lowest levels respectively-which can be predicted under average meteorological conditions. These are not the extreme levels which can be reached as storm surges may cause considerably higher and lower levels to occur. Inlet The small hole or holes situated at or near the bottom of the stilling well through which the tidal water passes in and out. The area and form of the inlet are determined in relation to the area of cross section of the well, so as to achieve maximum damping of unwanted oscillations without causing an acceptable departure from the height of the tide to be recorded. Indian Spring Low Water (I.S.L.W.) A datum originated by Darwin when investigating tides of India. It is an elevation depressed below mean sea level by an amount equal to the sum of the amplitudes of the harmonic constituents M2,S2,K1 and O1. Long Period Tides Tides having periods of 1 year, 6 months, 1 month and a fortnight. Lower High Water (L.H.W.) The lowest of the high waters of any specified day. Lower Low Water (L.L.W.) The lowest of the low waters of any specified day. Mean Higher High Water (M.H.H.W.) The average of all the higher high water heights over a period. Mean High Water (M.H.W.) The average of all high water heights observed over a period. Mean High Water Neaps (M.H.W.N.) The average of high water heights occurring at the time of neap tides. Mean High Water Springs (M.H.W.S.) The average of high water heights occurring at the time of spring tides. Mean Lower Low Water (M.L.L.W.) The average of the lower low water heights over a period. Mean Low Water (M.L.W.) The average of all low water heights observed over a period. Mean Low Water Neaps (M.L.W.N.) The average of the low water heights occurring at the time of neap tides. 72
76 Mean Low Water Springs (M.L.W.S.) The average of the low water heights occurring at the time of spring tides. Mean Sea Level (M.S.L.) The mean value of sea level extracted from a suitably long series of data. Mean Tide Level (M.T.L.) The arithmetic mean of mean high water and mean low water. Mixed Tide Type of tide with a large inequality in either the high and/or low water heights. National Datum A fixed reference adopted as a standard geodetic datum for elevations determined by levelling. Neap Tide Tides of decreased range occurring semimonthly as the result of the Moon being in the first or third quarter. Non-Linear Tides Tides produced in shallow water or by frictional effects which have periods equivalent to 4, 6, 8 cycles or more per day. Permanent Tide Scale A fixed, immersed scale on which the level of the tide can be directly read. A permanent scale for use with tide gauges should be set up in open tidal water close to the tide gauge installation. (1) with its zero mark in the plane of the tide gauge datum, and (2) so that the scale can be accurately read from the site of the recorder. A permanent tide scale may be a pole, board or graduations on a wall. Probe An electrode designed to sense water level by contact. At certain installations a probe is set at a pre-determined height to produce a mark on the recorder graph as the water level reaches it. Portable probes are also used to check the level of the water in the well. Radiational Tides These are tidal variations caused by solar radiation. Like the gravitational tides, but unlike meteorological effects, they are coherent in time. 73
77 Recorder That part of an automatic tide gauge that records the height and time of tide. The record may be a graph on specially printed paper or a punched paper or magnetic tape. The recorder may be close by the monitoring point or remote from it. Recorder Graph The curve of height against time plotted on a recorder. Sea Level The observed level of the sea surface relative to a predefined datum at any instant of time. Seasonal Modulations These are variations in sea level with time scales of 1 year and 6 months. Part of the seasonal modulation is coherent with. the long period tides and is therefore included in tidal predictions. Secular Trend The non-periodic tendency of sea level to rise, fall, and/or remain stationary with time. Seiche A seiche is a short-period oscillation occurring in a harbour, bay, or gulf, analogous to the oscillations of water in a dish, and it is unrelated to actual tides. Semi-Diurnal Tides Tides having periods of approximately 12 hours. Spring Tide Tides of increased range occurring semimonthly as the result of the Moon being new or full. Stilling Well The tube in which the float travels up and down according to the movement of the tides. Surge Level The meteorologically induced component, sometimes called the non tidal residual. It is not predictable in a time series but its statistics have some regularity. Tidal Level That part of the observed sea level which is coherent with tide generating forces and is therefore predictable from a set of harmonic constants. Tide Gauge Apparatus for determining the level of the tide. This term embraces the whole of the equipment used at any place to measure the height of the tide. It embraces the float, float well, transmission to the recorder and the recorder. The term also include permanent tide scales. 74
78 Tide Gauge Bench Mark A bench mark near the gauge used for check levelling. Repeated levellings from the tide gauge bench mark to other bench marks in the vicinity check the stability of the tide gauge installation. Tide Gauge Datum The horizontal plane from which tidal heights are measured at a tide gauge. It usually coincides with chart datum or harbour datum. Tsunami A shallow water progressive wave, potentially catastrophic, caused by underwater earthquake or volcano. 75
ebb current, the velocity alternately increasing and decreasing without coming to
 Slack water (slack tide): The state of a tidal current when its velocity is near zero, especially the moment when a reversing current changes its direction and its velocity is zero. The term is also applied
TIDES. 1. Tides are the regular rise and fall of sea level that occurs either once a day (every 24.8 hours) or twice a day (every 12.4 hours).
 or twice a day (every 12.4 hours).") TIDES What causes tides? How are tides predicted? 1. Tides are the regular rise and fall of sea level that occurs either once a day (every 24.8 hours) or twice a day (every 12.4 hours). Tides are waves
TIDES What causes tides? How are tides predicted? 1. Tides are the regular rise and fall of sea level that occurs either once a day (every 24.8 hours) or twice a day (every 12.4 hours). Tides are waves
Name Period 4 th Six Weeks Notes 2015 Weather
 Name Period 4 th Six Weeks Notes 2015 Weather Radiation Convection Currents Winds Jet Streams Energy from the Sun reaches Earth as electromagnetic waves This energy fuels all life on Earth including the
Storm tide is the water level rise during a storm due to the combination of storm surge and the astronomical tide.
 INTRODUCTION TO STORM SURGE Introduction to Storm Surge BOLIVAR PENINSULA IN TEXAS AFTER HURRICANE IKE (2008) What is Storm Surge? Inland Extent Storm surge can penetrate well inland from the coastline.
Storm tide is the water level rise during a storm due to the combination of storm surge and the astronomical tide.
 INTRODUCTION TO STORM SURGE Introduction to Storm Surge National Hurricane Center Storm Surge Unit BOLIVAR PENINSULA IN TEXAS AFTER HURRICANE IKE (2008) What is Storm Surge? Inland Extent Storm surge can
Rapid Changes in Earth s Surface
 TEKS investigate rapid changes in Earth s surface such as volcanic eruptions, earthquakes, and landslides Rapid Changes in Earth s Surface Constant Changes Earth s surface is constantly changing. Wind,
Thompson/Ocean 420/Winter 2005 Tide Dynamics 1
 Thompson/Ocean 420/Winter 2005 Tide Dynamics 1 Tide Dynamics Dynamic Theory of Tides. In the equilibrium theory of tides, we assumed that the shape of the sea surface was always in equilibrium with the
TECTONICS ASSESSMENT
 Tectonics Assessment / 1 TECTONICS ASSESSMENT 1. Movement along plate boundaries produces A. tides. B. fronts. C. hurricanes. D. earthquakes. 2. Which of the following is TRUE about the movement of continents?
Tides and Water Levels
 Tides and Water Levels What are Tides? Tides are one of the most reliable phenomena in the world. As the sun rises in the east and the stars come out at night, we are confident that the ocean waters will
Chapter Overview. Bathymetry. Measuring Bathymetry. Echo Sounding Record. Measuring Bathymetry. CHAPTER 3 Marine Provinces
 Chapter Overview CHAPTER 3 Marine Provinces The study of bathymetry charts ocean depths and ocean floor topography. Echo sounding and satellites are efficient bathymetric tools. Most ocean floor features
Tide - rhythmic oscillation of the ocean surface due to gravitational & centrifugal forces ( inertia ) between the Earth, Moon and Sun.
 between the Earth, Moon and Sun.") Chapter 4: The Changing Level of the Sea Tides Longer Scale Variations Influence on Beaches Tide - rhythmic oscillation of the ocean surface due to gravitational & centrifugal forces ( inertia ) between
Chapter 4: The Changing Level of the Sea Tides Longer Scale Variations Influence on Beaches Tide - rhythmic oscillation of the ocean surface due to gravitational & centrifugal forces ( inertia ) between
What causes Tides? If tidal forces were based only on mass, the Sun should have a tidegenerating
 What are Tides? Tides are very long-period waves that move through the oceans as a result of the gravitational attraction of the Moon and the Sun for the water in the oceans of the Earth. Tides start in
The Map Grid of Australia 1994 A Simplified Computational Manual
 The Map Grid of Australia 1994 A Simplified Computational Manual The Map Grid of Australia 1994 A Simplified Computational Manual 'What's the good of Mercator's North Poles and Equators, Tropics, Zones
The concepts developed in this standard include the following: Oceans cover about 70% of the surface of the Earth.
 Name Date Grade 5 SOL 5.6 Review Oceans Made by SOLpass - www.solpass.org [email protected] Reproduction is permitted for SOLpass subscribers only. The concepts developed in this standard include
Geography affects climate.
 KEY CONCEPT Climate is a long-term weather pattern. BEFORE, you learned The Sun s energy heats Earth s surface unevenly The atmosphere s temperature changes with altitude Oceans affect wind flow NOW, you
Seasonal & Daily Temperatures. Seasons & Sun's Distance. Solstice & Equinox. Seasons & Solar Intensity
 Seasonal & Daily Temperatures Seasons & Sun's Distance The role of Earth's tilt, revolution, & rotation in causing spatial, seasonal, & daily temperature variations Please read Chapter 3 in Ahrens Figure
Advice For the multiple-choice questions, completely fill in the circle alongside the appropriate answer(s).
.") SPECIMEN ASSESSMENT MATERIAL GCSE GEOGRAPHY Paper 1 Living with the physical environment Specimen Materials For this paper you must have: a pencil a ruler. Time allowed: 1 hour 30 minutes Instructions
SPECIMEN ASSESSMENT MATERIAL GCSE GEOGRAPHY Paper 1 Living with the physical environment Specimen Materials For this paper you must have: a pencil a ruler. Time allowed: 1 hour 30 minutes Instructions
COASTAL DAMAGE INSPECTION SOUTHWEST VITI LEVU, FIJI AFTER CYCLONE SINA
 COASTAL DAMAGE INSPECTION SOUTHWEST VITI LEVU, FIJI AFTER CYCLONE SINA Brendan J. Holden SOPAC Technical Secretariat July 1992 SOPAC Technical Report 148 Prepared for: South Pacific Applied Geoscience
AS COMPETITION PAPER 2008
 AS COMPETITION PAPER 28 Name School Town & County Total Mark/5 Time Allowed: One hour Attempt as many questions as you can. Write your answers on this question paper. Marks allocated for each question
Experiment (13): Flow channel
: Flow channel") Introduction: An open channel is a duct in which the liquid flows with a free surface exposed to atmospheric pressure. Along the length of the duct, the pressure at the surface is therefore constant and
Introduction: An open channel is a duct in which the liquid flows with a free surface exposed to atmospheric pressure. Along the length of the duct, the pressure at the surface is therefore constant and
The Dynamic Crust 2) EVIDENCE FOR CRUSTAL MOVEMENT
 EVIDENCE FOR CRUSTAL MOVEMENT") The Dynamic Crust 1) Virtually everything you need to know about the interior of the earth can be found on page 10 of your reference tables. Take the time to become familiar with page 10 and everything
The Dynamic Crust 1) Virtually everything you need to know about the interior of the earth can be found on page 10 of your reference tables. Take the time to become familiar with page 10 and everything
Chapter Overview. Seasons. Earth s Seasons. Distribution of Solar Energy. Solar Energy on Earth. CHAPTER 6 Air-Sea Interaction
 Chapter Overview CHAPTER 6 Air-Sea Interaction The atmosphere and the ocean are one independent system. Earth has seasons because of the tilt on its axis. There are three major wind belts in each hemisphere.
Chapter 7 Earthquake Hazards Practice Exam and Study Guide
 Chapter 7 Earthquake Hazards Practice Exam and Study Guide 1. Select from the following list, all of the factors that affect the intensity of ground shaking. a. The magnitude of the earthquake b. Rather
Watershed Works Manual
 National Rural Employment Guarantee Act Watershed Works Manual DRAINAGE LINE TREATMENT: GABION STRUCTURE Baba Amte Centre for People s Empowerment Samaj Pragati Sahayog September 2006 Drainage Line Treatment:
Waves disturbances caused by the movement of energy from a source through some medium.
 Oceanography Chapter 10 Waves disturbances caused by the movement of energy from a source through some medium. Floating Gull- Figure 10.1 water is not moving only the energy is moving through the water.
3 LEVELLING & SURVEYING
 3 LEVELLING & SURVEYING 3.1 General The primary reference at water-level recording stations is a set of stable bench-marks, installed in locations where their level should not change. Upon initial set-up
SEAPRO has both foam filled flotation boom and inflatable boom systems.
 BOOMING OPERATIONS SEAPRO Response Operations Manual General Information Booming operations are necessary for the containment and concentration of spilled oil on water. By containing product, potential
Regents Questions: Plate Tectonics
 Earth Science Regents Questions: Plate Tectonics Name: Date: Period: August 2013 Due Date: 17 Compared to the oceanic crust, the continental crust is (1) less dense and more basaltic (3) more dense and
Damage Potential of Tropical Cyclone
 Damage Potential of Tropical Cyclone Regional Specialised Meteorological Centre (RSMC)- Tropical Cyclone, New Delhi Cyclone Warning Division India Meteorological Department Mausam Bhavan, Lodi Road, New
What Causes Climate? Use Target Reading Skills
 Climate and Climate Change Name Date Class Climate and Climate Change Guided Reading and Study What Causes Climate? This section describes factors that determine climate, or the average weather conditions
2. The map below shows high-pressure and low-pressure weather systems in the United States.
 1. Which weather instrument has most improved the accuracy of weather forecasts over the past 40 years? 1) thermometer 3) weather satellite 2) sling psychrometer 4) weather balloon 6. Wind velocity is
Using LIDAR to monitor beach changes: Goochs Beach, Kennebunk, Maine
 Geologic Site of the Month February, 2010 Using LIDAR to monitor beach changes: Goochs Beach, Kennebunk, Maine 43 o 20 51.31 N, 70 o 28 54.18 W Text by Peter Slovinsky, Department of Agriculture, Conservation
WEATHERING, EROSION, AND DEPOSITION PRACTICE TEST. Which graph best shows the relative stream velocities across the stream from A to B?
 NAME DATE WEATHERING, EROSION, AND DEPOSITION PRACTICE TEST 1. The diagram below shows a meandering stream. Measurements of stream velocity were taken along straight line AB. Which graph best shows the
The correct answers are given below. Some talking points have been added for the teachers use.
 Natural Resources Canada 2011: Lesson Plan Grades 11 and 12 Landslide activity 5b: Landslides in Canada quiz Description: This is an independent study activity for grades 11 and 12. Students will read
4.3.5 - Breakaway Walls
 4.3.5 - Breakaway Walls Elevation of a structure on a properly designed foundation reduces the potential for water damage from flooding. When the space below the lowest elevated floor is maintained free
Developing Ocean Energy in Ireland. Belmullet Wave Energy Test Site
 Developing Ocean Energy in Ireland Belmullet Wave Energy Test Site Where does our energy come from? Most of the energy we use in Ireland comes from fossil fuels such as oil, coal, peat and gas. We burn
Ride the Rock Cycle. Suggested Goals: Students will gain an understanding of how a rock can move through the different stages of the rock cycle.
 Illinois State Museum Geology Online http://geologyonline.museum.state.il.us Ride the Rock Cycle Grade Level: 5 6 Purpose: To teach students that the rock cycle, like the water cycle, has various stages
California Standards Grades 9 12 Boardworks 2009 Science Contents Standards Mapping
 California Standards Grades 912 Boardworks 2009 Science Contents Standards Mapping Earth Sciences Earth s Place in the Universe 1. Astronomy and planetary exploration reveal the solar system s structure,
Standard Operating Procedures for Flood Preparation and Response
 Standard Operating Procedures for Flood Preparation and Response General Discussion Hurricanes, tropical storms and intense thunderstorms support a conclusion that more severe flooding conditions than
Hurricanes. Characteristics of a Hurricane
 Hurricanes Readings: A&B Ch. 12 Topics 1. Characteristics 2. Location 3. Structure 4. Development a. Tropical Disturbance b. Tropical Depression c. Tropical Storm d. Hurricane e. Influences f. Path g.
The Mantas of Yap The Rhythm of the Tides Lesson Plan
 The Mantas of Yap The Rhythm of the Tides Lesson Plan In this episode, Jonathan travels to Yap, an island in the Pacific nation of Micronesia, to dive with giant Manta Rays. Manta Rays come to this area
Chapter 3 CULVERTS. Description. Importance to Maintenance & Water Quality. Culvert Profile
 Chapter 3 CULVERTS Description A culvert is a closed conduit used to convey water from one area to another, usually from one side of a road to the other side. Importance to Maintenance & Water Quality
Index. protection. excavated drop inlet protection (Temporary) 6.50.1 6.51.1. Block and gravel inlet Protection (Temporary) 6.52.1
 6.50.1 6.51.1. Block and gravel inlet Protection (Temporary) 6.52.1") 6 Index inlet protection excavated drop inlet protection (Temporary) 6.50.1 HARDWARE CLOTH AND GRAVEL INLET PROTECTION Block and gravel inlet Protection (Temporary) sod drop inlet protection ROCK DOUGHNUT
6 Index inlet protection excavated drop inlet protection (Temporary) 6.50.1 HARDWARE CLOTH AND GRAVEL INLET PROTECTION Block and gravel inlet Protection (Temporary) sod drop inlet protection ROCK DOUGHNUT
Earth Science Landforms, Weathering, and Erosion Reading Comprehension. Landforms, Weathering, and Erosion
 Reading Comprehension Name 1 How many people have been to the Rocky Mountains or the Grand Canyon? When people go to visit these natural wonders, they may not realize that it took millions of years for
ATS Overhead Table Shelf System INSTRUCTION MANUAL
 ATS Overhead Table Shelf System INSTRUCTION MANUAL ATS Overhead Table Shelf System Instruction Manual Warranty Newport Corporation warrants this product to be free of defects in material and workmanship
Which month has larger and smaller day time?
 ACTIVITY-1 Which month has larger and smaller day time? Problem: Which month has larger and smaller day time? Aim: Finding out which month has larger and smaller duration of day in the Year 2006. Format
50AI01oe 02/15. Labko GRP cesspools. Instructions for installation, operation and maintenance
 02/15 Labko GRP cesspools Instructions for installation, operation and maintenance Reliable solutions Wastewater treatment systems Contents 1 LABKO CESSPOOLS... 3 1.1 GENERAL... 3 1.2 IMPORTANT TO KNOW
environment briefing02
 PRODUCED BY THE SAFETY, HEALTH & ENVIRONMENT GROUP OF THE ENERGY NETWORKS ASSOCIATION - JULY 2006 environment briefing02 transporting electricity Overhead Lines or Underground Cables? Introduction The
Siting and settlement: The most important way to protect shelter from floods is to build in a place that is unlikely to be flooded.
 Siting and settlement: The most important way to protect shelter from floods is to build in a place that is unlikely to be flooded. Key Messages Shelters and settlements should be sited above the highest
Georgia Performance Standards Framework for Natural Disasters 6 th Grade
 The following instructional plan is part of a GaDOE collection of Unit Frameworks, Performance Tasks, examples of Student Work, and Teacher Commentary. Many more GaDOE approved instructional plans are
After reading this lesson you will be able to: 12.3 IMPORTANCE OF ROOF 12.4 TYPES OF ROOF IN A HOUSE
 86 :: Certificate in Construction Supervision (CIVIL) 12 ROOF 12.1 INTRODUCTION The structure provided to cover the house surface (floor) is known as roof. For different situation and requirement, it is
1. The diagram below shows a cross section of sedimentary rock layers.
 1. The diagram below shows a cross section of sedimentary rock layers. Which statement about the deposition of the sediments best explains why these layers have the curved shape shown? 1) Sediments were
Report Tidal Power Generation Systems
 The American University in Cairo Engineering Department ENGR 318 Spring 2001 Report Tidal Power Generation Systems Submitted to: Prof. Dr. Mahmoud Gilany By: Sherif Masoud Maher Amer Mohamed Samir Introduction
Cabinets 101: Configuring A Network Or Server Cabinet
 Cabinets 101: Configuring A Network Or Server Cabinet North, South and Central America White Paper May 2012 www.commscope.com Contents Background Information 3 What is a network or server cabinet? 3 What
Tidal theory 1. INTRODUCTION. Tides: The periodic vertical movement of water on the Earth s Surface (Admiralty Manual of Navigation)
") Tidal theory 1. INTRODUCTION Tides: The periodic vertical movement of water on the Earth s Surface (Admiralty Manual of Navigation) Tides are very often neglected or taken for granted, they are just the
Tidal theory 1. INTRODUCTION Tides: The periodic vertical movement of water on the Earth s Surface (Admiralty Manual of Navigation) Tides are very often neglected or taken for granted, they are just the
London Array. Operations and Maintenance
 London Array londonarray.com London Array Operations & Maintenance Base Port of Ramsgate Military Road Ramsgate CT11 9LG Registered in England and Wales No 04344423 Operations and Maintenance 1 2 Operations
Plate Tectonics: Ridges, Transform Faults and Subduction Zones
 Plate Tectonics: Ridges, Transform Faults and Subduction Zones Goals of this exercise: 1. review the major physiographic features of the ocean basins 2. investigate the creation of oceanic crust at mid-ocean
Solar System. 1. The diagram below represents a simple geocentric model. Which object is represented by the letter X?
 Solar System 1. The diagram below represents a simple geocentric model. Which object is represented by the letter X? A) Earth B) Sun C) Moon D) Polaris 2. Which object orbits Earth in both the Earth-centered
Communities, Biomes, and Ecosystems
 Communities, Biomes, and Ecosystems Before You Read Before you read the chapter, respond to these statements. 1. Write an A if you agree with the statement. 2. Write a D if you disagree with the statement.
Seasonal Temperature Variations
 Seasonal and Daily Temperatures Fig. 3-CO, p. 54 Seasonal Temperature Variations What causes the seasons What governs the seasons is the amount of solar radiation reaching the ground What two primary factors
Safe & Sound Bridge Terminology
 Safe & Sound Bridge Terminology Abutment A retaining wall supporting the ends of a bridge, and, in general, retaining or supporting the approach embankment. Approach The part of the bridge that carries
Emergency Spillways (Sediment basins)
") Emergency Spillways (Sediment basins) DRAINAGE CONTROL TECHNIQUE Low Gradient Velocity Control Short-Term Steep Gradient Channel Lining Medium-Long Term Outlet Control Soil Treatment Permanent [1] [1]
Emergency Spillways (Sediment basins) DRAINAGE CONTROL TECHNIQUE Low Gradient Velocity Control Short-Term Steep Gradient Channel Lining Medium-Long Term Outlet Control Soil Treatment Permanent [1] [1]
Anticyclones, depressions, hot & drought, cold & snow
 AS/A2-Level Geography Anticyclones, depressions, hot & drought, cold & snow Learning Objectives: To describe and explain the weather associated with high and low pressure systems and their links to extreme
UCCS ENSC/PES 2500: Renewable Energy Spring 2011 Test 3 name:
 UCCS ENSC/PES 2500: Renewable Energy Spring 2011 Test 3 name: 1. These waves travel through the body of the Earth and are called S waves. a. Transverse b. Longitudinal c. Amplitude d. Trough 2. These waves
2.0 BASIC CONCEPTS OF OPEN CHANNEL FLOW MEASUREMENT
 2.0 BASIC CONCEPTS OF OPEN CHANNEL FLOW MEASUREMENT Open channel flow is defined as flow in any channel where the liquid flows with a free surface. Open channel flow is not under pressure; gravity is the
Earth Coordinates & Grid Coordinate Systems
 Earth Coordinates & Grid Coordinate Systems How do we model the earth? Datums Datums mathematically describe the surface of the Earth. Accounts for mean sea level, topography, and gravity models. Projections
When considering Roof drainage design the following should be taken into account:
 Roof Drainage Design The primary objective of a gutter or spouting system is to remove water from the roof catchment area and channel that water to the ground drainage. Water ingress can have detrimental
RIPRAP From Massachusetts Erosion and Sediment Control Guidelines for Urban and Suburban Areas http://www.mass.gov/dep/water/laws/policies.
 RIPRAP From Massachusetts Erosion and Sediment Control Guidelines for Urban and Suburban Areas http://www.mass.gov/dep/water/laws/policies.htm#storm Definition: A permanent, erosion-resistant ground cover
Real-time Ocean Forecasting Needs at NCEP National Weather Service
 Real-time Ocean Forecasting Needs at NCEP National Weather Service D.B. Rao NCEP Environmental Modeling Center December, 2005 HYCOM Annual Meeting, Miami, FL COMMERCE ENVIRONMENT STATE/LOCAL PLANNING HEALTH
SECTION 15076 CEMENT-MORTAR LINED AND COATED STEEL PIPE
 SECTION 15076 CEMENT-MORTAR LINED AND COATED (CML&C) STEEL PIPE PART 1 GENERAL 1.01 DESCRIPTION This section designates the requirements for steel pipe fabrication, test in shop, installation of steel
There is no water, surface tension cracks, nor other environmental conditions present that reduce the stability of the excavation.
 Part 1926 Subpart P Introduction The Occupational Safety and Health Administration (OSHA) issued its first Excavation and Trenching Standard in 1971 to protect workers from excavation hazards. Since then,
BMP-7. A sediment filter or an excavated impounding area around a storm drain drop inlet or curb inlet.
 BMP-7 BMP: STORM DRAIN INLET PROTECTION Definition A sediment filter or an excavated impounding area around a storm drain drop inlet or curb inlet. To prevent sediment from entering storm drainage systems
STANDARD AND SPECIFICATIONS FOR STORM DRAIN INLET PROTECTION
 STANDARD AND SPECIFICATIONS FOR STORM DRAIN INLET PROTECTION Design Criteria Drainage Area The drainage area for storm drain inlets shall not exceed one acre. The crest elevations of these practices shall
HV Submarine Cable Systems Design, Testing and Installation
 HV Submarine Cable Systems Design, Testing and Installation CIGRE Ireland Technical Seminar 6 th October 2010 Robert Donaghy Senior Consultant Engineer, ESB International Presentation Overview Applications
ORANGE PUBLIC SCHOOLS OFFICE OF CURRICULUM AND INSTRUCTION OFFICE OF SCIENCE. GRADE 6 SCIENCE Post - Assessment
 ORANGE PUBLIC SCHOOLS OFFICE OF CURRICULUM AND INSTRUCTION OFFICE OF SCIENCE GRADE 6 SCIENCE Post - Assessment School Year 2013-2014 Directions for Grade 6 Post-Assessment The Grade 6 Post-Assessment is
skirt Appendix A Mechanical Containment and Cleanup Technologies Containment Booms
 Appendix A Mechanical Containment and Cleanup Technologies Containment Booms Oil spill containment barriers or booms are floating devices generally resembling short curtains that restrict an oil slick
New Brunswick s Flood Risk Reduction Strategy. Province of New Brunswick PO 6000, Fredericton NB E3B 5H1. www.gnb.ca
 New Brunswick s Flood Risk Reduction Strategy i New Brunswick s Flood Risk Reduction Strategy Province of New Brunswick PO 6000, Fredericton NB E3B 5H1 2014 www.gnb.ca ISBN 978-1-4605-0533-5 (print edition)
SECTION 6 SANITARY SEWER MAIN 6.01 SCOPE
 6.01 SCOPE The work covered by this section of the specifications consists of the furnishing of all plant, labor, materials, equipment and supervision and performing all operations involved in the construction
Natural Convection. Buoyancy force
 Natural Convection In natural convection, the fluid motion occurs by natural means such as buoyancy. Since the fluid velocity associated with natural convection is relatively low, the heat transfer coefficient
Storage Store the siding in a dry and ventilated area. Do not place it directly on the ground. Always cover the siding after a day s work.
 Installation Guide Before you begin, take the time to read this entire guide to clearly understand the requirements and steps to follow for proper installation. Warning Do not install defective material.
Residential Foundations and Basements
 Residential Foundations and Basements Disclaimer All of the following information is based on the 2006 International Residential Code with Kentucky Amendments. As some information is paraphrased, article
Free Stall Cleaner System with Cable. A new generation of equipment and systems. GEA Farm Equipment Houle
 Free Stall Cleaner System with Cable A new generation of equipment and systems GEA Farm Equipment Houle engineering for a better world GEA Farm Technologies SW Series Cable Drive Unit A new series of cable
6.E.2.2 Plate Tectonics, Earthquakes and Volcanoes
 Name: Date: 1. The road shown below was suddenly broken by a natural event. 3. The convergence of two continental plates would produce Which natural event most likely caused the crack in the road? island
Tsunami Practice Questions and Answers Revised November 2008
 Tsunami Practice Questions and Answers Revised November 2008 1. What happened on 26 December 2004 off the west coast of Sumatra? 2. What is the final estimate of the magnitude of the Sumatra 26 December
Ultracapacitors Double Operational Life Of Wave Measurement Buoys
 Ultracapacitors Double Operational Life Of Wave Measurement Buoys By Dennis van Weeren and Henny Joosten, Datawell BV, The Netherlands; Roger Scrivens, RS Aqua Ltd, UK, and Adrian Schneuwly,. Introduction
Conservation of Momentum Greg Kifer
 SCIENCE EXPERIMENTS ON FILE Revised Edition 6.7-1 Conservation of Momentum Greg Kifer Topic Conservation of momentum Time 1 hour! Safety Please click on the safety icon to view the safety precautions.
Solid shape molding is not desired in injection molding due to following reasons.
 PLASTICS PART DESIGN and MOULDABILITY Injection molding is popular manufacturing method because of its high-speed production capability. Performance of plastics part is limited by its properties which
IMPORTANT SAFETY RULES TO FOLLOW
 WARNING FLOOR & CARPET CLEANER Any piece of equipment can be dangerous if not operated properly. YOU are responsible for the safe operation of this equipment. The operator must carefully read and follow
foot skylight) is enough to knock a worker off their feet. A 10 mph wind gust on a 5 x 6 skylight develops a wind force of 270 lbs.
 is enough to knock a worker off their feet. A 10 mph wind gust on a 5 x 6 skylight develops a wind force of 270 lbs.") Skylight Installation Instructions This document provides instruction and guidelines for installation of both curb mount (CM) and self flashing (SF) unit skylights on flat, pitched (> or equal to 3/12
Skylight Installation Instructions This document provides instruction and guidelines for installation of both curb mount (CM) and self flashing (SF) unit skylights on flat, pitched (> or equal to 3/12
A discussion of condensate removal systems for clarifier and thickener drives for water and wastewater facilities.
 A discussion of condensate removal systems for clarifier and thickener drives for water and wastewater facilities. Richard L. Dornfeld, BSME, P.E. Staff Engineer September 25, 2014 Moisture can be a problem
Vibration Isolation in Data Centers
 Vibration Isolation in Data Centers Vibrations in Data Centers Vibrations in Data Centers can be produced by nearby construction works, heavy traffic, railways or even the own cooling units inside or next
WEATHERING, EROSION, and DEPOSITION REVIEW
 WEATHERING, EROSION, and DEPOSITION REVIEW Weathering: The breaking up of rock from large particles to smaller particles. a) This Increases surface area of the rock which speeds the rate of chemical weathering.
SERIES ASM NEOPRENE/EPMD FLANGED SINGLE SPHERE CONNECTOR CONNECTORS. Pressures to 225 PSIG (15.51 barg) Temperatures to 230ºF (110ºC)
 Temperatures to 230ºF (110ºC)") APPLICATIONS Process Industry Weak Acids Alkalies Compressed Air Pulp & Paper MODELS ASM - Flanged Connection OPTIONS Control Rods Oil & Gas Water & Waste Pump suction & discharge Sea water Chemical lines
APPLICATIONS Process Industry Weak Acids Alkalies Compressed Air Pulp & Paper MODELS ASM - Flanged Connection OPTIONS Control Rods Oil & Gas Water & Waste Pump suction & discharge Sea water Chemical lines
State Newton's second law of motion for a particle, defining carefully each term used.
 5 Question 1. [Marks 28] An unmarked police car P is, travelling at the legal speed limit, v P, on a straight section of highway. At time t = 0, the police car is overtaken by a car C, which is speeding
Foundation Experts, LLC Specializes in Foundation Repair and Waterproofing
 1 Most basements show some signs of leaking and cracking. Through the years, problems with water, poor soils, grading, drainage and possible settling affect the integrity of a basement. Being able to recognize
INSITU TESTS! Shear Vanes! Shear Vanes! Shear Vane Test! Sensitive Soils! Insitu testing is used for two reasons:!
 In-situ Testing! Insitu Testing! Insitu testing is used for two reasons:! To allow the determination of shear strength or penetration resistance or permeability of soils that would be difficult or impossible