GIS & Spatial Modeling
|
|
|
- Christiana West
- 7 years ago
- Views:
Transcription
1 Geography 4203 / 5203 GIS & Spatial Modeling Class 4: Raster Analysis I

2 Some Updates Readings discussions Reminder: Summaries!!! Submitted BEFORE discussion starts Labs next week: Start (delayed) of lab season as scheduled (M / W 9-11am)
 of lab")
3 Last Lecture We talked about raster data as one form of tesselation, their properties and important things you will find when working with them These facts are important to understand storage limitations, data types, bit depths and resolution-related problems In this context the assignment of pixel values in classifications or vector-raster conversions can become complex and is crucial

4 Last Class Meeting Right, and remember the last session which was a readings discussion about the field-object debate Take some impressions with you from this nice session - we did not come to an end (nobody ever did) Keep in mind the different conceptual model approaches and their counterparts in different disciplines Try to remember what the advantages of field representations are in modeling, error analysis and mapping

5 Today s Outline We will talk about some important basics of raster analysis and Map Algebra You will hear about the principles of Map Algebra as the foundation of GIS modeling framework We will talk about the single building blocks of this modeling language: operators, functions, parameters and objects This will give you an impression of the concepts behind it

6 Learning Objectives You will learn what Map Algebra stands for and what the single components are You will have insights into the functioning of Map Algebra You will understand what functions you are going to use, what an operator is and how to combine all elements for iterative models under control

7 Some Repitition
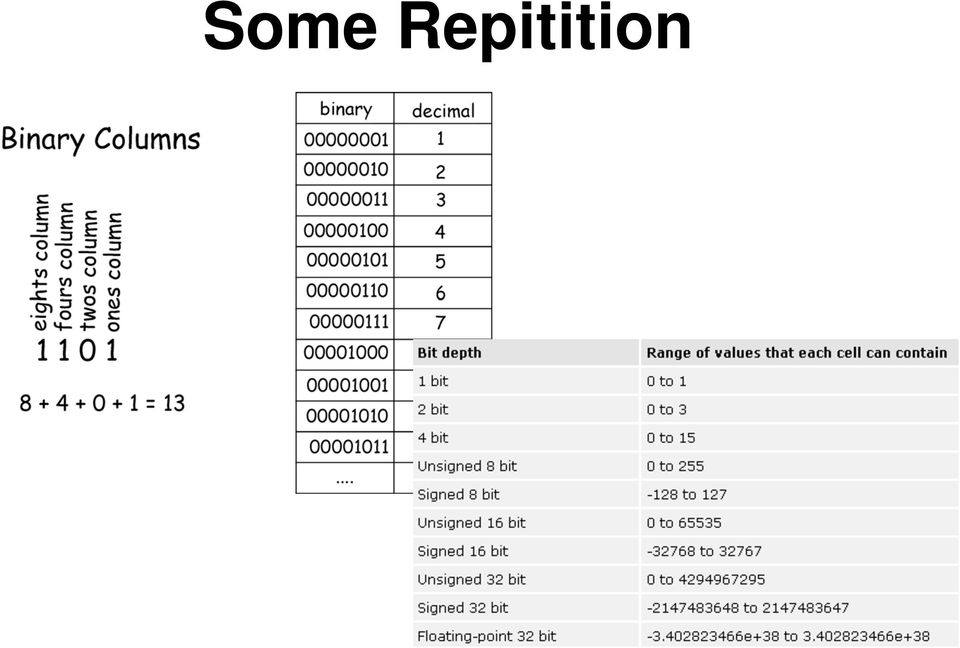
8

9 World Files for Georeferencing Information Some image formats store GI in a header of the image file (grids, img, GeoTIFF) Others use world (ASCII) files (.tfw) Origin of an image is ul (row values increase downward), of a coord system ll
 Origin of an image is ul (row values increase")
10 Critical Points in Working with Raster Data Noise, false colors, mixed colors Object separation / identification Neighborhoods for Morphology operators Assignment and coding Edges, contours and transitions between objects and background (blurring)

11 Raster and Raster Analysis Two-dimensional arrays organized in columns and rows as basis for efficient computation (translation into code) Making use of the simple and flexible data structure Fields, objects, regions, connected components, networks Developing and extending functionalities and operators MyRaster[row][col]

12 Understanding Raster Analysis To apply analysis tools is easy and straightforward Behind existing tools are complex algorithms implying mathematics, geometry and matrix operations between datasets and within regions of the same layer Thus a basic understanding of the concepts behind these tools is fundamental

13 Map Algebra Introduced by Dana Tomlin and Joseph Berry Cell-by-cell combination of raster data layers (addition, subtraction, multipl., ) Simple operations on numbers stored as values at raster cell locations Output grids with results at the cell locations corresponding to input cells

14 Map Algebra Operations Unary Operations Binary Operations Higher-order Operations

15 Map Algebra and Matrix Algebra One-to-one locational correspondence throughout all functions applied *, /, **, root are defined by the same rules of maintaining the one-to-one translation Matrix Algebra would apply rules for mathematical matrices (do you remember them?) If A is a 2x3 and B is a 3x2 matrix:

16 Why we are not doing Matrix Algebra So that is the special sense of Map Algebra: Position of individual grid cells corresponds to their position in geographic space (not in math matrices) Cell values are changed but not their position Intuitively easy to get but it is important to know these differences and why they exist

17 Raster-Related Problems Different extents and NoData values (the common or shared area?) Different raster cell sizes (how to define comb.) Misalignment of raster cells Resampling & Transformations
 Misalignment of raster cells Resampling &")
18 Map Algebra as Modeling Language Something like a modified version of Matrix Algebra, yes! But it can be seen as a complete modeling language (taken as standard for industry) Allows for program control, development and iteration + mathematical manipulation and logical operators of comparison and thus for the whole complexity of modeling Fuzzy logic as one example

19 Rules to be Followed E.g. in ESRI s Spatial Analyst Building blocks for Map Algebra language are: Objects - datasets, layers, values (as inputs or storage location) Actions - performed on objects; operators and functions (loc,foc,zon,glob) + application functions Qualifiers on the actions - parameters determining the conduction of a function
 + application functions")
20 Actions I: Basic Operators Computations within & between objects Remember NoData values Arithmetic (+,-,*,/,**,root,mod) Relational / Compare / Conditional (<,>,==,>=, ) Boolean / Logical (&&,,!, XOR) Combinatorial (and, or; unique identifiers not Boolean) Assignment (=) Accumulative (+=, -=, ) Logical (IN, DIFF, OVER)
 Combinatorial (and, or; unique identifiers not Boolean) Assignment (=)")
21 Actions II: Functions Spatial modeling tools for cell-based data Higher-order GIS operations Important building blocks for model implementation based on Map Algebra Parameter-dependent
22 Function Types in Map Algebra Local: cell-by-cell Neighborhood (Focal): neighborhood analysis Block: whole blocks of cells Zonal: within homogeneous areas, zonal analysis/statistics Global: incorporation of the full dataset Special types Uniform definition of entities in raster data
23 Local Functions Uniform cell size presumed for cell-by-cell analysis (ul start) Mathematical/arithmetic functions Logical operations Reclassification Nested functions Overlay in raster data sin(c\:temp\myraster)
24 Neighborhood (Focal) Functions Everyday needs in raster GIS (slope, aspect) Also neighborhoods uniform Cell is characterized/modified based on a predefined neighborhood of grid cells Focalsum([inlayer], rectangle, 3, 3) Neighborhoods and moving windows Blocks non-overlapping
25 Zonal Functions Zones identified from another layer for evaluation of the target cell Zones are geographic areas with certain characteristics (not necessarily connected such as regiongroups) Internal attribute homogeneity meangrid = zonalmean(zonalgrid,valuegrid) Statistics are written into each cell of a zone Blocks similar but predefined roving window corresponds to the zone
26 Global Functions Operate on the entire grid at once Each cell is a function of all input cells EucDistance, WeightDistance, Hydrological, Surface, Visibility, Viewshed, Max, eucdist( )
27 Further Functions We will see many specialized functions implemented in GIS tools Complex functions which integrate many of basic functions Hydrological functions Surface analysis
28 Flow Control Integral component of Map Algebra Command line framework / GUI as interface with the GIS user Composed of two elements (that work with operations and functions): Statements: verbal representation of operations to link operators, functions and programming commands Programs: notational representation of a procedure in Map Algebra; ordered sequence of statements
29 Iteration Repeated execution of the same sequence of statements under varying conditions or with other datasets or subsets or based on testing for conditions ( for looping, while looping ) Combined with if then logic Makes a modeling framework more powerful
30 ... Geoprocessing Framework in ArcGIS Tool dialog: Single tasks Command line Model-building: This is GIS2! Scripting/Programming: This is where we ll go in GIS3!
31 Graphical Modeling Framework Different Buffer distances for different features in different areas
32 How to Access Map Algebra Spatial Analyst: Raster Calculator Command line prompt in ArcGrid (going to be gone ) ArcToolbox: Single Output Map Algebra (for use in ModelBuilder) ArcToolbox: Multiple Output Map Algebra (for use in scripting)
33 More on Local Functions Basically the operators we have seen before are executed cell-by-cell Remember the handling with NoData values, 0-values and values unequal to zero Higher level operations based on local processing are reclassifications, nested functions and overlays trigonometric, exp., log., select, statistical,
34 Local Functions: Reclassifications Assigning output values that depend on the specific set of input values Based on a table, ranges of values (for automated reclassification) or conditional tests
35 Local Functions: Nested Functions Functions as arguments in other functions absvalues = ABS(Input) LogValues = LN(absValues) LogValues = LN(ABS(Input))
36 Local Functions: Overlay I Cell-by-cell comparison to register unique combinations of variables vectors of attributes given in a table (many to one relationships and extended rasters)
37 Local Functions: Overlay II Multiplication to mimic clip (extraction) using source and template layers (binary masks) Addition to mimic union (same id s for disjunct pixels with same characteristics through many-to-one rs. + ambiguous if same values out of different combinations) Combining zonal with overlay
38 More on Neighborhood Functions Often based on the concept of moving windows: Configuration of raster cells that is positioned over the input raster and defines the input for an operation to be applied. Result associated with center and written to the output. Window moves to the next location Much depends on the neighborhood Any ideas of functions that use NF?
39 Von Neumann Neighborhood Diamond-shaped To define a set of cells surrounding a given cell Ranges r = 0,1,2,3 N = 2*r(r+1)+1 centered square number
40 Moore Neighborhood Square-shaped To define a set of cells surrounding a given cell Ranges r = 0,1,2,3 N = (2r+1) 2 odd squares
41 Other Types of Neighborhood
42 The Principles of Moving Windows Left-to-right and top-to-bottom Dimensions: size of the neighborhood Odd-numbered in x and y to provide a natural center cell and square- or rectangular-shaped (or L or wedge or circular)
43 Examples for Moving Window NFs
44 Moving Windows and Kernels Set of constants for a given window size and shape Are applied with a function to every moving window location What can you see at the margins of the output grid?
45 Moving Windows and Margin Erosion Loss of margins in the original raster dataset: width of cells from the center cell away Solutions: (a) Enlargement of study areas (b) MW- and Kernel modification at corners (2x2; 1/4) and edges (2x3; 1/6)
46 Edge Detection Using Kernels Concentration changes; elevation changes, Discovering contrasts / differences within the local neighborhood
47 Noise Filtering Using Kernels Smoothing: Reducing differences between neighboring cells (mean Kernels / operators; low-pass filters) Noise: Errors in measurement, recording or transforming the data or due to data loss
48 High-Pass Filter Accentuates differences between adjacent cells in a moving window Identifying spikes (+ >>) and pits (- >>)
49 Mean Filtering Remove the spikes and pits identified by highpass filtering
50 Moving Windows and Spatial Covariance The more moving window operations / functions carried out the more related (autocorrelated) the cell values are Adjacent cells share six of nine cells in the local neighborhood for the computation
51 References Longley P.A., M. F. Goodchild, D. J. Maguire and D. W. Rhind Geographic Information Systems and Science. Second Edition. John Wiley, Chichester, Burrough, P.A. and McDonnell, R.A Principles of Geographical Information Systems. London: Oxford. Tomlin, C.D Cartographic Modeling. In Maguire, D., Goodchild, M.F., and Rhind, D. (Eds.) Geographic Information Systems: Principles and Applications. London: Longman: Tomlin, C.D An introduction to the Map analysis package. Proceedings. mnational Conference on Resource Management Applications: Energy and Environment, San Francisco. Pp
ANALYSIS 3 - RASTER What kinds of analysis can we do with GIS?
 ANALYSIS 3 - RASTER What kinds of analysis can we do with GIS? 1. Measurements 2. Layer statistics 3. Queries 4. Buffering (vector); Proximity (raster) 5. Filtering (raster) 6. Map overlay (layer on layer
Raster Data Structures
 Raster Data Structures Tessellation of Geographical Space Geographical space can be tessellated into sets of connected discrete units, which completely cover a flat surface. The units can be in any reasonable
Tutorial 8 Raster Data Analysis
 Objectives Tutorial 8 Raster Data Analysis This tutorial is designed to introduce you to a basic set of raster-based analyses including: 1. Displaying Digital Elevation Model (DEM) 2. Slope calculations
Lecture 3: Models of Spatial Information
 Lecture 3: Models of Spatial Information Introduction In the last lecture we discussed issues of cartography, particularly abstraction of real world objects into points, lines, and areas for use in maps.
GIS & Spatial Modeling
 Geography 4203 / 5203 GIS & Spatial Modeling Class 2: Spatial Doing - A discourse about analysis and modeling in a spatial context Updates Class homepage at: http://www.colorado.edu/geography/class_homepages/geog_4203
Geography 3251: Mountain Geography Assignment III: Natural hazards A Case Study of the 1980s Mt. St. Helens Eruption
 Name: Geography 3251: Mountain Geography Assignment III: Natural hazards A Case Study of the 1980s Mt. St. Helens Eruption Learning Objectives: Assigned: May 30, 2012 Due: June 1, 2012 @ 9 AM 1. Learn
GIS EXAM #2 QUERIES. Attribute queries only looks at the records in the attribute tables to some kind of
 GIS EXAM #2 QUERIES - Queries extracts particular records from a table or feature class for use; - Queries are an essential aspect of GIS analysis, and allows us to interrogate a dataset and look for patterns;
Raster Operations. Local, Neighborhood, and Zonal Approaches. Rebecca McLain Geography 575 Fall 2009. Raster Operations Overview
 Raster Operations Local, Neighborhood, and Zonal Approaches Rebecca McLain Geography 575 Fall 2009 Raster Operations Overview Local: Operations performed on a cell by cell basis Neighborhood: Operations
Geography 4203 / 5203. GIS Modeling. Class 12: Spatial Data Quality and Uncertainty
 Geography 4203 / 5203 GIS Modeling Class 12: Spatial Data Quality and Uncertainty Some Updates - Progress Reports Progress reports: 11 & 14 April (instead of 14 & 16 April) Class on 16 April: Jeremy Class
Raster: The Other GIS Data
 04-Raster_Tutorial_Arcgis_93.Doc Page 1 of 11 Raster: The Other GIS Data Objectives Understand the raster format and how it is used to model continuous geographic phenomena Understand how projections &
SPATIAL ANALYSIS IN GEOGRAPHICAL INFORMATION SYSTEMS. A DATA MODEL ORffiNTED APPROACH
 POSTER SESSIONS 247 SPATIAL ANALYSIS IN GEOGRAPHICAL INFORMATION SYSTEMS. A DATA MODEL ORffiNTED APPROACH Kirsi Artimo Helsinki University of Technology Department of Surveying Otakaari 1.02150 Espoo,
Representing Geography
 3 Representing Geography OVERVIEW This chapter introduces the concept of representation, or the construction of a digital model of some aspect of the Earth s surface. The geographic world is extremely
Objectives. Raster Data Discrete Classes. Spatial Information in Natural Resources FANR 3800. Review the raster data model
 Spatial Information in Natural Resources FANR 3800 Raster Analysis Objectives Review the raster data model Understand how raster analysis fundamentally differs from vector analysis Become familiar with
FOR375 EXAM #2 STUDY SESSION SPRING 2016. Lecture 14 Exam #2 Study Session
 FOR375 EXAM #2 STUDY SESSION SPRING 2016 Lecture 14 Exam #2 Study Session INTRODUCTION TO REMOTE SENSING TYPES OF REMOTE SENSING Ground based platforms Airborne based platforms Space based platforms TYPES
Understanding Raster Data
 Introduction The following document is intended to provide a basic understanding of raster data. Raster data layers (commonly referred to as grids) are the essential data layers used in all tools developed
SPATIAL DATA ANALYSIS
 SPATIAL DATA ANALYSIS P.L.N. Raju Geoinformatics Division Indian Institute of Remote Sensing, Dehra Dun Abstract : Spatial analysis is the vital part of GIS. Spatial analysis in GIS involves three types
Big Ideas in Mathematics
 Big Ideas in Mathematics which are important to all mathematics learning. (Adapted from the NCTM Curriculum Focal Points, 2006) The Mathematics Big Ideas are organized using the PA Mathematics Standards
INTRODUCTION TO ARCGIS SOFTWARE
 INTRODUCTION TO ARCGIS SOFTWARE I. History of Software Development a. Developer ESRI - Environmental Systems Research Institute, Inc., in 1969 as a privately held consulting firm that specialized in landuse
A HYBRID APPROACH FOR AUTOMATED AREA AGGREGATION
 A HYBRID APPROACH FOR AUTOMATED AREA AGGREGATION Zeshen Wang ESRI 380 NewYork Street Redlands CA 92373 Zwang@esri.com ABSTRACT Automated area aggregation, which is widely needed for mapping both natural
This is Geospatial Analysis II: Raster Data, chapter 8 from the book Geographic Information System Basics (index.html) (v. 1.0).
 (v. 1.0).") This is Geospatial Analysis II: Raster Data, chapter 8 from the book Geographic Information System Basics (index.html) (v. 1.0). This book is licensed under a Creative Commons by-nc-sa 3.0 (http://creativecommons.org/licenses/by-nc-sa/
This is Geospatial Analysis II: Raster Data, chapter 8 from the book Geographic Information System Basics (index.html) (v. 1.0). This book is licensed under a Creative Commons by-nc-sa 3.0 (http://creativecommons.org/licenses/by-nc-sa/
Introduction to GIS. http://libguides.mit.edu/gis
 Introduction to GIS http://libguides.mit.edu/gis 1 Overview What is GIS? Types of Data and Projections What can I do with GIS? Data Sources and Formats Software Data Management Tips 2 What is GIS? 3 Characteristics
Introduction to GIS (Basics, Data, Analysis) & Case Studies. 13 th May 2004. Content. What is GIS?
 & Case Studies. 13 th May 2004. Content. What is GIS?") Introduction to GIS (Basics, Data, Analysis) & Case Studies 13 th May 2004 Content Introduction to GIS Data concepts Data input Analysis Applications selected examples What is GIS? Geographic Information
Introduction to GIS (Basics, Data, Analysis) & Case Studies 13 th May 2004 Content Introduction to GIS Data concepts Data input Analysis Applications selected examples What is GIS? Geographic Information
Reading Questions. Lo and Yeung, 2007: 2 19. Schuurman, 2004: Chapter 1. 1. What distinguishes data from information? How are data represented?
 Reading Questions Week two Lo and Yeung, 2007: 2 19. Schuurman, 2004: Chapter 1. 1. What distinguishes data from information? How are data represented? 2. What sort of problems are GIS designed to solve?
A GIS helps you answer questions and solve problems by looking at your data in a way that is quickly understood and easily shared.
 A Geographic Information System (GIS) integrates hardware, software, and data for capturing, managing, analyzing, and displaying all forms of geographically referenced information. GIS allows us to view,
Introduction to Imagery and Raster Data in ArcGIS
 Esri International User Conference San Diego, California Technical Workshops July 25, 2012 Introduction to Imagery and Raster Data in ArcGIS Simon Woo slides Cody Benkelman - demos Overview of Presentation
How To Hydrologically Condition A Digital Dam
 Program: Funding: Conservation Applications of LiDAR Data http://tsp.umn.edu/lidar Environment and Natural Resources Trust Fund Module: Instructor: Hydrologic Applications Sean Vaughn, DNR GIS Hydrologist
Page 1 of 7 (document version 1)
") Lecture 2 - Data exploration This lecture will cover: Attribute queries Spatial queries Basic spatial analyses: Buffering Voronoi tessellation Cost paths / surfaces Viewsheds Hydrological modelling Autocorrelation
Lecture 2 - Data exploration This lecture will cover: Attribute queries Spatial queries Basic spatial analyses: Buffering Voronoi tessellation Cost paths / surfaces Viewsheds Hydrological modelling Autocorrelation
Create a folder on your network drive called DEM. This is where data for the first part of this lesson will be stored.
 In this lesson you will create a Digital Elevation Model (DEM). A DEM is a gridded array of elevations. In its raw form it is an ASCII, or text, file. First, you will interpolate elevations on a topographic
The Courses. Covering complete breadth of GIS technology from ESRI including ArcGIS, ArcGIS Server and ArcGIS Engine.
 ESRI India: Corporate profile ESRI India A profile India s Premier GIS Company Strategic alliance between ESRI Inc. and NIIT Technologies Adjudged as India s Best GIS Solutions Company - Map India 2001
Digital Imaging and Multimedia. Filters. Ahmed Elgammal Dept. of Computer Science Rutgers University
 Digital Imaging and Multimedia Filters Ahmed Elgammal Dept. of Computer Science Rutgers University Outlines What are Filters Linear Filters Convolution operation Properties of Linear Filters Application
Publishing Geoprocessing Services Tutorial
 Publishing Geoprocessing Services Tutorial Copyright 1995-2010 Esri All rights reserved. Table of Contents Tutorial: Publishing a geoprocessing service........................ 3 Copyright 1995-2010 ESRI,
3D Model of the City Using LiDAR and Visualization of Flood in Three-Dimension
 3D Model of the City Using LiDAR and Visualization of Flood in Three-Dimension R.Queen Suraajini, Department of Civil Engineering, College of Engineering Guindy, Anna University, India, suraa12@gmail.com
MAIN_SNP_TOPO.dgm_2m
 Seite 1 von 7 MAIN_SNP_TOPO.dgm_2m SDE Raster Dataset Tags dgm_2m, dgm_gr_snp, dgm1177bis1258, dtm4, lomb_dtm_20, dem2_5_apb, dhm10, dem20_apb, dsm2_voralberg, dsm10_tirol Summary There is no summary for
Spatial Analyst Tutorial
 Copyright 1995-2010 Esri All rights reserved. Table of Contents About the ArcGIS Spatial Analyst Tutorial......................... 3 Exercise 1: Preparing for analysis............................ 5 Exercise
Environmental Remote Sensing GEOG 2021
 Environmental Remote Sensing GEOG 2021 Lecture 4 Image classification 2 Purpose categorising data data abstraction / simplification data interpretation mapping for land cover mapping use land cover class
What do I do first in ArcView 8.x? When the program starts Select from the Dialog box: A new empty map
 www.library.carleton.ca/find/gis Introduction Introduction to Georeferenced Images using ArcGIS Georeferenced images such as aerial photographs or satellite images can be used in many ways in both GIS
NetCDF and HDF Data in ArcGIS
 2013 Esri International User Conference July 8 12, 2013 San Diego, California Technical Workshop NetCDF and HDF Data in ArcGIS Nawajish Noman Kevin Butler Esri UC2013. Technical Workshop. Outline NetCDF
Tutorial Creating a regular grid for point sampling
 This tutorial describes how to use the fishnet, clip, and optionally the buffer tools in ArcGIS 10 to generate a regularly-spaced grid of sampling points inside a polygon layer. The steps below should
GEOGRAPHIC INFORMATION SYSTEMS CERTIFICATION
 GEOGRAPHIC INFORMATION SYSTEMS CERTIFICATION GIS Syllabus - Version 1.2 January 2007 Copyright AICA-CEPIS 2009 1 Version 1 January 2007 GIS Certification Programme 1. Target The GIS certification is aimed
Programming Exercise 3: Multi-class Classification and Neural Networks
 Programming Exercise 3: Multi-class Classification and Neural Networks Machine Learning November 4, 2011 Introduction In this exercise, you will implement one-vs-all logistic regression and neural networks
A Method Using ArcMap to Create a Hydrologically conditioned Digital Elevation Model
 A Method Using ArcMap to Create a Hydrologically conditioned Digital Elevation Model High resolution topography derived from LiDAR data is becoming more readily available. This new data source of topography
Introduction to GIS. Dr F. Escobar, Assoc Prof G. Hunter, Assoc Prof I. Bishop, Dr A. Zerger Department of Geomatics, The University of Melbourne
 Introduction to GIS 1 Introduction to GIS http://www.sli.unimelb.edu.au/gisweb/ Dr F. Escobar, Assoc Prof G. Hunter, Assoc Prof I. Bishop, Dr A. Zerger Department of Geomatics, The University of Melbourne
What is GIS? Geographic Information Systems. Introduction to ArcGIS. GIS Maps Contain Layers. What Can You Do With GIS? Layers Can Contain Features
 What is GIS? Geographic Information Systems Introduction to ArcGIS A database system in which the organizing principle is explicitly SPATIAL For CPSC 178 Visualization: Data, Pixels, and Ideas. What Can
The UCC-21 cognitive skills that are listed above will be met via the following objectives.
 Master Syllabus Department of Geography GEOG 265: Introduction to Geographic Information Systems Course Description Fundamentals of geographic information systems (GIS). How to visualize geographic information
Institute of Natural Resources Departament of General Geology and Land use planning Work with a MAPS
 Institute of Natural Resources Departament of General Geology and Land use planning Work with a MAPS Lecturers: Berchuk V.Y. Gutareva N.Y. Contents: 1. Qgis; 2. General information; 3. Qgis desktop; 4.
Using CAD Data in ArcGIS
 Esri International User Conference San Diego, California Technical Workshops July 27, 2012 Using CAD Data in ArcGIS Jeff Reinhart & Phil Sanchez Agenda Overview of ArcGIS CAD Support Using CAD Datasets
CS1112 Spring 2014 Project 4. Objectives. 3 Pixelation for Identity Protection. due Thursday, 3/27, at 11pm
 CS1112 Spring 2014 Project 4 due Thursday, 3/27, at 11pm You must work either on your own or with one partner. If you work with a partner you must first register as a group in CMS and then submit your
ArcFuels Supplemental Material: GIS 9.x Tips and Tricks
 ArcFuels Supplemental Material: GIS 9.x Tips and Tricks Supplemental material: GIS Tips and Tricks... 1 Shapefiles: Points, Lines, and Polygons... 2 Creating a New Shapefile (point, line, or polygon)...
Advanced Image Management using the Mosaic Dataset
 Esri International User Conference San Diego, California Technical Workshops July 25, 2012 Advanced Image Management using the Mosaic Dataset Vinay Viswambharan, Mike Muller Agenda ArcGIS Image Management
ALGEBRA. sequence, term, nth term, consecutive, rule, relationship, generate, predict, continue increase, decrease finite, infinite
 ALGEBRA Pupils should be taught to: Generate and describe sequences As outcomes, Year 7 pupils should, for example: Use, read and write, spelling correctly: sequence, term, nth term, consecutive, rule,
Digital image processing
 746A27 Remote Sensing and GIS Lecture 4 Digital image processing Chandan Roy Guest Lecturer Department of Computer and Information Science Linköping University Digital Image Processing Most of the common
INSTRUCTIONS FOR MAKING 3D,.DWG CONTOUR LINES
 INSTRUCTIONS FOR MAKING 3D,.DWG CONTOUR LINES A TUTORIAL FROM SPATIAL AND NUMERIC DATA SERVICES NICOLE SCHOLTZ AND GEOFF IVERSON Overview... 2 A. Get a Digital Elevation Model (DEM)... 3 B. Open ArcMap,
Working with the Raster Calculator
 Working with the Raster Calculator The Raster Calculator provides you a powerful tool for performing multiple tasks. You can perform mathematical calculations using operators and functions, set up selection
LiDAR Point Cloud Processing with
 LiDAR Research Group, Uni Innsbruck LiDAR Point Cloud Processing with SAGA Volker Wichmann Wichmann, V.; Conrad, O.; Jochem, A.: GIS. In: Hamburger Beiträge zur Physischen Geographie und Landschaftsökologie
ESRI Technical Certification Overview. Amy Daniels Instructor, Greenville Tech
 ESRI Technical Certification Overview Amy Daniels Instructor, Greenville Tech Why have certification by ESRI? It communicates your proficiency in ESRI software Similar to Microsoft Certification, it can
SUMMER SCHOOL ON ADVANCES IN GIS
 SUMMER SCHOOL ON ADVANCES IN GIS Six Workshops Overview The workshop sequence at the UMD Center for Geospatial Information Science is designed to provide a comprehensive overview of current state-of-the-art
Lab 6: Distance and Density
 Lab 6: Distance and Density Exercise 1: Air Ambulance study The dispatch managers of local hospitals providing air ambulance service are working together with local schools and colleges to conduct a preliminary
What is Where? Getting Started With Geographic Information Systems Chapter 5
 What is Where? Getting Started With Geographic Information Systems Chapter 5 You can use a GIS to answer the question: What is where? WHAT: Characteristics of attributes or features WHERE: In geographic
THE OPEN DRAGON PROGRAMMER S TOOLKIT: A FRAMEWORK FOR LEARNING GEOINFORMATICS SOFTWARE DEVELOPMENT
 THE OPEN DRAGON PROGRAMMER S TOOLKIT: A FRAMEWORK FOR LEARNING GEOINFORMATICS SOFTWARE DEVELOPMENT Sally E. Goldin and Kurt T. Rudahl Department of Computer Engineering King Mongkut's University of Technology
Data source, type, and file naming convention
 Exercise 1: Basic visualization of LiDAR Digital Elevation Models using ArcGIS Introduction This exercise covers activities associated with basic visualization of LiDAR Digital Elevation Models using ArcGIS.
WESTMORELAND COUNTY PUBLIC SCHOOLS 2011 2012 Integrated Instructional Pacing Guide and Checklist Computer Math
 Textbook Correlation WESTMORELAND COUNTY PUBLIC SCHOOLS 2011 2012 Integrated Instructional Pacing Guide and Checklist Computer Math Following Directions Unit FIRST QUARTER AND SECOND QUARTER Logic Unit
Jose Valdez Doctoral Candidate Geomatics Program Department of Forest Sciences Colorado State University
 A N E F F I C I E N T A L G O R I T H M F O R R E C O N S T R U C T I N G A N I S O T R O P I C S P R E A D C O S T S U R F A C E S A F T E R M I N I M A L C H A N G E T O U N I T C O S T S T R U C T U
Image Processing and Computer Graphics. Rendering Pipeline. Matthias Teschner. Computer Science Department University of Freiburg
 Image Processing and Computer Graphics Rendering Pipeline Matthias Teschner Computer Science Department University of Freiburg Outline introduction rendering pipeline vertex processing primitive processing
Geographical Information Systems (GIS) and Economics 1
 and Economics 1") Geographical Information Systems (GIS) and Economics 1 Henry G. Overman (London School of Economics) 5 th January 2006 Abstract: Geographical Information Systems (GIS) are used for inputting, storing,
Geographical Information Systems (GIS) and Economics 1 Henry G. Overman (London School of Economics) 5 th January 2006 Abstract: Geographical Information Systems (GIS) are used for inputting, storing,
SCALABILITY OF CONTEXTUAL GENERALIZATION PROCESSING USING PARTITIONING AND PARALLELIZATION. Marc-Olivier Briat, Jean-Luc Monnot, Edith M.
 SCALABILITY OF CONTEXTUAL GENERALIZATION PROCESSING USING PARTITIONING AND PARALLELIZATION Abstract Marc-Olivier Briat, Jean-Luc Monnot, Edith M. Punt Esri, Redlands, California, USA mbriat@esri.com, jmonnot@esri.com,
0.75 75% ! 3 40% 0.65 65% Percent Cards. This problem gives you the chance to: relate fractions, decimals and percents
 Percent Cards This problem gives you the chance to: relate fractions, decimals and percents Mrs. Lopez makes sets of cards for her math class. All the cards in a set have the same value. Set A 3 4 0.75
Files Used in this Tutorial
 Generate Point Clouds Tutorial This tutorial shows how to generate point clouds from IKONOS satellite stereo imagery. You will view the point clouds in the ENVI LiDAR Viewer. The estimated time to complete
TWO-DIMENSIONAL TRANSFORMATION
 CHAPTER 2 TWO-DIMENSIONAL TRANSFORMATION 2.1 Introduction As stated earlier, Computer Aided Design consists of three components, namely, Design (Geometric Modeling), Analysis (FEA, etc), and Visualization
DELAWARE MATHEMATICS CONTENT STANDARDS GRADES 9-10. PAGE(S) WHERE TAUGHT (If submission is not a book, cite appropriate location(s))
 WHERE TAUGHT (If submission is not a book, cite appropriate location(s))") Prentice Hall University of Chicago School Mathematics Project: Advanced Algebra 2002 Delaware Mathematics Content Standards (Grades 9-10) STANDARD #1 Students will develop their ability to SOLVE PROBLEMS
Prentice Hall University of Chicago School Mathematics Project: Advanced Algebra 2002 Delaware Mathematics Content Standards (Grades 9-10) STANDARD #1 Students will develop their ability to SOLVE PROBLEMS
Lecture 9: Geometric map transformations. Cartographic Transformations
 Cartographic Transformations Analytical and Computer Cartography Lecture 9: Geometric Map Transformations Attribute Data (e.g. classification) Locational properties (e.g. projection) Graphics (e.g. symbolization)
Pocantico Hills School District Grade 1 Math Curriculum Draft
 Pocantico Hills School District Grade 1 Math Curriculum Draft Patterns /Number Sense/Statistics Content Strands: Performance Indicators 1.A.1 Determine and discuss patterns in arithmetic (what comes next
Digital Terrain Model Grid Width 10 m DGM10
 Digital Terrain Model Grid Width 10 m Status of documentation: 23.02.2015 Seite 1 Contents page 1 Overview of dataset 3 2 Description of the dataset contents 4 3 Data volume 4 4 Description of the data
Government 1009: Advanced Geographical Information Systems Workshop. LAB EXERCISE 3b: Network
 Government 1009: Advanced Geographical Information Systems Workshop LAB EXERCISE 3b: Network Objective: Using the Network Analyst in ArcGIS Implementing a network functionality as a model In this exercise,
STATISTICS AND DATA ANALYSIS IN GEOLOGY, 3rd ed. Clarificationof zonationprocedure described onpp. 238-239
 STATISTICS AND DATA ANALYSIS IN GEOLOGY, 3rd ed. by John C. Davis Clarificationof zonationprocedure described onpp. 38-39 Because the notation used in this section (Eqs. 4.8 through 4.84) is inconsistent
Binary Adders: Half Adders and Full Adders
 Binary Adders: Half Adders and Full Adders In this set of slides, we present the two basic types of adders: 1. Half adders, and 2. Full adders. Each type of adder functions to add two binary bits. In order
KITES TECHNOLOGY COURSE MODULE (C, C++, DS)
") KITES TECHNOLOGY 360 Degree Solution www.kitestechnology.com/academy.php info@kitestechnology.com technologykites@gmail.com Contact: - 8961334776 9433759247 9830639522.NET JAVA WEB DESIGN PHP SQL, PL/SQL
KITES TECHNOLOGY 360 Degree Solution www.kitestechnology.com/academy.php info@kitestechnology.com technologykites@gmail.com Contact: - 8961334776 9433759247 9830639522.NET JAVA WEB DESIGN PHP SQL, PL/SQL
Spatial data analysis: retrieval, (re)classification and measurement operations
classification and measurement operations") CHAPTER 7 Spatial data analysis: retrieval, (re)classification and measurement operations In chapter 5 you used a number of table window operations, such as calculations, aggregations, and table joining,
CHAPTER 7 Spatial data analysis: retrieval, (re)classification and measurement operations In chapter 5 you used a number of table window operations, such as calculations, aggregations, and table joining,
University of Arkansas Libraries ArcGIS Desktop Tutorial. Section 5: Analyzing Spatial Data. Buffering Features:
 : Analyzing Spatial Data Buffering Features: A buffer operation is one of the most common spatial analysis tools. A buffer is a map feature that represents a uniform distance around a feature. When creating
GEOGRAPHIC INFORMATION SYSTEMS Lecture 20: Adding and Creating Data
 Adding Existing Data Into ArcGIS - there are many different ways to get data into ArcGIS GEOGRAPHIC INFORMATION SYSTEMS Lecture 20: Adding and Creating Data Add Data - normally we use the Add Data button
CHAPTER 8 FACTOR EXTRACTION BY MATRIX FACTORING TECHNIQUES. From Exploratory Factor Analysis Ledyard R Tucker and Robert C.
 CHAPTER 8 FACTOR EXTRACTION BY MATRIX FACTORING TECHNIQUES From Exploratory Factor Analysis Ledyard R Tucker and Robert C MacCallum 1997 180 CHAPTER 8 FACTOR EXTRACTION BY MATRIX FACTORING TECHNIQUES In
ArcGIS 3: Performing Analysis. Student Edition
 ArcGIS 3: Performing Analysis Student Edition Copyright 2016 Esri All rights reserved. Course version 4.0. Version release date March 2016. Printed in the United States of America. The information contained
http://www.aleks.com Access Code: RVAE4-EGKVN Financial Aid Code: 6A9DB-DEE3B-74F51-57304
 MATH 1340.04 College Algebra Location: MAGC 2.202 Meeting day(s): TR 7:45a 9:00a, Instructor Information Name: Virgil Pierce Email: piercevu@utpa.edu Phone: 665.3535 Teaching Assistant Name: Indalecio
Integer Operations. Overview. Grade 7 Mathematics, Quarter 1, Unit 1.1. Number of Instructional Days: 15 (1 day = 45 minutes) Essential Questions
 Essential Questions") Grade 7 Mathematics, Quarter 1, Unit 1.1 Integer Operations Overview Number of Instructional Days: 15 (1 day = 45 minutes) Content to Be Learned Describe situations in which opposites combine to make zero.
Grade 7 Mathematics, Quarter 1, Unit 1.1 Integer Operations Overview Number of Instructional Days: 15 (1 day = 45 minutes) Content to Be Learned Describe situations in which opposites combine to make zero.
Grade 5 Math Content 1
 Grade 5 Math Content 1 Number and Operations: Whole Numbers Multiplication and Division In Grade 5, students consolidate their understanding of the computational strategies they use for multiplication.
Geographic Information Systems. ASM 215 Feb 2013 Larry Theller
 Geographic Information Systems ASM 215 Feb 2013 Larry Theller Schedule Wednesday GIS lecture Disc of homework Lab Thursday GPS Feb 28 Lab ABE 105 or 116 computer labs GIS Lecture today History Software
Introduction to Computer Graphics
 Introduction to Computer Graphics Torsten Möller TASC 8021 778-782-2215 torsten@sfu.ca www.cs.sfu.ca/~torsten Today What is computer graphics? Contents of this course Syllabus Overview of course topics
An Introduction to Point Pattern Analysis using CrimeStat
 Introduction An Introduction to Point Pattern Analysis using CrimeStat Luc Anselin Spatial Analysis Laboratory Department of Agricultural and Consumer Economics University of Illinois, Urbana-Champaign
LSA SAF products: files and formats
 LSA SAF products: files and formats Carla Barroso, IPMA Application of Remote Sensing Data for Drought Monitoring Introduction to Eumetsat LANDSAF Products 11-15 November Slovenia OUTLINE Where to get
1. Classification problems
 Neural and Evolutionary Computing. Lab 1: Classification problems Machine Learning test data repository Weka data mining platform Introduction Scilab 1. Classification problems The main aim of a classification
Thomas Jefferson High School for Science and Technology Program of Studies Foundations of Computer Science. Unit of Study / Textbook Correlation
 Thomas Jefferson High School for Science and Technology Program of Studies Foundations of Computer Science updated 03/08/2012 Unit 1: JKarel 8 weeks http://www.fcps.edu/is/pos/documents/hs/compsci.htm
The following is an overview of lessons included in the tutorial.
 Chapter 2 Tutorial Tutorial Introduction This tutorial is designed to introduce you to some of Surfer's basic features. After you have completed the tutorial, you should be able to begin creating your
GIS. Digital Humanities Boot Camp Series
 GIS Digital Humanities Boot Camp Series GIS Fundamentals GIS Fundamentals Definition of GIS A geographic information system (GIS) is used to describe and characterize spatial data for the purpose of visualizing
USING SELF-ORGANIZING MAPS FOR INFORMATION VISUALIZATION AND KNOWLEDGE DISCOVERY IN COMPLEX GEOSPATIAL DATASETS
 USING SELF-ORGANIZING MAPS FOR INFORMATION VISUALIZATION AND KNOWLEDGE DISCOVERY IN COMPLEX GEOSPATIAL DATASETS Koua, E.L. International Institute for Geo-Information Science and Earth Observation (ITC).
ES341 Overview of key file formats and file extensions in ArcGIS
 ES341 Overview of key file formats and file extensions in ArcGIS Commonly Encountered File Types/Extensions in ArcGIS.mxd A file containing a map, its layers, display information, and other elements used
Solving Simultaneous Equations and Matrices
 Solving Simultaneous Equations and Matrices The following represents a systematic investigation for the steps used to solve two simultaneous linear equations in two unknowns. The motivation for considering
Comparison of Programs for Fixed Kernel Home Range Analysis
 1 of 7 5/13/2007 10:16 PM Comparison of Programs for Fixed Kernel Home Range Analysis By Brian R. Mitchell Adjunct Assistant Professor Rubenstein School of Environment and Natural Resources University
University of Arkansas Libraries ArcGIS Desktop Tutorial. Section 4: Preparing Data for Analysis
 : Preparing Data for Analysis When a user acquires a particular data set of interest, it is rarely in the exact form that is needed during analysis. This tutorial describes how to change the data to make
METHODS OF GEOREFERENCING OLD MAPS ON THE EXAMPLE OF CZECH EARLY MAPS
 CO-314 METHODS OF GEOREFERENCING OLD MAPS ON THE EXAMPLE OF CZECH EARLY MAPS CAJTHAML J. Czech Technical University in Prague, PRAGUE 6, CZECH REPUBLIC BACKGROUND AND OBJECTIVES Old maps are unique source
AUTOMATION OF ENERGY DEMAND FORECASTING. Sanzad Siddique, B.S.
 AUTOMATION OF ENERGY DEMAND FORECASTING by Sanzad Siddique, B.S. A Thesis submitted to the Faculty of the Graduate School, Marquette University, in Partial Fulfillment of the Requirements for the Degree