University of Arkansas Libraries ArcGIS Desktop Tutorial. Section 5: Analyzing Spatial Data. Buffering Features:
|
|
|
- Jasper Neal
- 10 years ago
- Views:
Transcription
1 : Analyzing Spatial Data Buffering Features: A buffer operation is one of the most common spatial analysis tools. A buffer is a map feature that represents a uniform distance around a feature. When creating a buffer, the user selects the feature to buffer from, as well as the distance to be buffered. The buffer operation creates a new polygon data set, where a specified distance is drawn around specific features within a layer. The distances can either be constant or can vary depending upon attribute values. When features are close together, their buffers may overlap. The user can choose to preserve the overlaps or remove them. To use the ArcToolbox Buffer tool, the user must go to Analysis Tools and select Proximity. Buffer then appears in the list of tools. A double click on Buffer results in the appearance of the Buffer dialog box. The drop down arrow should be clicked, or the browse button used, to select the layer the user wishes to buffer. Then, the Linear unit radio button should be clicked and units and distance specified. If the user wishes to dissolve the barriers between any overlapping buffers he or she may do so by selecting LIST from the drop down menu within Dissolve Type. Once the list of attribute fields appears with a white background the box next to Shape should be checked. Page 1

2 If the user wants to create a buffer around an input feature he or she may specify a value as illustrated above or a numeric field in the attribute table can be specified using the Field radio button. The OK button should be clicked once all parameters have been set. The buffer will be created and added to the ArcMap display if ArcToolbox was opened through ArcMap. Once a buffer has been created the user may want to add the buffer distance to the new layer's attribute table. This can be done by right clicking on the layer name in the table of contents and selecting Open Attribute Table. Once the attribute table opens, the Options button should be clicked. The user should then select the Add Field option. Page 2

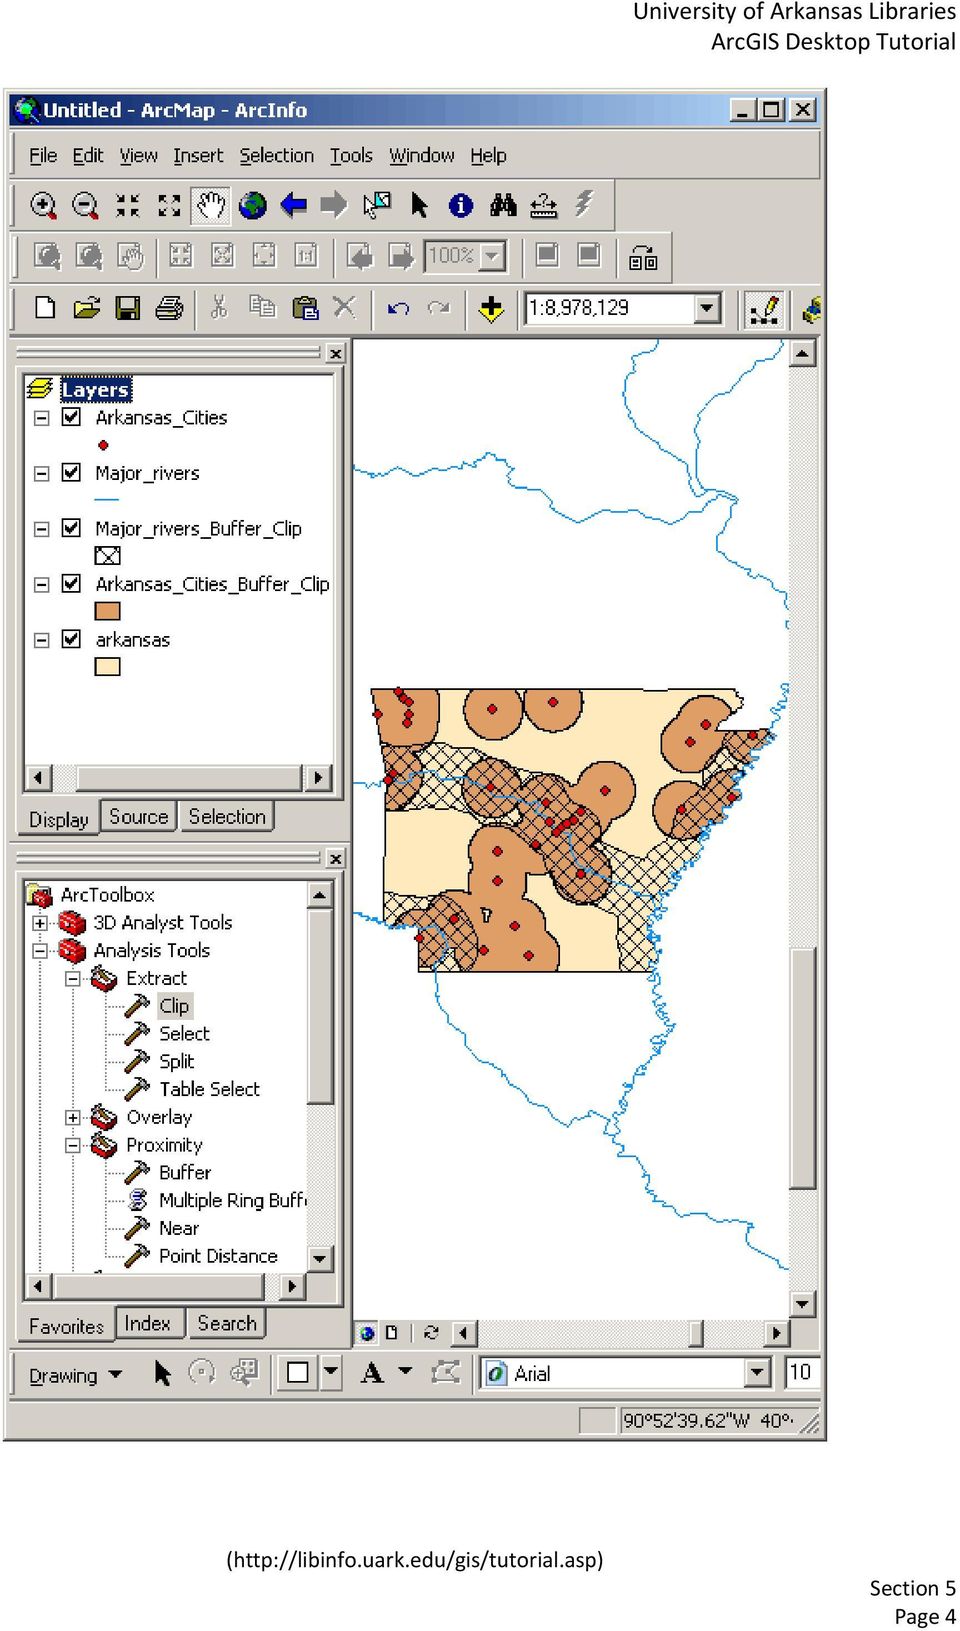
3 When the Add Field Dialog Box appears, the user must type in the name of the new field, select the type of attribute that will be added to the field, and click OK. In the above, a new field was created called "BufferDist" that will contain numeric data, in this case "25" for 25 miles buffer distance. Once a new field has been created the user can place values in the cells under "BufferDist" by going to Tools on the main menu and selecting Editor Toolbar followed by Editor on the toolbar and then Start Editing. With this preparation the contents of cells in an attribute table may be edited simply by placing the cursor in the cell(s) and typing in this case the cell underneath the newly created "BufferDist" field had "25" placed in it for 25 miles. Closing the editing session is done by going back to Editor, selecting Save Edits, then Stop Editing. In the following illustrations a 25 mile buffer around cities in Arkansas is represented along with a 25 mile buffer around the major rivers. Note: the actual buffers extended beyond the boundary of Arkansas. The buffers shown below were clipped with the Arkansas layer in order to display only the areas within Arkansas that were within 25 miles of a city and all areas within 25 miles of a major river. Page 3

4 Page 4
5 Overlaying Data: An overlay operation is also one of the most common spatial analysis tools. Overlays allow the user to identify areas where features in two layers overlap. A new data set is often created from these overlaps. In a Union Overlay, all features are included in the new data set but the features that overlap represent a new feature. In an intersect overlay, only the areas that overlap are contained in the new data set. Union Overlay: The union overlay option may be very useful if the user wishes to combine data layers into one layer. For example, if the user does not wish to build a house with close proximity to a stream or a railroad, the user could create a buffer area that represents close proximity to a stream. The user could do the same for the railroad layer. Last, the user could union the two buffers. The final result would represent all areas the user does NOT wish to build a house. To perform a union overlay, the user must go to ArcToolbox's Analysis Tools, select Overlay, and then click Union. The user then specifies the input layers to union and a name for the output data set. Page 5

6 Again, once the OK button has been clicked, the result will be added to the ArcMap display should ArcToolbox have been used through ArcMap. The attribute table for the union layer will contain the attributes present in both input layers. In the following example an Arkansas city buffer of 25 miles and an Arkansas' major rivers buffer of 25 miles were created to represent suitable areas in which to locate a transportation terminal. These two buffers were unioned in order to represent all areas that fall within either buffer. This operation represents the Boolean OR operation. Page 6

7 Page 7

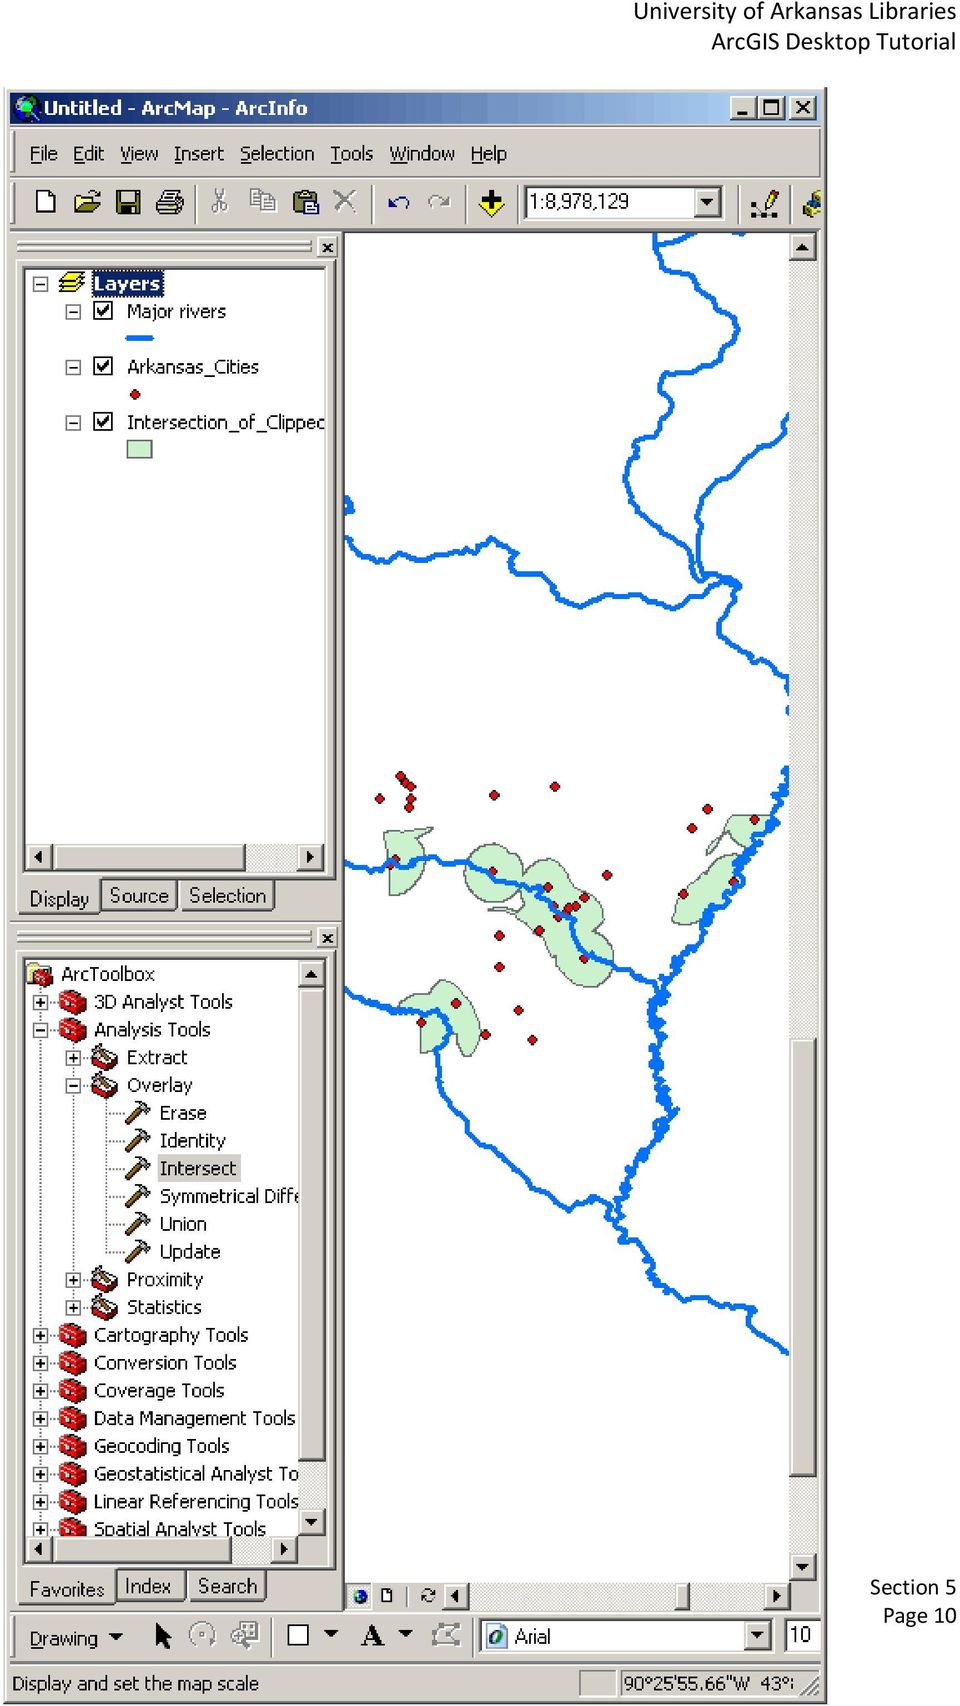
8 Intersect Overlay: To perform an intersect overlay, the user must go to Analysis Tools in ArcToolbox and click on Overlay. From the list of Overlay tools double click on Intersect. The user is prompted to select the input features for intersection and the output feature class. In the above union overlay example, the output shows where at least one of the buffer criteria have been met. A more restrictive overlay is to find the places where BOTH criteria occur in the same place. This is otherwise known as the Boolean AND operation. The following shows the process to determine the places that are within 25 miles of an Arkansas city AND within 25 miles of a major Arkansas river. The OK button should be clicked. The result is automatically displayed in ArcMap if ArcMap was used to access ArcToolbox. In the above union overlay example, the output shows where at least one of the buffer criteria have been met. A more restrictive overlay is to find the places where BOTH criteria occur Page 8

9 in the same place. This is otherwise known as the Boolean AND operation. The following shows the places that are within 25 miles of an Arkansas city AND within 25 miles of a major Arkansas river. Page 9

10 Page 10
11 Calculating Attribute Values: Using ArcMap, the user is capable of calculating new values within a layer's attribute table. The calculation can be performed on all records in a table or selected records only. The calculated values can either be text or numeric. Using a Union Overlay of the above city buffer, river buffer, and the Arkansas State boundary, the following section will explain how to perform attribute queries within the unioned layer. More specifically, the areas that fall within BOTH buffers will be named "suitable" in the attribute table. The features that only contain one or none of the buffer criteria, will be named "unsuitable." Page 11

12 To begin, a new field should be created in the "union" layer's attribute table using the procedure described earlier in this section. In this case, a new field was created called "Suitability" (since it will Page 12

13 describe whether or not the feature is suitable, or falls within BOTH buffers). The type of field was text, since the user will either enter in the words "suitable" or "unsuitable". The following shows the field after it was added to the attribute table. Now that a new field has been created, the user must perform queries so that attributes can be calculated based on those queries. To do this, the user must double click on the layer name in the table of contents. When the Layer Properties dialog box appears, the user should click the Definition Query tab. Next, the Query Builder... button should be clicked. The Query Builder dialog box will appear. Page 13

14 Using this dialog the user can build a query that will display only the areas contained within BOTH buffers. This can be found by querying out the features where BufferDist = 30 AND BufferDi_1= 30. These are the fields that contain the city and the river buffer information. The value of 0 in either field means that the feature is NOT within 30 miles of a city or stream. The value of 30 means that the feature IS within 30 miles of the city or stream. In the Fields box, the "BufferDist" field should be double clicked in order for it to be added to the expression box. Next, the equals (=) button should be clicked. In the Unique Values box, 30 should be double clicked. Next, the AND button should be clicked and the "BufferDi_1" field should be added to the expression box. The equals (=) button should once again be pressed, and the value of 30 should again be double clicked. The dialog box should look like the following graphic. Page 14
 button should be clicked. In the Unique Values box, 30 should be double clicked.")
15 When the OK button is clicked, the expression will be added to the Definition Query box. Page 15

16 Next, the OK button should be clicked. Only the features that meet both buffer criteria will be displayed in the Map Display. Page 16

17 Next, the user should right click on the layer name and click Open Attribute Table. The table will only contain those fields that meet the query criteria. Page 17

18 The value "suitable" can now be added to all the records within the Suitability field (since only the "suitable" records are displayed). This can be done by right clicking on the field name "Suitability" and clicking the Calculate Values option. NOTE: A message box will appear that informs the user they are about to make changes to a table outside an editing session. When the user clicks Yes, the Field Calculator dialog opens. Within this dialog, the user must enter the desired attribute to be added to all of the suitable records. In this case, the user must type "suitable", and press OK. Page 18

19 The attribute table will be automatically updated. In order to label all of the other attribute fields "unsuitable", a new query must be built. The following query was built. Page 19

20 When the OK button was clicked, the following result was displayed. Page 20

21 Page 21
22 Once the attributes for the above selection were labeled "unsuitable" in the Suitability Field, all queries were cleared. The attribute table for the entire layer was displayed, and both suitability values appeared. Page 22
University of Arkansas Libraries ArcGIS Desktop Tutorial. Section 4: Preparing Data for Analysis
 : Preparing Data for Analysis When a user acquires a particular data set of interest, it is rarely in the exact form that is needed during analysis. This tutorial describes how to change the data to make
1. Launch ArcCatalog, then navigate to the following location using the directory tree on the left side of the screen:
 Vector Data Analysis I: Buffering Today we will use ArcMap and ArcToolbox to manipulate vector-based geographic data. The results of these simple analyses will allow us to visualize complex spatial relationships.
Raster to Vector Conversion for Overlay Analysis
 Raster to Vector Conversion for Overlay Analysis In some cases, it may be necessary to perform vector-based analyses on a raster data set, or vice versa. The types of analyses that can be performed on
ESRI China (Hong Kong) Limited
 Limited") Tips for Creating 3D Graphics in ArcScene 9.x Article ID : 100003 Software : ArcGIS 3D Analyst 9.x Platform : Windows 2000, Windows XP Date : June 28, 2005 Background Prior to ArcGIS Desktop 9.0, we cannot
Tips for Creating 3D Graphics in ArcScene 9.x Article ID : 100003 Software : ArcGIS 3D Analyst 9.x Platform : Windows 2000, Windows XP Date : June 28, 2005 Background Prior to ArcGIS Desktop 9.0, we cannot
Government 1009: Advanced Geographical Information Systems Workshop. LAB EXERCISE 3b: Network
 Government 1009: Advanced Geographical Information Systems Workshop LAB EXERCISE 3b: Network Objective: Using the Network Analyst in ArcGIS Implementing a network functionality as a model In this exercise,
Cookbook for Importing Point Information into a Polygon Shapefile using ArcGIS9
 Cookbook for Importing Point Information into a Polygon Shapefile using ArcGIS9 I. Create a Master polygon shapefile. In addition to the FID field this shapefile must have a field containing a unique ID
Knowledgebase Article
 Company web site: Support email: Support telephone: +44 20 3287-7651 +1 646 233-1163 2 EMCO Network Inventory 5 provides a built in SQL Query builder that allows you to build more comprehensive
Geography 3251: Mountain Geography Assignment III: Natural hazards A Case Study of the 1980s Mt. St. Helens Eruption
 Name: Geography 3251: Mountain Geography Assignment III: Natural hazards A Case Study of the 1980s Mt. St. Helens Eruption Learning Objectives: Assigned: May 30, 2012 Due: June 1, 2012 @ 9 AM 1. Learn
Microsoft Access Rollup Procedure for Microsoft Office 2007. 2. Click on Blank Database and name it something appropriate.
 Microsoft Access Rollup Procedure for Microsoft Office 2007 Note: You will need tax form information in an existing Excel spreadsheet prior to beginning this tutorial. 1. Start Microsoft access 2007. 2.
Government 1008: Introduction to Geographic Information Systems. LAB EXERCISE 4: Got Database?
 Government 1008: Introduction to Geographic Information Systems Objectives: Creating geodatabases Joining attribute tables Attribute and location based queries Spatial joins Creating spatial and attribute
RS/GIS Quick Start Guides Collaborative training materials available from the Biodiversity Informatics & Geospatial Innovation Facilities
 http://gif.berkeley.edu Collaborative training materials available from the Biodiversity Informatics & Geospatial Innovation Facilities http://biodiversityinformatics.amnh.org Using the ArcMap model builder
University of Arkansas Libraries ArcGIS Desktop Tutorial. Section 2: Manipulating Display Parameters in ArcMap. Symbolizing Features and Rasters:
 : Manipulating Display Parameters in ArcMap Symbolizing Features and Rasters: Data sets that are added to ArcMap a default symbology. The user can change the default symbology for their features (point,
RightFax FaxUtil. Quick reference guide to getting started. Note: This document applies to OpenText RightFax version 10.0
 RightFax FaxUtil Quick reference guide to getting started Note: This document applies to OpenText RightFax version 10.0 Contents OpenText RightFax FaxUtil 2 RightFax FaxUtil... 1 Contents... 2 Creating
Linking FLIPS to a GIS Shapefile
 Linking FLIPS to a GIS Shapefile User s Guide Atterbury Consultants, Inc. 3800 SW Cedar Hills Blvd. Suite 145 Beaverton, Oregon 97005 503-646-5393 Phone 503-644-1683 Fax www.atterbury.com Table of Contents
Adding a File Attachment to a CFS Requisition
 Adding a File Attachment to a CFS Requisition When creating a requisition, there are certain purchases that may require additional documentation. The Attachment feature is used to attach this documentation.
Tutorial Creating a regular grid for point sampling
 This tutorial describes how to use the fishnet, clip, and optionally the buffer tools in ArcGIS 10 to generate a regularly-spaced grid of sampling points inside a polygon layer. The steps below should
ModelBuilder - Creating Tools Tutorial
 ModelBuilder - Creating Tools Tutorial Copyright 1995-2010 Esri All rights reserved. Table of Contents Tutorial: Creating tools with ModelBuilder......................... 3 Copyright 1995-2010 Esri. All
What is GIS? Geographic Information Systems. Introduction to ArcGIS. GIS Maps Contain Layers. What Can You Do With GIS? Layers Can Contain Features
 What is GIS? Geographic Information Systems Introduction to ArcGIS A database system in which the organizing principle is explicitly SPATIAL For CPSC 178 Visualization: Data, Pixels, and Ideas. What Can
Personal Geodatabase 101
 Personal Geodatabase 101 There are a variety of file formats that can be used within the ArcGIS software. Two file formats, the shape file and the personal geodatabase were designed to hold geographic
Spatial Adjustment Tools: The Tutorial
 Spatial Adjustment Tools: The Tutorial By Peter Kasianchuk, ESRI Educational Services In this exercise, you will perform some spatial adjustment and data management operations data to be used in analysis
INTRODUCTION to ESRI ARCGIS For Visualization, CPSC 178
 INTRODUCTION to ESRI ARCGIS For Visualization, CPSC 178 1) Navigate to the C:/temp folder 2) Make a directory using your initials. 3) Use your web browser to navigate to www.library.yale.edu/mapcoll/ and
GIS II: Data Management: Creation, edition and maintenance of geographic data Module 1: Leveraging the where of your geographic data
 *** Files needed for exercise: MT_ACS09_trt.shp, and McDonalds_rr.shp Goals: After completing this exercise, you will have experience in performing spatial joins and selections and reviewed your understanding
Getting Started with the ArcGIS Predictive Analysis Add-In
 Getting Started with the ArcGIS Predictive Analysis Add-In Table of Contents ArcGIS Predictive Analysis Add-In....................................... 3 Getting Started 4..............................................
WFP Liberia Country Office
 1 Oscar Gobbato [email protected] [email protected] WFP Liberia Country Office GIS training - Summary Objectives 1 To introduce to participants the basic concepts and techniques in using Geographic
Data Visualization. Prepared by Francisco Olivera, Ph.D., Srikanth Koka Department of Civil Engineering Texas A&M University February 2004
 Data Visualization Prepared by Francisco Olivera, Ph.D., Srikanth Koka Department of Civil Engineering Texas A&M University February 2004 Contents Brief Overview of ArcMap Goals of the Exercise Computer
Editing Common Polygon Boundary in ArcGIS Desktop 9.x
 Editing Common Polygon Boundary in ArcGIS Desktop 9.x Article ID : 100018 Software : ArcGIS ArcView 9.3, ArcGIS ArcEditor 9.3, ArcGIS ArcInfo 9.3 (or higher versions) Platform : Windows XP, Windows Vista
Census Data: Access, Mapping and Visualization
 Census Data: Access, Mapping and Visualization Trent University is a member of the Data Liberation Initiative (DLI), an agreement that provides academic institutions with access to otherwise restricted
Software: AutoCAD Civil 3D 2014, NRCS C3D 2014 template, ESRI ArcMap. Notation:Button to Press Displayed Text Icon Action {Text to Enter} Menu Item
 Overview: Use the following processes for exchanging georeferenced data between AutoCAD Civil 3D 2014 and ArcMap. The work must be based in any real world coordinate system. (This example uses NAD 83 UTM
ArcScan Tutorial. Copyright 1995-2010 Esri All rights reserved.
 Copyright 1995-2010 Esri All rights reserved. Table of Contents Exercise 1: Interactive vectorization........................... 3 Exercise 2: Automatic vectorization........................... 12 Copyright
Data Visualization. Brief Overview of ArcMap
 Data Visualization Prepared by Francisco Olivera, Ph.D., P.E., Srikanth Koka and Lauren Walker Department of Civil Engineering September 13, 2006 Contents: Brief Overview of ArcMap Goals of the Exercise
Publishing Geoprocessing Services Tutorial
 Publishing Geoprocessing Services Tutorial Copyright 1995-2010 Esri All rights reserved. Table of Contents Tutorial: Publishing a geoprocessing service........................ 3 Copyright 1995-2010 ESRI,
Pharmacy Affairs Branch. Website Database Downloads PUBLIC ACCESS GUIDE
 Pharmacy Affairs Branch Website Database Downloads PUBLIC ACCESS GUIDE From this site, you may download entity data, contracted pharmacy data or manufacturer data. The steps to download any of the three
Using Adobe Dreamweaver CS4 (10.0)
") Getting Started Before you begin create a folder on your desktop called DreamweaverTraining This is where you will save your pages. Inside of the DreamweaverTraining folder, create another folder called
Getting Started Before you begin create a folder on your desktop called DreamweaverTraining This is where you will save your pages. Inside of the DreamweaverTraining folder, create another folder called
Exercise 5: Working with tables
 The Scenario You have been hired as a GIS consultant with the county school board. They need to get a better idea of where school age children live and where they should consider building additional schools.
Using Map Topology Editing Tools
 Using Map Topology Editing Tools What You Will Need in ArcView This tutorial, written by Colin Childs, is a companion to the article ArcGIS Topology for ArcView Users, also by Colin Childs, that appeared
Personalizing your Access Database with a Switchboard
 Personalizing your Access Database with a Switchboard This document provides basic techniques for creating a switchboard in Microsoft Access. A switchboard provides database users with a customized way
Introduction to Microsoft Access 2010
 Introduction to Microsoft Access 2010 A database is a collection of information that is related. Access allows you to manage your information in one database file. Within Access there are four major objects:
Geoprocessing and Spatial Data Editing in ArcGIS
 Geoprocessing and Spatial Data Editing in ArcGIS I. Geoprocessing a set of software functions used to manipulate and transform spatial data (single layers or multiple sets of layers), to create new information.
Under GIS Data select Hydrography This will show all of the state-wide options for hydrography data. For this project, we want the seventh entry in
 Introductory Exercises for GIS Using ArcMap & ArcCatalog GIS Cyberinfrastructure Module EEB 5894, section 10 Please refer to the ESRI online GIS Dictionary for additional details on any of the terms in
How to use PGS: Basic Services Provision Map App
 How to use PGS: Basic Services Provision Map App The PGS: Basic Services Provision Map App The main features of the PGP Basic Services web application includes: Navigation Tools Map Tools Main Map Links
Creating a Distribution List from an Excel Spreadsheet
 Creating a Distribution List from an Excel Spreadsheet Create the list of information in Excel Create an excel spreadsheet. The following sample file has the person s first name, last name and email address
What is a Mail Merge?
 NDUS Training and Documentation What is a Mail Merge? A mail merge is generally used to personalize form letters, to produce mailing labels and for mass mailings. A mail merge can be very helpful if you
Use Geodatabase Subtypes and Attribute Domains for Automatic Validation Tutorial
 Use Geodatabase Subtypes and Attribute Domains for Automatic Validation Tutorial By Marnel Taggart and Mike Ridland, ESRI Educational Services Overview This tutorial supplements the article Use Geodatabase
Modeling Fire Hazard By Monica Pratt, ArcUser Editor
 By Monica Pratt, ArcUser Editor Spatial modeling technology is growing like wildfire within the emergency management community. In areas of the United States where the population has expanded to abut natural
Creating a File Geodatabase
 Creating a File Geodatabase Updated by Thomas Stieve January 06, 2012 This exercise demonstrates how to create a file geodatabase in ArcGIS 10; how to import existing data into the geodatabase, and how
Spatial Analyst Tutorial
 Copyright 1995-2010 Esri All rights reserved. Table of Contents About the ArcGIS Spatial Analyst Tutorial......................... 3 Exercise 1: Preparing for analysis............................ 5 Exercise
TABLE OF CONTENTS BACKGROUND: HIGH IMPACT EMAIL 4.0 PROFESSIONAL AND ACT!. 3 SELECT MAIL MERGE OPTION ON THE MAIN SCREEN.0 TEMPLATE.
 TABLE OF CONTENTS BACKGROUND: HIGH IMPACT EMAIL 4.0 PROFESSIONAL AND ACT!... 3 SELECT MAIL MERGE OPTION ON THE MAIN SCREEN... 4 SELECT A HIGH IMPACT EMAIL 4.0 TEMPLATE... 5 SELECT A PROFILE TO BE USED
LYON COUNTY GEOMOOSE 2 HELP DOCUMENT
 LYON COUNTY GEOMOOSE 2 HELP DOCUMENT TABLE OF CONTENTS Lyon County Geomoose 2 Help Document... 1 Introduction... 3 Quick Reference Chart... 4 The Interface... 4 The Table of Contents... 5 Quick Reference
Tips & Tricks for ArcGIS. Presented by: Jim Mallard, Crime Analysis Supervisor Arlington, Texas. 2007 IACA Conference Pasadena, Ca
 Tips & Tricks for ArcGIS Presented by: Jim Mallard, Crime Analysis Supervisor Arlington, Texas 2007 IACA Conference Pasadena, Ca Table of Contents Lock & Load Labels for Maximum Speed!...2 Choose your
Virtual Communities Operations Manual
 Virtual Communities Operations Manual The Chapter Virtual Communities (VC) have been developed to improve communication among chapter leaders and members, to facilitate networking and communication among
Canterbury Maps Quick Start - Drawing and Printing Tools
 Canterbury Maps Canterbury Maps Quick Start - Drawing and Printing Tools Quick Start Guide Standard GIS Viewer 2 Canterbury Maps Quick Start - Drawing and Printing Tools Introduction This document will
A Method Using ArcMap to Create a Hydrologically conditioned Digital Elevation Model
 A Method Using ArcMap to Create a Hydrologically conditioned Digital Elevation Model High resolution topography derived from LiDAR data is becoming more readily available. This new data source of topography
Working with the Raster Calculator
 Working with the Raster Calculator The Raster Calculator provides you a powerful tool for performing multiple tasks. You can perform mathematical calculations using operators and functions, set up selection
Geocoding and Buffering Addresses in ArcGIS
 INTRODUCTION and Buffering Addresses in ArcGIS is the process of assigning location coordinates in a continuous, globlal reference system (Latitude and Longitude, for instance) to street addresses. While
Open icon. The Select Layer To Add dialog opens. Click here to display
 Mosaic Introduction This tour guide gives you the steps for mosaicking two or more image files to produce one image file. The mosaicking process works with rectified and/or calibrated images. Here, you
How To Hydrologically Condition A Digital Dam
 Program: Funding: Conservation Applications of LiDAR Data http://tsp.umn.edu/lidar Environment and Natural Resources Trust Fund Module: Instructor: Hydrologic Applications Sean Vaughn, DNR GIS Hydrologist
GIS I Business Exr02 (av 9-10) - Expand Market Share (v3b, Jul 2013)
 - Expand Market Share (v3b, Jul 2013)") GIS I Business Exr02 (av 9-10) - Expand Market Share (v3b, Jul 2013) Learning Objectives: Reinforce information literacy skills Reinforce database manipulation / querying skills Reinforce joining and mapping
GIS I Business Exr02 (av 9-10) - Expand Market Share (v3b, Jul 2013) Learning Objectives: Reinforce information literacy skills Reinforce database manipulation / querying skills Reinforce joining and mapping
Making an online form in Serif WebPlus
 Making an online form in Serif WebPlus Before you begin your form, it is a very good idea to plan it out on a piece of paper. Decide what information you wish to collect, and which type of fields will
NIS-Elements: Using Regions of Interest (ROIs) & ROI Statistics
 & ROI Statistics") NIS-Elements: Using Regions of Interest (ROIs) & ROI Statistics Various ROI tools and functions NIS-Elements has several ROI functions designed for data analysis and image quantification. ROIs are a core
NIS-Elements: Using Regions of Interest (ROIs) & ROI Statistics Various ROI tools and functions NIS-Elements has several ROI functions designed for data analysis and image quantification. ROIs are a core
Introduction to Microsoft Access 2003
 Introduction to Microsoft Access 2003 Zhi Liu School of Information Fall/2006 Introduction and Objectives Microsoft Access 2003 is a powerful, yet easy to learn, relational database application for Microsoft
Creating a Participants Mailing and/or Contact List:
 Creating a Participants Mailing and/or Contact List: The Limited Query function allows a staff member to retrieve (query) certain information from the Mediated Services system. This information is from
Tutorial 8 Raster Data Analysis
 Objectives Tutorial 8 Raster Data Analysis This tutorial is designed to introduce you to a basic set of raster-based analyses including: 1. Displaying Digital Elevation Model (DEM) 2. Slope calculations
To create a histogram, you must organize the data in two columns on the worksheet. These columns must contain the following data:
 You can analyze your data and display it in a histogram (a column chart that displays frequency data) by using the Histogram tool of the Analysis ToolPak. This data analysis add-in is available when you
Creating a Database in Access
 Creating a Database in Access Microsoft Access is a database application. A database is collection of records and files organized for a particular purpose. For example, you could use a database to store
How to Download Census Data from American Factfinder and Display it in ArcMap
 How to Download Census Data from American Factfinder and Display it in ArcMap Factfinder provides census and ACS (American Community Survey) data that can be downloaded in a tabular format and joined with
Microsoft Access 2007 Advanced Queries
 Microsoft Access 2007 Advanced Queries When you run a query in Microsoft Access 2007, it is not only able to display records, but also able to perform specific tasks and actions based on user defined criteria.
ArcScan Tutorial. Copyright 1995-2012 Esri All rights reserved.
 Copyright 1995-2012 Esri All rights reserved. Table of Contents Exercise 1: Interactive vectorization........................... 3 Exercise 2: Automatic vectorization........................... 12 Copyright
Mac Outlook Calendar/Scheduler and Tasks
 Introduction Schedule an event and/or meeting. Schedule all-day and recurring events. Assign tasks to another user and use special shortcut keys. Contents Introduction Contents Calendar View Edit an appointment
Publishing KML Services Tutorial
 Publishing KML Services Tutorial Copyright 1995-2010 Esri All rights reserved. Table of Contents Tutorial: Publishing a KML service............................ 3 Copyright 1995-2010 ESRI, Inc. All rights
Geocortex HTML 5 Viewer Manual
 1 FAQ Nothing Happens When I Print? How Do I Search? How Do I Find Feature Information? How Do I Print? How can I Email A Map? How Do I See the Legend? How Do I Find the Coordinates of a Location? How
This Skill Builder demonstrates how to define and place sketched symbols in drawings.
 Sketched Symbols This Skill Builder demonstrates how to define and place sketched symbols in drawings. A sketched symbol is a user-defined symbol. You create sketched symbols in the sketch environment
Linear Referencing Tutorial
 Copyright 1995-2010 Esri All rights reserved. Table of Contents An overview of the linear referencing tutorial........................ 3 Exercise 1: Organizing your linear referencing data in ArcCatalog...............
Advanced Presentation Features and Animation
 There are three features that you should remember as you work within PowerPoint 2007: the Microsoft Office Button, the Quick Access Toolbar, and the Ribbon. The function of these features will be more
User s Guide to ArcView 3.3 for Land Use Planners in Puttalam District
 User s Guide to ArcView 3.3 for Land Use Planners in Puttalam District Dilhari Weragodatenna IUCN Sri Lanka, Country Office Table of Content Page No Introduction...... 1 1. Getting started..... 2 2. Geo-referencing...
In this example, Mrs. Smith is looking to create graphs that represent the ethnic diversity of the 24 students in her 4 th grade class.
 Creating a Pie Graph Step-by-step directions In this example, Mrs. Smith is looking to create graphs that represent the ethnic diversity of the 24 students in her 4 th grade class. 1. Enter Data A. Open
NetCDF Tutorial. Copyright 1995-2010 Esri All rights reserved.
 Copyright 1995-2010 Esri All rights reserved. Table of Contents About the netcdf Tutorial............................... 3 Exercise 1: Displaying a raster layer from a netcdf file................... 4
Database Servers Tutorial
 Copyright 1995-2010 Esri All rights reserved. Table of Contents A quick tour of the database servers tutorial........................ 3 Exercise 1: Add a database server to the Catalog tree and create
Using Spreadsheets, Selection Sets, and COGO Controls
 Using Spreadsheets, Selection Sets, and COGO Controls Contents About this tutorial... 3 Step 1. Open the project... 3 Step 2. View spreadsheets... 4 Step 3. Create a selection set... 10 Step 4. Work with
Export the address book from the Blackberry handheld to MS Outlook 2003, using the synchronize utility in Blackberry Desktop Manager.
 Export the address book from the Blackberry handheld to MS Outlook 2003, using the synchronize utility in Blackberry Desktop Manager. Revised 2/25/07 Creating a New Contacts Folder in Outlook Open Outlook
Affiliation Security
 Affiliation Security Access to more student information: View student information with majors/minors* View student information under your advisement View students who have signed up for courses* View student
Basic Pivot Tables. To begin your pivot table, choose Data, Pivot Table and Pivot Chart Report. 1 of 18
 Basic Pivot Tables Pivot tables summarize data in a quick and easy way. In your job, you could use pivot tables to summarize actual expenses by fund type by object or total amounts. Make sure you do not
How to create pop-up menus
 How to create pop-up menus Pop-up menus are menus that are displayed in a browser when a site visitor moves the pointer over or clicks a trigger image. Items in a pop-up menu can have URL links attached
Syllabus AGET 782. GIS for Agricultural and Natural Resources Management
 Syllabus AGET 782 Course Title: GIS for Agricultural and Natural Resources Management Course Abbreviation: AGET 782 Course Credits: Instructor: Course Description: Required Text: 3 hours Timothy N. Burcham,
Using Microsoft Word. Working With Objects
 Using Microsoft Word Many Word documents will require elements that were created in programs other than Word, such as the picture to the right. Nontext elements in a document are referred to as Objects
Creating a Form. A form is something that is created allowing users to enter information in a more visual manner than a datasheet view.
 Creating a Form A form is something that is created allowing users to enter information in a more visual manner than a datasheet view. In the database object window, click on the word Forms Double Click
Finding GIS Data and Preparing it for Use
 Finding_Data_Tutorial.Doc Page 1 of 19 Getting Ready for the Tutorial Sign Up for the GIS-L Listserv Finding GIS Data and Preparing it for Use The Yale University GIS-L Listserv is an internal University
Creating Calculated Fields in Access Queries and Reports
 Creating Calculated Fields in Access Queries and Reports Access 2000 has a tool called the Expression Builder that makes it relatively easy to create new fields that calculate other existing numeric fields
3D-GIS in the Cloud USER MANUAL. August, 2014
 3D-GIS in the Cloud USER MANUAL August, 2014 3D GIS in the Cloud User Manual August, 2014 Table of Contents 1. Quick Reference: Navigating and Exploring in the 3D GIS in the Cloud... 2 1.1 Using the Mouse...
Using Ad-Hoc Reporting
 Using Ad-Hoc Reporting The purpose of this guide is to explain how the Ad-hoc reporting function can be used to produce Management Information from client and product data held in the Key. The guide will
Microsoft PowerPoint 2008
 Microsoft PowerPoint 2008 Starting PowerPoint... 2 Creating Slides in Your Presentation... 3 Beginning with the Title Slide... 3 Inserting a New Slide... 3 Slide Layouts... 3 Adding an Image to a Slide...
ArcFuels Supplemental Material: GIS 9.x Tips and Tricks
 ArcFuels Supplemental Material: GIS 9.x Tips and Tricks Supplemental material: GIS Tips and Tricks... 1 Shapefiles: Points, Lines, and Polygons... 2 Creating a New Shapefile (point, line, or polygon)...
Using ArcGIS ModelBuilder to batch process files
 The ArcGIS Model Builder is a tool you can use to help process a large number of files in an automated fashion. To open a new ModelBuilder document, either choose ModelBuilder from the Geoprocessing menu,
Exercise 3: Building a GIS data library
 The Scenario You are preparing for an interview for a GIS position for a particular county. They asked that you present a GIS demonstration as part of your interviewing process. You decide to develop a
Microsoft Access 2010- Introduction
 Microsoft Access 2010- Introduction Access is the database management system in Microsoft Office. A database is an organized collection of facts about a particular subject. Examples of databases are an
Build Your First Web-based Report Using the SAS 9.2 Business Intelligence Clients
 Technical Paper Build Your First Web-based Report Using the SAS 9.2 Business Intelligence Clients A practical introduction to SAS Information Map Studio and SAS Web Report Studio for new and experienced
FDOT Roadway Design and 3D Modeling
 State of Florida Department of Transportation FDOT Roadway Design and 3D Modeling CE-11-0138, CE-11-0139, and CE-11-0140 User Training Manual October 30, 2014 ENGINEERING / CADD SYSTEMS OFFICE TALLAHASSEE,
Introduction to PostGIS
 Tutorial ID: IGET_WEBGIS_002 This tutorial has been developed by BVIEER as part of the IGET web portal intended to provide easy access to geospatial education. This tutorial is released under the Creative
ProjectWise Explorer V8i User Manual for Subconsultants & Team Members
 ProjectWise Explorer V8i User Manual for Subconsultants & Team Members submitted to Michael Baker International Subconsultants & Team Members submitted by Michael Baker International ProjectWise Support