Assessment and Accountability: Making the Connection
|
|
|
- Barnard Powell
- 9 years ago
- Views:
Transcription
1 Assessment and Accountability: Making the Connection Texas Assessment Conference February 16, 2015 Hilton Salon F from 8:30 11:30 a.m. Cheri Hendrick Accountability and Assessment Specialist, School Support Education Service Center, Region 20, San Antonio, TX (210) [email protected]
2 Why are we here today? Join us as we walk through the connection of your state assessments to the multiple accountability systems that your campus(es) and districts are evaluated on. We walk through multiple systems including the indexes to assist you and your staff in understanding the report as well as the methodology with each area so that you are prepared to present this information to your schools, community, and other stakeholders.
3 PEIMS Snapshot Last Friday in October 2015 Accountability Friday, October 31, 2014 End of Course results also have the possibility of Friday, October 25, 2013
4 2015 Accountability Subset Enrollment Fall 2013 snapshot October 25, 2013 Fall 2014 snapshot October 31, 2014 STAAR Results Summer 2014 End of Course Fall 2014 End of Course Spring 2015 End of Course Spring 2015 Grades 3 8
5 EOC STAAR Performance Districts and campuses are accountable for three EOC administrations: 1) summer results for students enrolled on the prior-year fall snapshot; 2) fall results for students enrolled on the current-year fall snapshot; and 3) spring results for students enrolled on the fall snapshot (current school year). Enrolled and tested on the same campus or district during the 2015 accountability cycle, calculation of the performance indexes will include the best EOC results Fall 2013 Snapshot Summer 2014 Fall 2014 Snapshot Fall 2014 Spring 2015 Campus CAMPUS CAMPUS CAMPUS Campus The best test result is selected. Each test meets the accountability subset rule.

6 2014 Accountability Manual Appendix K - Data Sources
7 Answer document Accountability
8 Answer documents 2014 Accountability Manual Appendix K Page 134 State Assessments. Student identification, demographic data, and scoring status information as entered on the answer document at the time of testing are used to determine the accountability subset and student groups for campus and district ratings. Districts have multiple opportunities to provide accurate information through their PEIMS submissions, pre-coded data files provided to the test contractor, and updates to the answer documents at the time of testing.
9 2014 Accountability Frequently Asked Questions The accountability results are based on the demographic information from the Consolidated Accountability File (CAF) which includes only one race/ethnicity value. The CAF file provides the most recent demographic information based on the last test administration available for each student. The accountability results are based on the demographic information from the Consolidated Accountability File (CAF) which includes only one Special Education/ELL (Limited English Proficiency) value. The CAF file provides the most recent program information based on the last test administration available for each student. For the LEP field, if the student tested in TELPAS or is identified as a current LEP student (value of 'C') in any current- year test administration, the value on the CAF file will be 'C'.

10 A AR B B CT ED ESL ETH G/T I L MS P PD SE TIA W Get a blank notecard How many do you know? Answer Document
11 Answer Document Indicators A AR B B CT ED ESL ETH G/T I L MS P PD SE TIA W Asian At-Risk Black African American Bilingual Program Career and Technical Ed Economic Disadvantage ESL Program Type Hispanic Latino Code Gift Talented American Indian Alaska Native LEP Migrant Student Native Hawaiian Pacific Islander Parental Denial Special Education Title I, Part A White
12

13 Reports

14 Focus & Priority Schools
15 STAAR Report with possible Interventions Accountability Report District Improvement Plan* Campus Improvement Plan* If required, Targeted Improvement Plan Performance Based Monitoring Analysis System (PBMAS) Data Validation Monitoring (DVM) Annual Measurable Achievement Objectives (AMAOs) *TEC & requires each year
16 STAAR Reports with reporting requirements Public Education Grant List (PEG) Notify parents/guardians by Feb 1 Texas Academic Performance Report (TAPR) Public hearing within 90 days of TEA posting (11/21/14) TAPR Guidelines to follow School Report Card (SRC) Distribute a copy to parents within six weeks of 12/11/14 letter Federal Report Card (NCLB/ESEA requirement) Post on website, make hard copies available, notify parents of all students of the availability of the report cards (by March 6, 2015) Financial Integrity Rating System of Texas (FIRST) Public meeting Accreditation Below accredited public notification is required HB 5 Community and Student Engagement Post on website

17 STAAR Reports Download from TAMS Upload to eduphoria, DMAC, SIS
18 STARR Results

19 Summary Reports How do you cross reference snapshot? Education Service Center, Region 20 Spreadsheet to assist in totaling campus summary reports When calculating all tests, for example all Reading tests, make sure you include at the versions of the test. Summary Reports are not consolidated. STAAR Grade 5 Reading Page 1 STAAR Grade 5 Summary Page 13 STAAR Spanish Grade 5 Summary Page 14 STAAR L Grade 5 Summary Page 15 STAAR Modified Grade 5 Summary Page 16 STAAR Alternate will be reported with the May Grades 3-8 and June EOC reports 19
20 How do you cross reference snapshot? Grade 5 & 8 April Reports: Only STAAR Progress Listed --- Not available; 0 did not meet; 1 met; 2 exceeded ELL Progress not available TELPAS was not processed yet 20
21 How do you cross reference snapshot? Confidential Campus Roster Level II Satisfactory Index 1 & 3 Level III Advanced Index 3 STAAR Progress Index 2 ELL Progress Index 1, 2 & 3 Is anything missing? Final Level II for Index 4 If applicable, STAAR Progress OR ELL Progress reported not both --- Not available; 0 did not meet; 1 met; 2 exceeded April Grade 5 & 8 Reports: Only STAAR Progress was reported ELL Progress was not available; TELPAS was not processed yet May Grades 3 8 Reports should have both STAAR Progress 21 Measure and ELL Progress Measure populated where appropriate
22 Card Sort

23 2014 Accountability Card Sort Index 4 3 cards per column

24 Answer document Accountability
25 TELPAS
26 ELL Progress Measure
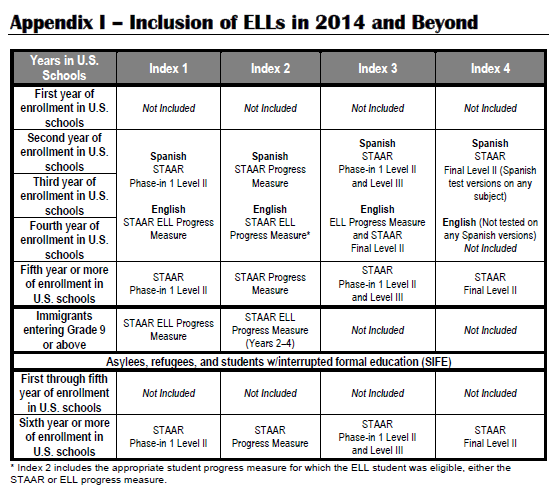
27 ELL Progress Measure Postings The ELL Progress Measure takes into account the time needed for ELL students to acquire the English language and to fully demonstrate gradelevel academic skills in English. Posted March 18, ) Texas English Language Learner (ELL) Progress Measure Expectations 2) Calculating the Texas English Language Learner (ELL) Progress Measure 3) Texas English Language Learner (ELL) Progress Measure Questions and Answers To be used in Index 1, 2 and 3
28 Student must Which students receive an ELL Progress Measure? be classified as Limited English Proficient (LEP) have a valid STAAR scale score On an English language version of STAAR or STAAR L Student cannot be a parent denial for ELL Services have taken STAAR Spanish, modified or alternate versions have exceeded the number of years in the plan in which he/she qualifies If the student does not meet the criteria to receive an ELL Progress measure, the student may be eligible to receive the STAAR Progress measure. Texas ELL Progress Measure Q&A #5 Calculating the Texas ELL Progress Measure page 1
29 How is ELL Progress Calculated? Information needed: TELPAS numbers of years in U.S. Schools TELPAS composite rating Extenuating circumstances (Reported on TELPAS) Student with interrupted formal education (SIFE) Unschooled asylee/refugee All LEP students taking English I or English II are given an extra year Texas ELL Progress Measure Q&A #6

30 Texas ELL Progress Measure Plans Texas ELL Progress Measure Q&A #6
![Texas ELL Progress Measure Expectations [Table of each grade/eoc] There is a different table for each](/docs-images/41/22541868/images/31-0.png "grade level.")
31 Texas ELL Progress Measure Expectations [Table of each grade/eoc] There is a different table for each grade level. Grade 3 STAAR Phase-in 1 Level II Passing Standard English Reading 1331 English Math 1392

32 2014 Texas Assessment Conference Progress on STAAR Slide 17
33 Where is ELL Progress reported? Summary Reports Data Files Student portal of the Texas Assessment Management system Confidential Student Report (CSR) Met Exceeded No Information Available (missing one or more pieces of information) Texas ELL Progress Measure Q&A #11 & 22 and Calculating ELL Progress pg. 1
34 Where is ELL Plan reported? Student portal of the Texas Assessment Management system Year of a -Year Plan Texas ELL Progress Measure Q&A #11
35 Are retest included? The ELL Progress measure will be available for all retest administrations The best ELL progress measure outcome will be used Texas ELL Progress Measure Q&A #23
36 ELL Progress versus Passing STAAR Meeting ELL Progress Measure does not mean the student has met SSI, graduation requirements or LEP Exit criteria Student must meet the passing standard on STAAR for grade promotion or graduation purposes Texas ELL Progress Measure Q&A #32

37 2014 Accountability Manual Page 123
38 Overview of proposed 2015 Accountability Cheri Hendrick Accountability and Assessment Specialist, School Support (210)
39 2014 Accountability Development Timeline March 28, 2014 APAC/ATAC Recommendations April 4, 2014 April 25, 2014 Commissioner s Final Decisions posted Latest Updates on TEA s website May 16, 2014 Key chapters of the 2014 Accountability Manual (Chapters 2-9) June 5, 2014 June 6, 2014 June 2014 July 11, 2014 August 1, 2014 August 8, 2014 TEASE posting of final graduation information TEASE postings of comparison groups Entire 2014 Accountability Manual (still waiting for Chapter 11 Preview and Appendix L: Index 2 & 3 targets) Consolidated Accountability File 2014 Accountability data posted in TEASE (Page 16 of the 2014 Accountability Manual) 2014 Accountability posted publicly on TEA s website 39
40 Performance Index Framework To receive a Met Standard or Met Alternative Standard rating, all campuses and districts must meet the targets on all indexes for which they have performance results. Student Achievement Index I Postsecondary Readiness Index 4 Accountability System Student Progress Index 2 Closing Performance Gaps Index 3 40
41 2014 Accountability Ratings 2014 Accountability Rating 2014 Distinction Designations (Districts and Campuses) (Districts and Campuses) Postsecondary Readiness Met Standard met performance index targets (acceptable) Met Alternative Standard met modified performance index targets for alternative education campuses and charter districts (acceptable) (Campuses Only) Top 25%: Student Progress and/or Top 25%: Closing Achievement Gaps and/or Academic Achievement: Reading/ELA and/or Academic Achievement: Mathematics and/or Academic Achievement: Science and/or Academic Achievement: Social Studies N/A Improvement Required did not meet one or more performance index targets (unacceptable) N/A 41
42 To receive a Met Standard or Met Alternative Standard rating, all campuses and districts must meet the following targets on all indexes for which they have performance results. Accountability Targets [non-aea Districts and Campuses] Index 1 Index 2 Index 3 Index All 4 STAAR All 4 STAAR District TBD 21* 16* TBD 55 28* TBD TBD TBD Campus: Elementary 30* 33* TBD 28* TBD N/A N/A 12 TBD TBD Middle School TBD 29* 28* TBD 55 27* TBD N/A N/A 13 TBD TBD High School/K-12 17* N/A TBD 31* TBD TBD TBD *5th percentile by campus type - see chart below Accountability Targets [AEA Districts and Campuses] 2014 AEA list of campuses and districts posted at Index 1 Index 2 Index 3 Index AEA Campuses and Charter District Targets All Only Grad All Only Grad TBD 9^ N/A TBD 30 11^ TBD TBD TBD ^5th percentile for both AEA campuses and districts Bonus Points (max 30) RHSP/DAP, College-Ready Graduates and excluded students credit 42

43 2014 Accountability System School Types Targets for non-aea campuses are set at about the fifth percentile of non-aea 2014 campus performance by campus type. Targets for non-aea districts correspond to about the fifth percentile of non-aea 2014 campus performance across all campus types. Targets for both AEA charters and campuses are set at about the fifth percentile of AEA 2014 campus performance Accountability Manual page 15
44 2014 AEA Campuses and Districts 2014 AEA campus registration was April 1-15, 2014, and available through the TEASE Accountability website. Alternative education campuses (AECs) rated under 2013 AEA procedures qualify for automatic re-registration in 2014, subject to certain criteria: Each campus must have at least 75% at-risk student enrollment, as verified by current-year PEIMS fall enrollment data; For campuses with less than 75% at-risk student enrollment, prior-year PEIMS data may be used to qualify; Each campus must have at least 50% of students enrolled in grades AEA registration will be expanded to include dropout recovery schools Accountability Manual page
45 Proposals for 2015 Accountability This presentation contains information that is presently being proposed. The commissioner of education will make final decisions in late March Accountability Development Materials are posted on TEA s website
46 Performance Index Framework To receive a Met Standard or Met Alternative Standard rating, all campuses and districts must meet the targets on all indexes for which they have performance results. Student Achievement Index I Postsecondary Readiness Index 4 Accountability System Student Progress Index Proposal: Must Met: Index 1 or Index 2, Index 3 and Index 4 Closing Performance Gaps Index 3 46
47 Index 1: Student Achievement Index 1: Student Achievement is a snapshot of performance across subjects, on both general and alternative assessments, at the satisfactory performance standard. Student Group: All Students No minimum size; Small number analysis used if less than 10 tests Combined over All Subjects: Reading, Mathematics, Writing, Science and Social Studies Grades 3-8 Math included using a bridge study Student Performance Standards Included: Phase-in 1 Level II (Satisfactory) ELL Students 2 nd, 3 rd and 4 th year in U.S. schools meeting the new ELL Progress Measure Substitute Assessments for STAAR EOC tests are included End of Course: Best result from July 14, Fall 14 and Spring 15 English I & II Combined, Algebra I, Biology & U.S. History Proposed: include STAAR A and STAAR Alternate 2 (Hold harmless) 47

48 Substitute Assessments Included in Index 1 & 4; not included in Index 2 & 3 December 2013 Texas Administrative Code Updates New Figure: 19 TAC (b) (PDF) Answer document instructions 2014 District and Campus Coordinator Manual page S-47
49 Index 2: Student Progress 50
50 Index 2: Student Progress Index 2: Student Progress separates measures of student progress from measures of student achievement to provide an opportunity for diverse campuses to show the improvements they are making independent of overall achievement levels. Ten student groups: All students Seven race/ethnic groups Students served by special education English Language Learners (ELL) By Subject Area: Reading, Math and Writing Minimum Size All students: no minimum size small numbers analysis if less than 10 tests Student Groups: 25 tests Proposed to change the calculation structure Points based on weighted performance: One point given for each percentage of tests at the Met or Exceeded progress level One additional point for each percentage of tests at the Exceeded progress level 51
51 Reading Grade Scale Score English I Index 2: Student Progress How is Growth Defined? Reading Final Recommended Level II English I
52 Expected Growth Index 2: Student Progress How is Growth Defined? Scale Score Level 2 Recommended Level 2 Recommended Previous Year Current Year

53 Index 2: Student Progress Let s look at an example STAAR Progress Measure posted on TEA s website Calculating Progress Measure page 4 (PDF updated 05/12/14) 55
54 Index 2: Student Progress How did the come up with 32 points? STAAR Reading English = 32 Expected Growth: 32 Points Level 2 Recommended Level 2 Recommended Grade 4 Grade 5

55 Index 2: Student Progress STAAR Reading English Example Expected Growth: 32 Points Level III Met Growth Phase-In 1 Level II Not Met Met Growth Met Growth Grade 4 Grade 5

56 Index 2: Student Progress A Level III student has to stay at Level III 58
57 Index 3: Closing Performance Gaps Index 3: Closing Performance Gaps emphasizes advanced academic achievement of the economically disadvantaged student group and the lowest performing race/ethnicity student groups at each campus and district. By Subject Area: Reading, Mathematics, Writing, Science, and Social Studies Grades 3-8 Math included using a bridge study Student Groups: Economically Disadvantaged No minimum size; small numbers analysis is less than 10 tests Two Lowest Performing Race/Ethnicity Groups Based on 2014 Index 1 All Subjects Minimum size: 25 tests in Reading and Math If only two ethnic groups meet minimum size; evaluated on one ethnic group. If only one ethnic group meets minimum size; evaluated only on Economically Disadvantaged 59
 Make sure you review the unmasked report on TEASE 2014 Index 3: Closing")
58 Index 3: 2015 Construction - Student Groups (based on 2014 assessment results by Race/Ethnicity) Make sure you review the unmasked report on TEASE 2014 Index 3: Closing Performance Gaps AND 60
59 Index 3: Closing Performance Gaps Index 3: Closing Performance Gaps By Subject Area: Reading, Mathematics, Writing, Science, and Social Studies Grades 3-8 Math included using a bridge study Student Groups: Economically Disadvantaged - No minimum size; small number analysis if less than 10 tests Two Lowest Performing Race/Ethnicity Groups Based on 2014 Index 1 All Subjects Minimum size: 25 tests in Reading and Math No Proposed changes Points based on STAAR performance: Phase-in 1 Level II satisfactory performance: One point for each percentage of tests at Phase-in 1 Level II (Satisfactory) Level III advanced performance: One additional point for each percentage of tests at the Level III Advanced 61
60 Index 4: Postsecondary Readiness Index 4: Postsecondary Readiness includes measures of high school completion and STAAR performance at the postsecondary readiness standard. This index emphasizes the importance of attaining a high school diploma that prepares students with the foundation necessary for success in college, the workforce, job training programs, or the military. *Non-AEA Targets 1) STAAR Final Level II, 2) Graduation Rate, 3) Graduation Plan, and 4) College-Ready Graduates If all four components are not available for schools or districts, evaluate only the STAAR Final Level II performance 63
61 Index 4: Postsecondary Readiness STAAR Score: STAAR Percent Met Final Level ll on two or more tests for All Students and race/ethnicity student groups Eight student groups: All students Seven race/ethnicity groups Includes STAAR, STAAR Spanish STAAR A, STAAR Alternate 2 and STAAR L not included All Subjects: Reading, Mathematics, Writing, Science and Social Studies Students tested on one subject area only must meet the final Level II performance standard for that subject area. Students tested on only two subject areas must meet the final Level II performance standard for both subject areas. 64
62 Index 4: Postsecondary Readiness STAAR Score: STAAR Percent Met Final Level ll on two or more tests for All Students and race/ethnicity student groups Only include EOC tests for students that tested for the FIRST time in 2015 accountability cycle Summer 2014, Fall 2014 and Spring 2015 Student EOC results for students that tested for the first time prior to the accountability cycle are not included in Index 4 Substitute Assessments for STAAR EOC tests are included Minimum Size: All Students 10 students; no small numbers analysis Student Groups 25 students 65
63 Index 4: Postsecondary Readiness Number of students meeting the STAAR Postsecondary Readiness Standard on at least two subject area tests + Number of students with test results in two or more subject areas Number of students meeting the STAAR Postsecondary Readiness Standard on the subject area test Number of students with test results on only one subject area Rounded to nearest whole number (for example, 59.87% is rounded to 60%) 67
64 2015 Index 4: Postsecondary Readiness Graduation Rate (or Annual Dropout Rate): Combined performance across graduation/dropout rates for: Grade 9-12 Class of 2014 Four-Year Graduation Rate or Grade 9-12 Class of 2013 Five-Year Graduation Rate whichever contributes the most points to the index If a campus/district has no Graduation Rate, then the Grade 9-12 annual dropout rate will be used. Ten student groups: All students Seven race/ethnic groups Students served by special education English Language Learners (ELL) - Students identified as LEP since entering 9 th grade Minimum Size: All students: no minimum size; small numbers analysis if less that 10 students Student groups: 25 students Proposed: Foundation graduates will be included 68
65 Index 4: Postsecondary Readiness Graduation Rate Calculation Number of Graduates in the Class Number of Students in the Class (Graduates + Continuers + GED Recipients + Dropouts) Dropout Rate Calculation Number of students who dropped out during the school year Number of Students enrolled during the school year 100 (Grades 9-12 Annual Dropout Rate x 10) with a floor of zero Rounded to nearest decimal place(for example, 59.87% is rounded to 59.9%) 69
66 2015 Index 4: Postsecondary Readiness Graduation Plan Component Class of 2014 Four-year Recommended High School Program/Distinguished Achievement Program (RHSP/DAP) Rate Four-year Longitudinal Graduation Cohort - began 9 th grade in No four-year longitudinal graduation cohort use annual percent of RHSP/DAP graduates Student groups: All students Seven race/ethnicity groups Minimum size: All students: no minimum size; small numbers analysis if less that 10 graduates Student groups: 25 graduates Proposed: Foundations graduates are excluded 70
67 2014 Index 4: Postsecondary Readiness 2014 Targets: Elem 12, MS 13, HS/K-12 & Districts 57* (*based on 4 components) Graduation Plan Calculation Number of RHSP/DAP graduates in the Class Number of graduates in the Class Rounded to nearest decimal place(for example, 59.87% is rounded to 59.9%) 71
68 Index 4: Postsecondary Readiness Postsecondary Component: College-Ready Graduates High school graduates from the school year who met the college-ready criteria in both ELA and mathematics based on: TAKS exit-level test*, or the SAT test, or the ACT test Reported on AEIS and TAPR since 2007 * graduates are TAKS graduates Student groups: All students Seven race/ethnicity groups Minimum size: All students: no minimum size; small numbers analysis if less that 10 graduates Student groups: 25 graduates Proposed Additions for 2015: Enrolled &Completed Advanced Course/Dual Enrollment Courses Completed Career & Technical Education (CTE) coherent sequence Enrolled in TX Institute of Higher Education (IHE) 72

69 Overall Index Score Example 4.6: Index 4 Calculation Overall Performance Component Score Multiply by Weight of Total Points STAAR Postsecondary Readiness Score 30.3 X 25% 7.6 Graduation Rate Score 78.1 X 25% 19.5 Graduation Plan Score 81.4 X 25% 20.4 Postsecondary Indicator Score 80.3 X 25% 20.1 Index 4: Score 68 Indicator All Students African Amer. Amer. Indian Asian Hispanic Pacific Islander White Two or More Races ELL Special Ed. Total Points Max. Points STAAR Postsecondary Readiness Standard [Eight groups: All students and Seven Race/Ethnicities] % Meeting Postsecondary Readiness 29% 16% 40% 23% 38% 36% Standard STAAR Postsecondary Readiness Standard: Score (total points divided by maximum points) 182/600 = 30.3 Graduation Rate [Ten Groups: All Students, Seven Race/Ethnities, English Language Learners and Special Education] 4-yr. Graduation Rate 5-yr. Graduation Rate 84.30% 78.80% 78.80% 91.60% 86.00% 44.20% 69.80% % 78.80% 80.00% 92.10% 84.00% 48.90% 77.50% Highest Graduation Rate: Score Graduation Rate: Score (best of total graduation points divided by maximum points) 546.4/700 = 78.1 Graduation Plan [Eight groups: All students and Seven Race/Ethnicities] Longitudinal 82.70% 76.40% 83.60% 83.00% RHSP/DAP Rate / 400 RHSP/DAP: Score (total RHSP/DAP points divided by maximum points) 81.4 = Postsecondary Indicator [Eight groups: All students and Seven Race/Ethnicities] College-Ready 82% 72% 78% 89% Graduates Postsecondary Indicator: Score (total points divided by maximum points) 321 / 400 = 80.3
70 Index 4: Postsecondary Readiness Index 4: AEA Campuses and Charters 2015 AEA Index 4 4-, 5-, and 6-year Graduation, Continuing Students, and GED Score; If no Graduation, Continuing, and GED Rates, use Grade 9-12 Annual Dropout Rate: Points given for rates lower than 20.0 Contrib. to Points 75% STAAR Score: STAAR Percent Met Final Level ll on one or more tests 25% AEA Graduation Rate Calculation Expand AEA Registration to include Dropout Recovery centers Number of Graduates + Continuers + GED Recipients in the Class Number of Students in the Class (Graduates + Continuers + GED Recipients + Dropouts) 74
71 Index 4: Postsecondary Readiness AEA Bonus Points Index 4: AEA Campuses and Charters Bonus Points 2014 AEA Bonus Points Maximum of 30 points Bonus Points: RHSP/DAP Longitudinal Rate Annual if Longitudinal not available College-Ready Graduates Indicator Excluded Students Count Students statutorily excluded from graduation and dropout calculations 75
72 Index 4: Postsecondary Readiness 2014 AEA Bonus Points Maximum 30 points Index 4: AEA Excluded Students Credit Calculation Graduates, continuers, and GED recipients from 4-year graduation cohort without exclusions (federal rate) of most current cohort (Class of 2013) - Graduates, continuers, and GED recipients from 4-year graduation cohort with exclusions (state rate) of most current cohort (Class of 2013) With a floor of zero State graduation excludes (88)court ordered GED and (89)incarcerated students that have not graduated Federal graduation includes them 76
73 System Safeguards

74 Index 1: Student Achievement All Students, All Subjects All Students American Indian Special Education Two or More Races Hispanic ELL Pacific Islander Economically Disadvantaged African American Asian White Index 1 System Safeguards All Students African Amer. Amer. Indian Asian Hispanic Pacific Islander White Two or More Races Eco. Disadv. ELL (Current & monitored) Special Ed. 78
75 2014 Accountability System Safeguards 2015 Federal performance rate is 83% (ESEA waiver) 2015 no 2% cap only the 1% cap for Alternate Accountability Manual page
76 Distinction Designations
77 2014 Distinction Designations Campuses only: Top 25 %: Student Progress (based on Index 2) Top 25%: Closing Performance Gaps (based on Index 3) Academic Achievement in: Reading/English Language Arts Mathematics Science Social Studies Campuses and Districts: Postsecondary Readiness Per Texas Education Code (TEC) , alternative education campuses (AECs) evaluated under AEA provisions are not eligible for distinction designations Accountability Manual page 53 81

78 Index 2 & Index 3 82Distinction Designations
79 Other Areas of Accountability
80 Legislative Changes - 83rd Texas Legislature Community and Student Engagement HB 5 Section 46 Beginning with the school year, districts will be required to evaluate community and student engagement for the district and each of their campuses and assign a rating. The ratings are required to be reported to TEA by August 8, Accountability Ratings HB 5 Section 44 Beginning with the school year, TEA is required to assign ratings of A, B, C, D, or F to districts, and ratings of exemplary, recognized, acceptable, or unacceptable to campuses. Districts will be required to assign a performance rating of exemplary, recognized, acceptable, or unacceptable based on locally determined criteria. These performance ratings must be based on criteria developed by a local committee. The agency is not permitted to determine the criteria that can be used for these evaluations. For the school year, TEA will collect the locally-determined ratings in the summer 2014 PEIMS Submission 3 for the district and each campus in the district. TEA will report these ratings publicly by October 1, HB 5 Section 46 Posted for Public Comment ended May 5 The due date to Education Service Center, Region 20 was June 19,
81 Other areas of Accountability PBM** DVM AMAOs 2014 Performance Based Monitoring: Bilingual (BE)/English as s Second Language (ESL) [10 indicators*] Career and Technology (CTE) [9 indicators*] No Child Left Behind (NCLB - Title I and Migrant) [10 indicators*] Special Education (SPED) [22 indicators*] Data Validation Monitoring: Leaver Discipline Student Assessment Annual Measurable Achievement Objectives AMAO 1: Progress AMAO 2: Attainment AMAO 3: Federal Accountability Public Release of Data Staging Not Public Not Public Not Public SPP State Performance Plan Public Release FIRST Financial Integrity Rating System of Texas Public Release Accredited Accredited - Warned Accreditation Accredited - Probation Public Release Not Accredited - Revoked *Proposed for 2014 **Triggers On Site Visits
82 2014 Performance Based Monitoring [PBM] Bilingual (BE)/English as a Second Language (ESL) 1) BE STAAR 3-8 Passing Rate (M, R, S, SS, W) 2) ESL STAAR 3-8 Passing Rate (M, R, S, SS, W) 3) LEP (Not Served in BE/ESL) STAAR 3-8 Passing Rate (M, R, S, SS, W) 4) LEP Year-After-Exit (YAE) STAAR 3-8 Passing Rate (M, R, S, SS, W) 5) LEP STAAR EOC Passing Rate (M, R, S, SS, W) 6) LEP Annual Dropout Rate (Grades 7-12) 7) LEP RHSP/DAP Diploma Rate 8) LEP Graduation Rate 9) TELPAS Reading Beginning Proficiency Level 10) TELPAS Composite Ratings for Students in U.S. Schools Multiple Years Limited English Proficient (LEP) Recommended High School Plan/Distinguished Achievement Plan (RHSP/DAP) 86
83 2014 Performance Based Monitoring [PBM] Career and Technology [CTE] 1) CTE STAAR EOC Passing Rate (M, R, S, SS, W) 2) CTE LEP STAAR EOC Passing Rate (M,R, S, SS, W) 3) CTE Economically Disadvantaged STAAR EOC Passing Rate (M,R, S, SS, W) 4) CTE SPED STAAR EOC Passing Rate (M,R, S, SS, W) 5) CTE Annual Dropout Rate (Grades 9-12) 6) CTE RHSP/DAP Diploma Rate 7) CTE Graduation Rate 8) CTE Nontraditional Course Completion Rate Males 9) CTE Nontraditional Course Completion Rate Females Limited English Proficient (LEP) Special Education (SPED) Recommended High School Plan/Distinguished Achievement Plan (RHSP/DAP) 87
84 2014 Performance Based Monitoring [PBM] No Child Left Behind [NCLB] 1) Title I, Part A STAAR 3-8 Passing Rate (M, R, S, SS, W) 2) Title I, Part A STAAR EOC Passing Rate (M, R, S, SS, W) 3) Title I, Part A Annual Dropout Rate (Grades 7 12) 4) Title I, Part A RHSP/DAP Diploma Rate 5) Title I, Part A Graduation Rate 6) Migrant STAAR 3-8 Passing Rate (M, R, S, SS, W) 7) Migrant STAAR EOC Passing Rate (M, R, S, SS, W) 8) Migrant Annual Dropout Rate (Grades 7 12) 9) Migrant RHSP/DAP Diploma Rate 10) Migrant Graduation Rate Recommended High School Plan/Distinguished Achievement Plan (RHSP/DAP) 88
85 2014 Performance Based Monitoring [PBM] Special Education [SPED] 1) SPED STAAR 3-8 Passing Rate (M, R, S, SS, W) 2) SPED YAE STAAR 3-8 Passing Rate (M, R, S, SS, W) 3) SPED STAAR EOC Passing Rate (M, R, S, SS, W) 4) SPED STAAR Participation Rate 5) SPED STAAR Modified Participation Rate 6) SPED STAAR Alternate Participation Rate 7) SPED Placements in Instructional Settings 40/41 (Ages 3-5) 8) SPED Regular Early Childhood Program Rate (Ages 3-5)(Report Only) 9) SPED Regular Class > 80% Rate (Ages 6 11) 10) Regular Class < 40% Rate (Ages 6 11) 11) Regular Class > 80% Rate (Ages 12 21) 12) Regular Class < 40% Rate (Ages 12 21) 13) SPED Annual Dropout Rate (Grades 7 12) 14) SPED RHSP/DAP Diploma Rate 15) SPED Graduation Rate 16) SPED Representation 17) SPED African American (Non-Hispanic/Latino) Representation 18) SPED Hispanic Representation 19) SPED LEP Representation 20) SPED Discretionary DAEP Placements 21) SPED Discretionary ISS Placements 22) SPED Discretionary OSS Placements Special Education (SPED) Year-After-Exit (YAE) Recommended High School Plan/Distinguished Achievement Plan (RHSP/DAP) Limited English Proficient (LEP) 89
86 Data Validation Monitoring [DVM]
87 Data Validation Monitoring [DVM] 2014 District Leaver Data Validation posted on TEASE Indicators: 1) Leaver Data Analysis 2) Underreported Students (Grades 7 12) 3) Use of Leaver Codes by Districts with No Dropouts codes 16, 24, 60, 81 and 82 collectively 4) Use of One or More Leaver Reason Codes Codes 03, 16, 24, 60, 66, 78, 81, 82, 83, 85, 86, 87 and 90 5) Use of Certain Dropout Reason Codes Codes 88 and 89 6) Missing PET Submission (Start of School Year) between August 18, 2014 and September 19, ) Missing PET Submission ( Reporting Year) Date range August 19, 2013 through June 30, ) Continuing Students Dropout Rate (Class of 2012), as of Fall
88 Data Validation Monitoring [DVM] District 2014 Discipline Data Validation posted on TEASE Indicators: 1) Length of Out-of-School Suspension (OSS) 2) Length of In-School Suspension (ISS)(Report Only) 3) Unauthorized Expulsion: Students Age 10 and older 4) Unauthorized Expulsion: Students Under Age 10 5) Unauthorized DAEP Placement: Students Under Age 6 6) High Number of Discretionary DAEP Placements 7) African American (not Hispanic/Latino) Discretionary DAEP Placements 8) Hispanic Discretionary DAEP Placements 9) No Mandatory Expellable Incidents Reported for Multiple Years 92
89 Data Validation Monitoring [DVM] 2014 District Student Assessment Data Validation posting on TEASE December Indicators were: 1) STAAR 3-8 Absent Rate (Mathematics) 2) STAAR 3-8 Absent Rate (Reading) 3) STAAR 3-8 Absent Rate (Science) 4) STAAR 3-8 Absent Rate (Social Studies) 5) STAAR 3-8 Absent Rate (Writing) 6) STAAR 3-8 Other Rate (Mathematics) 7) STAAR 3-8 Other Rate (Reading) 8) STAAR 3-8 Other Rate (Science) 9) STAAR 3-8 Other Rate (Social Studies) 10) STAAR 3-8 Other Rate (Writing) 11) TELPAS Reading Absent Rate 12) TELPAS Reading Other Rate 13) STAAR EOC Test Participation Rate Indicator #13 evaluates discrepancies between course completion data and STAAR EOC test participation 14) Discrepancy between PEIMS Career and Technical Education (CTE) Status and STAAR EOC Answer Documents Submitted 93
90 Annual Measurable Achievement Objectives [AMAOs]
91 AMAOs 2013 AMAO Guide November 2013 To the Administrator Addressed Letter December 17, 2013 AMAO 1: Progress AMAO 2: Attainment AMAO 3: Federal Accountability (System Safeguards) 95
92 State Performance Plan (SPP)
93 State Performance Plan (SPP) In alignment with The Individuals with Disabilities Education Act of 2004 (IDEA 2004), Section 616(b), the US Department of Education Office of Special Education Programs (OSEP) has identified five monitoring priorities within the SPP: 1) Free Appropriate Public Education in the Least Restrictive Environment 2) Disproportionality 3) Child Find 4) Effective Transition 5) General Supervision 97
94 Financial Integrity Rating System of Texas (FIRST)
95 FIRST The purpose of the financial accountability rating system (Texas Administrative Code (TAC), Title 19, ) is to ensure that school districts and open-enrollment schools are held accountable for the quality of their financial management practices and achieve improved performance in the management of their financial resources. 99
96 ACCREDITATION

97 Accreditation Statuses Accreditation Matrix 101 Page 39-47
98 Assessment & Accountability

99 Answer document Accountability 103

100 What is your role? Ensure testing environment Irregularities Answer documents drive accountability Principal checklist for testing 104
101 It s the law! Test Security Supplement
102 Test Security Supplement It s the law! Page 4 The superintendent and campus principal of each school district and chief administrative officer of each charter school and any private school administering the tests as allowed under TEC , must develop procedures to ensure the security and confidentiality of the tests specified in the TEC, Chapter 39, Subchapter B. These administrators will be responsible for notifying TEA in writing of conduct that violates the security or confidentiality of a test administered under the TEC, Chapter 39, Subchapter B. Failure to report can subject the person responsible to the applicable penalties. Principals and campus test coordinators are responsible for security and confidentiality of test materials on their campus.
103 Test Administrator Manuals Testing runs January December New manuals will arrive by February 20, 2015

104 Accommodations Allowable Accommodations Accommodations Triangle Linguistic Accommodations
105 STAAR Data Sources
106 STAAR Data Files: April Grades 5 & 8 Reading Grades 3 8 May Grades 5 & 8 Reading Retest EOC results STAAR Results Summer 2014, Fall 2014 and Spring 2015 TELPAS Consolidated Accountability File (CAF) July? (only a data file) What arrives? Confidential Student Reports (CSRs) Summary Reports Data file eduphoria DMAC Other software Calendar of Events parent notification
107 Grades 3-8 including STAAR, STAAR L, STAAR A and STAAR Alternate 2 Spring 2015 Grades 3 8 Spring 2015 Grades 3 5 STAAR Spanish Grades 5 & 8 April and May results included Grades 3-8 Math will only be raw scores EOC including STAAR, STAAR L, STAAR A and STAAR Alternate 2 (First time testers and re-testers) Fall 2014 Summer 2014 Spring 2015 STAAR Results
108 Performance Standards State Assessments and Benchmarks
109 Pass/Fail Culture
110 Performance Indexes Phase-in 1 Level II Final (Recommended) Level II Level III Advanced STAAR Progress Measure ELL Progress Measure New Phase-in letter August 21, 2014
111 Performance Indexes Index 1 Student Achievement (R/W/M/S/SS) Index 2 Student Progress (R/M/W) Index 3 Closing Performance Gaps (R/W/M/S/SS) Index 4 Final Level II on two or more tests (R/W/M/S/SS) Phase in 1 Level II X X Final Recommended Level II ELLs English STAAR YIS = nd point X Advanced Level III X STAAR Progress Measure X ELL Progress Measure ELLs English STAAR YIS = 2-4 ELLs English STAAR YIS = 2-4 ELLs English STAAR YIS = point YIS - Years in U.S. Schools as reported on 2014 TELPAS Exclusion T ELLs YIS = 1 ELLs YIS = 1 ELLs YIS = 1 ELLs YIS = 1 ELL English STAAR YIS = 2-4

112 Index Index Index Index Index Index Index Index
 Index 4 (on 2 or more tests) Level III Advanced")
113 Raw Score changes with each test administration Scale Score remains the same across test administrations Raw Score Conversions Phase-in 1, Level II Index 1 & 3 Final Level II (2022) Index 4 (on 2 or more tests) Level III Advanced Index 3
114
115
116 Assessment and Accountability: Making the Connection Texas Assessment Conference February 16, 2015 from 8:30 11:30 a.m. Cheri Hendrick Accountability and Assessment Specialist, School Support Education Service Center, Region 20, San Antonio, TX (210)
DATA VALIDATION MONITORING
 DATA VALIDATION MONITORING Kim Gilson. Senior Consultant Data And Accountability Region 10 ESC [email protected] 972.348.1480 Today s Objectives: Discuss the relationship between Data Validation
2. The AEC must be identified in AskTED (the Texas School Directory database) as an alternative campus.
 as an alternative campus.") 2. The AEC must be identified in AskTED (the Texas School Directory database) as an alternative campus. 3. The AEC must be dedicated to serving students at risk of dropping out of school as defined in
2. The AEC must be identified in AskTED (the Texas School Directory database) as an alternative campus. 3. The AEC must be dedicated to serving students at risk of dropping out of school as defined in
2014-15 Texas Academic Performance Report (TAPR) Ennis ISD
 Ennis ISD") 2014-15 Texas Academic Performance Report (TAPR) Ennis ISD Changes to this Year s Report STAAR Grades 3 8 Mathematics, STAAR A, and STAAR Alternate 2 (all grades and subjects) These results are excluded
2014-15 Texas Academic Performance Report (TAPR) Ennis ISD Changes to this Year s Report STAAR Grades 3 8 Mathematics, STAAR A, and STAAR Alternate 2 (all grades and subjects) These results are excluded
Texas Academic Performance Report (TAPR) 2013-14 Roosevelt ISD
 2013-14 Roosevelt ISD") Texas Academic Performance Report (TAPR) 213-14 Roosevelt ISD Presented to Board of Trustees on January 12, 215 District Responsibilities for TAPR in Statute Hearing for Public Discussion Must be held
Texas Academic Performance Report (TAPR) 213-14 Roosevelt ISD Presented to Board of Trustees on January 12, 215 District Responsibilities for TAPR in Statute Hearing for Public Discussion Must be held
2013-14 Texas Academic Performance Report (TAPR) Greenville ISD. Danna Myers Chief Academic Officer January 2015
 Greenville ISD. Danna Myers Chief Academic Officer January 2015") 213-14 Texas Academic Performance Report (TAPR) Greenville ISD Danna Myers Chief Academic Officer January 215 1 214 TAPR Content District/Campus Performance STAAR Performance at Phase-in Satisfactory Standard
213-14 Texas Academic Performance Report (TAPR) Greenville ISD Danna Myers Chief Academic Officer January 215 1 214 TAPR Content District/Campus Performance STAAR Performance at Phase-in Satisfactory Standard
Name: Phone Number: To be eligible for state funding, a student in the bilingual or ESL education program must meet the following requirements:
 Section 6 Bilingual/ as a Second Language (ESL) This section addresses unique provisions for bilingual and ESL education programs. These provisions must be applied in conjunction with the general rules
Chapter 10 Federal Accountability
 Chapter 10 Federal Accountability Elementary and Secondary Education Act (ESEA) and No Child Left Behind (NCLB) The Elementary and Secondary Education Act (ESEA) was first passed by Congress in 1965 as
Comal ISD 2013-2014 Bilingual & ESL Program Evaluation. Where Excellence is an Attitude!
 Comal ISD 2013-2014 Bilingual & ESL Program Evaluation Texas Administrative Code Chapter 89. Adaptations for Special Populations Subchapter BB. Commissioner's Rules Concerning State Plan for Educating
Allen Elementary School
 Allen Elementary School April 4, 216 Dear Parents and Community Members: We are pleased to present you with the (AER), which provides key information on the 214-15 educational progress for the. The AER
SB 149 - Individual Graduation Committees Frequently Asked Questions
 SB 149 - Individual Graduation Committees Frequently Asked Questions 1. Are all students eligible to receive an Individual Graduation Committee review? Only students who are classified in grade 11 or 12
School Performance Framework: Technical Guide
 School Performance Framework: Technical Guide Version 1.6 August 2010 This technical guide provides information about the following topics as they related to interpreting the school performance framework
State of Texas Assessments of Academic Readiness (STAAR TM ) Questions and Answers (Q&As) Updated March 9, 2012
 Questions and Answers (Q&As) Updated March 9, 2012") State of Texas Assessments of Academic Readiness (STAAR TM ) Questions and Answers (Q&As) Updated March 9, 2012 [As policies are finalized, these Q&As will be updated. Updates are marked with.] Note that
State of Texas Assessments of Academic Readiness (STAAR TM ) Questions and Answers (Q&As) Updated March 9, 2012 [As policies are finalized, these Q&As will be updated. Updates are marked with.] Note that
Texas Education Agency 2014 15 Federal Report Card for Texas Public Schools
 Part I: Student Achievement by Proficiency Level Texas Education Agency 2014 15 Federal Report Card for Texas Public Schools Campus Name: AIKIN EL Campus ID: 057916135 District Name: RICHARDSON ISD This
State of New Jersey 2014-15
 Page 1 of 22 OVERVIEW COUNTY VOCATIONAL GRADE SPAN 0912 1.00 313995050 WAYNE, NJ 074702210 The New Jersey Department of Education (NJDOE) is pleased to present these annual reports of Performance. These
Texas Education Agency 2013-14 Federal Report Card for Texas Public Schools State
 Texas Education Agency 2013-14 Federal Report Card for Texas Public Schools State Part I: Percent Tested and Student Achievement by Proficiency Level This section provides the State of Texas Assessments
Student Success Initiative Manual
 Student Success Initiative Manual Grade-Advancement Requirements Update for the 2014 2015 School Year Cover photography: From top, Pathathai Chungyam/fotolia.com; Glenda Powers/fotolia.com; moodboard/
Chapter 5 English Language Learners (ELLs) and the State of Texas Assessments of Academic Readiness (STAAR) Program
 and the State of Texas Assessments of Academic Readiness (STAAR) Program") Chapter 5 English Language Learners (ELLs) and the State of Texas Assessments of Academic Readiness (STAAR) Program Demographic projections indicate that the nation s English language learner (ELL) student
Chapter 5 English Language Learners (ELLs) and the State of Texas Assessments of Academic Readiness (STAAR) Program Demographic projections indicate that the nation s English language learner (ELL) student
Annual Measurable Achievement Objectives (AMAOs) Title III, Part A Accountability System
 Title III, Part A Accountability System") 2010 AMAOs Guide Annual Measurable Achievement Objectives (AMAOs) Title III, Part A Accountability System Texas Education Agency Department of School Improvement and Support Division of NCLB Program Coordination
2010 AMAOs Guide Annual Measurable Achievement Objectives (AMAOs) Title III, Part A Accountability System Texas Education Agency Department of School Improvement and Support Division of NCLB Program Coordination
Frequently Asked Questions Regarding ELL Programs
 1. What is the requirement to have a bilingual education program or a special language program in Texas? Each district with an enrollment of 20 or more students of limited English proficiency in any language
District % of Students Met Standard (Proficient) and Commended (Advanced) State % of Students Met Standard (Proficient) and Commended (Advanced)
 and Commended (Advanced) State % of Students Met Standard (Proficient) and Commended (Advanced)") Texas 2012 NCLB Report Card Part I Preview C O N F I D E N T I A L 14 Part I - Campus Level: Student Performance for Each District Campus Compared to the State, Percent of, Student Achievement by Proficiency
Texas 2012 NCLB Report Card Part I Preview C O N F I D E N T I A L 14 Part I - Campus Level: Student Performance for Each District Campus Compared to the State, Percent of, Student Achievement by Proficiency
Florida Department of Education Bureau of Exceptional Education and Student Services. 2016 LEA Profile. Introduction
 Bureau of Exceptional Education and Student Services Pam Stewart Commissioner 2016 LEA Profile Introduction : Enrollment Group: PK-12 Population: Percent Disabled: Alachua 20,000 to 40,000 29,320 13% The
ILLINOIS SCHOOL REPORT CARD
 17-2-15-2-24 Lincoln Elem Clinton CUSD 15 Clinton, ILLINOIS GRADES : 2 3 2 1 3 Lincoln Elem 1 ILLINOIS SCHOOL REPORT CARD and federal laws require public school districts to release report cards to the
Snyder ISD Implementation of Bilingual and English as a Second Language Programs
 Snyder ISD Implementation of Bilingual and English as a Second Language Programs Revised 2012 Snyder Independent School District 2901 37 th Street Snyder, TX 79549 325-573- 5401 This school district and
Enrollment in Texas Public Schools 2013-14
 Enrollment in Texas Public Schools 2013-14 Statewide Enrollment, Texas Public Schools, 1987-88 Through 2013-14 5.5 5.0 Enrollment (in Millions) 4.5 4.0 3.5 3.0 1987-88 1989-90 1991-92 1993-94 1995-96 1997-98
GUNTER ISD ENGLISH AS A SECOND LANGUAGE (ESL) PROCEDURES MANUAL
 PROCEDURES MANUAL") GUNTER ISD ENGLISH AS A SECOND LANGUAGE (ESL) PROCEDURES MANUAL TABLE OF CONTENTS INTRODUCTION OBJECTIVES OF MANUAL PROGRAM DESCRIPTION FUNDING SOURCES LPAC ELIGIBILITY TESTING AND CLASSIFICATION MEETINGS
GUNTER ISD ENGLISH AS A SECOND LANGUAGE (ESL) PROCEDURES MANUAL TABLE OF CONTENTS INTRODUCTION OBJECTIVES OF MANUAL PROGRAM DESCRIPTION FUNDING SOURCES LPAC ELIGIBILITY TESTING AND CLASSIFICATION MEETINGS
Chapter 3 The College- and Career-Readiness Component of the State of Texas Assessments of Academic Readiness (STAAR) End-of-Course (EOC) Program
 End-of-Course (EOC) Program") Chapter 3 The College- and Career-Readiness Component of the State of Texas Assessments of Academic Readiness (STAAR) End-of-Course (EOC) Program With the enactment of House Bill (HB) 3, the legislature
Chapter 3 The College- and Career-Readiness Component of the State of Texas Assessments of Academic Readiness (STAAR) End-of-Course (EOC) Program With the enactment of House Bill (HB) 3, the legislature
CURRICULUM. Texas Association of School Administrators
 HB 5 Aycock Accountability, Assessment, and Curriculum Requirements Due to the dense content of HB 5, the following summary is organized into four broad categories: (1) curriculum, (2) assessment, (3)
Brazos School for Inquiry and Creativity
 English as a Second Language (ESL) January 2013 It is the policy of the Brazos School for Inquiry and Creativity not to discriminate on the basis of race, color, national origin, sex or handicap in its
GRANDVIEW INDEPENDENT SCHOOL DISTRICT ENGLISH AS A SECOND LANGUAGE POLICY AND PROCEDURES
 GRANDVIEW INDEPENDENT SCHOOL DISTRICT ENGLISH AS A SECOND LANGUAGE POLICY AND PROCEDURES ESL PROGRAM GOAL and MISSION The goal of the English as a Second Language (ESL) program in Grandview ISD is to enable
TAPR Overview. AEIS was published from 1990-91 to 2011-12. Archived AEIS reports may be found on the AEIS Archives page through TEA
 Texas Academic Performance Report (TAPR) 213-14 Diboll ISD TAPR Overview Due to changes in legislation, the performance report formerly known as the Academic Excellence Indicator System (AEIS) report is
Medina Valley ISD Program for English Language Learners. Bilingual/ESL Program Procedures Guide
 Medina Valley ISD Program for English Language Learners Bilingual/ESL Program Procedures Guide i Table of Contents Annual Critical Events Calendar Page iii Rationale.. Page 1 Philosophy... Page 1 Mission
ESL HANDBOOK. CCISD ESL Handbook/01/11/2011/Curr/TBG
 ESL HANDBOOK State Goals Chapter 89.1201 Adaptations for Special Populations Subchapter BB. Commissioner's Rules Concerning State Plan for Educating Limited English Proficient Students The goal of English
Alliance Environmental Science and Technology High
 Alliance Environmental Science and Technology High Melissa Chew, Principal Principal, Alliance Environmental Science and Technology High About Our School About Our School Environmental Science and Technology
State of Texas Assessments of Academic Readiness (STAAR) Frequently Asked Questions For Parents and Students
 Frequently Asked Questions For Parents and Students") State of Texas Assessments of Academic Readiness (STAAR) Frequently Asked Questions For Parents and Students Table of Contents STAAR GENERAL QUESTIONS... 2 STAAR END-OF-COURSE (EOC) TESTS FOR HIGH SCHOOL
State of Texas Assessments of Academic Readiness (STAAR) Frequently Asked Questions For Parents and Students Table of Contents STAAR GENERAL QUESTIONS... 2 STAAR END-OF-COURSE (EOC) TESTS FOR HIGH SCHOOL
Data Housed at the North Carolina Education Research Data Center
 Data Housed at the North Carolina Education Research Data Center District-level data Community Index Data, Year 2004 Each file has one record per Local Education Agency with the percent of students (a)
AEIS was published from 1990-91 to 2011-12. Archived AEIS reports may be found on the AEIS Archives page through TEA
 Due to changes in legislation, the performance report formerly known as the Academic Excellence Indicator System (AEIS) report is now the Texas Academic Performance Report (TAPR) AEIS was published from
Bryan Middle School. Bryan Middle School. Not Actual School Data. 100 Central Dr Anywhere, DE 19900 (555) 555-5555. Administration.
 555-5555. Administration.") O Hare School District Emma Haviland 100 Central Dr Anywhere, DE 19900 (555) 555-5555 Administration Principal Assistant Principal Assistant Principal Emma Haviland Stan Westfield Barbara Powell Accountability
O Hare School District Emma Haviland 100 Central Dr Anywhere, DE 19900 (555) 555-5555 Administration Principal Assistant Principal Assistant Principal Emma Haviland Stan Westfield Barbara Powell Accountability
Cardiff Elementary School School Accountability Report Card Reported Using Data from the 2010 11 School Year
 Cardiff Elementary School School Accountability Report Card Reported Using Data from the 2010 11 School Year Published During 2011 12 Every school in California is required by state law to publish a School
KIPP Scholar Academy. Tiffany Moore, Principal. 1729 West Martin Luther King Jr. Blvd. Los Angeles, CA 90062
 KIPP Scholar Academy Tiffany Moore, Principal Principal, KIPP Scholar Academy About Our School About Our School Tiffany Moore is the Founding School leader of KIPP Scholar Academy. Before opening KSA,
Atrisco Heritage Academy High
 District: Albuquerque Public s Grade Range: 0912 Code: 1576 Grade Report Card 20112012 inal Grade D Performance in ath and Reading Current Standing How did your students perform in the most recent school
MARSHALL INDEPENDENT SCHOOL DISTRICT BILINGUAL & ENGLISH AS A SECOND LANGUAGE EDUCATION PROGRAM
 MARSHALL INDEPENDENT SCHOOL DISTRICT BILINGUAL & ENGLISH AS A SECOND LANGUAGE EDUCATION PROGRAM Marshall ISD Bilingual/ESL Program Handbook Page 1 Table of Contents Page District Vision 3 Position Statement
Bilingual /ESL Education
 South San Antonio Independent School District Bilingual / ESL / Title III Education Department 5622 Ray Ellison Drive, San Antonio, TX 78242 210-977-7080 Bilingual /ESL Education Program Overview Instructional
Bangor Central Elementary School 2014-2015 Annual Education Report
 Bangor Central Elementary School 24-25 Melissa Vrable; Principal March 23, 26 Dear Parents and Community Members: We are pleased to present you with the (AER) which provides key information on the 24 5
Introduction: Online school report cards are not new in North Carolina. The North Carolina Department of Public Instruction (NCDPI) has been
 has been") Introduction: Online school report cards are not new in North Carolina. The North Carolina Department of Public Instruction (NCDPI) has been reporting ABCs results since 1996-97. In 2001, the state General
Introduction: Online school report cards are not new in North Carolina. The North Carolina Department of Public Instruction (NCDPI) has been reporting ABCs results since 1996-97. In 2001, the state General
District Accountability Handbook Version 3.0 September 2012
 District Accountability Handbook Version 3.0 September 2012 Colorado Department of Education Page 1 The purpose of this handbook is to provide an outline of the requirements and responsibilities for state,
BILINGUAL/ESL EDUCATION PROGRAM
 GOOSE CREEK CONSOLIDATED INDEPENDENT SCHOOL DISTRICT BILINGUAL/ESL EDUCATION PROGRAM PK 12th Unity through Language Mission Statement The mission of the Goose Creek CISD Bilingual/ESL Education Program
The State of Texas Assessment of Academic Readiness
 The State of Texas Assessment of Academic Readiness Parent Information Meeting Presented By Dr. Jodi Duron February 2012 A WALK DOWN MEMORY LANE TABS 1979 Exit level test question in 9 th Grade (3rd grade
Texas Continuous Improvement Process Public Input and Information Meetings
 Texas Continuous Improvement Process Public Input and Information Meetings 2008-09 Statewide Summary of Regional Feedback Texas Continuous Improvement Process Texas Education Agency Division of IDEA Coordination
State of New Jersey 2013-14
 1 OVERVIEW 21314 GRADE SPAN 912 31411 15 PARK AVENUE PATERSON, NJ 751 1. This school's academic performance significantly lags in comparison to schools across the state. Additionally, its academic performance
Orange County High 201 Selma Road, Orange, VA 22960
 State Accreditation Results for All Students This table summarizes the data used in calculating the state accreditation status of the school and is reported for the "all students" group. Proficiency Gap
State of New Jersey 2012-13
 1 OVERVIEW GRADE SPAN 912 395262 SCOTCH PLAINS, NEW JERSEY 776 1. This school's academic performance is very high when compared to schools across the state. Additionally, its academic performance is very
Elmhurst Community Prep
 Elmhurst Community Prep California Department of Education School Accountability Report Card Reported Using Data from the 2013-14 School Year Published During 2014-15 Every school in California is required
Advanced Program Information The percentage of students enrolled in advanced programs is a key indicator of school quality at the secondary level.
 Virginia Department of Education P.O. Box 2120, Richmond, VA 23218 Superintendent: Dr. Steven R. Staples 1-800-292-3820 The is committed to providing a quality education for all students. The Virginia
California Department of Education. School Accountability Report Card. Reported Using Data from the 2013-14 School Year. Published During 2014-15
 Marin County Special Education California Department of Education School Accountability Report Card Reported Using Data from the 2013-14 School Year Published During 2014-15 Every school in California
Sky Mountain Charter Eric Schoffstall A o b u o t u t O u O r u r S c S h c o h o o l C n o t n a t c a t
 Sky Mountain Charter Eric Schoffstall Principal, Sky Mountain Charter About Our School About Our School Sky Mountain is an Independent Study Charter School that is managed by Innovative Education Management,
Public Hearing Presented at the Van ISD January 19, 2015 School Board Meeting
 Public Hearing Presented at the Van ISD January 19, 215 School Board Meeting Due to changes in legislation, the performance report formerly known as the Academic Excellence Indicator System (AEIS) report
North Carolina Testing Program
 Guidelines for Testing Students Identified as Limited English Proficient Published August 2013 Public Schools of North Carolina www.ncpublicschools.org State Board of Education Department of Public Instruction
Dallas ISD Testing Schedule, 2014-2015 Mandated Testing (State and District Required)
") APRIL 1, 2015 Dallas ISD Testing Schedule, 2014-2015 Mandated Testing (State and District Required) August 25, 2014 June 5, 2015 Potential LEP Woodcock Muñoz Language Survey Revised (WMLS-R) (Ongoing)
APRIL 1, 2015 Dallas ISD Testing Schedule, 2014-2015 Mandated Testing (State and District Required) August 25, 2014 June 5, 2015 Potential LEP Woodcock Muñoz Language Survey Revised (WMLS-R) (Ongoing)
Dallas Nursing Institute. 12170 N. Abrams Rd, Suite 200, Dallas, TX 75243
 Dallas Nursing Institute 12170 N. Abrams Rd, Suite 200, Dallas, TX 75243 Disclosure of Retention, Graduation and Placement Rates July 1, 2012 Revised January 2012 to include the Accrediting Bureau of Health
John B. King, Jr. Kevin G. Smith SUMMARY
 THE STATE EDUCATION DEPARTMENT / THE UNIVERSITY OF THE STATE OF NEW YORK / ALBANY, NY 12234 TO: FROM: SUBJECT: P-12 Education/Adult Career and Continuing Education Services (ACCES) Joint Committee John
South Sutter Charter. Mr. Eric Schoffstall, Director. 2452 El Centro Blvd. East Nicolaus, CA 95659-9748
 South Sutter Charter Mr. Eric Schoffstall, Director Principal, South Sutter Charter About Our School About Our School South Sutter is an Independent Study Charter School that is managed by Innovative Education
For Canyon View School
 Executive Summary School Accountability Report Card, 200 For Canyon View School Address: 760 W. Cypress Avenue Phone: (909) 599-227 ext: 2623 Principal: John Mann Grade Span: K-2 This executive summary
INSTITUTIONAL REPORT FOR CONTINUING ACCREDITATION: CONTINUOUS IMPROVEMENT PATHWAY. Name of Institution Dates/Year of the Onsite Visit
 INSTITUTIONAL REPORT FOR CONTINUING ACCREDITATION: CONTINUOUS IMPROVEMENT PATHWAY Name of Institution Dates/Year of the Onsite Visit Insert Name(s) of Unit Head/Author(s) NCATE IR Template for Continuing
Running Start Program Application Information
 Running Start Program Application Information Running Start for High School Seniors Running Start is a program offered at the Community College of Rhode Island for high school students who demonstrate
MT. SAN JACINTO COLLEGE ASSOCIATE DEGREE IN NURSING LVN-RN APPLICATION www.msjc.edu/alliedhealth
 www.msjc.edu/alliedhealth Filing Period: September 1 st September 15 th It is the student s responsibility to request and ensure that all documents are in the Nursing & Allied Health Office by the application
Dual Credit Legislative Update
 Dual Credit Legislative Update Andrew Lofters, Ph.D. Program Director Academic Quality and Workforce July 17, 2015 Dual Credit Statute & Rules Texas Education Code (TEC) 130.008 Outlines how agreements
66.1 59.9. District: LITTLESTOWN AREA SD AUN: 112015203 Test Date: PSSA Spring 2015. English Language Arts. Mathematics 46.8 39.7. Science 75.5 67.
 PENNSYLVANIA System of School Assessment (PSSA) Summary Report Dear Leader: This report provides you with information about your district's performance in English Language Arts, Mathematics, and Science