DEVELOPMENT OF A WEATHER YIELD INDEX (WYX) FOR
|
|
|
- Elizabeth Dean
- 7 years ago
- Views:
Transcription
1 DEVELOPMENT OF A WEATHER YIELD INDEX (WYX) FOR MAIZE CROP INSURANCE IN MALAWI Adams Chavula Agrometeorologist, FAO-SDRN Consultant 1 and René Gommes Senior Agrometeorologist, FAO-SDRN March Adams Chavula was funded by the WB FAO Partnership fund.

2 1. Introduction The Commodity Risk Management Group (CRMG) of the World Bank has developed a prototype Malawi Maize Production Index (MMPI), constructed from weather data recorded by the Malawi Meteorological Office weather stations throughout the country, to capture maize production levels in Malawi. The aim is to find a simple and objective indicator that can be used as a proxy measure of the countrywide exposure of Malawi maize production to drought and hence serve as a nation-wide food security indicator on which an insurance agreement could be written for the Government of Malawi (GoM). However, this indicator turned out to be relatively poorly linked with crop yields. FAO proposed to use the tools included in the FAO AgroMetShell (AMS) software 2 to derive an effective weather-based maize yield index (WYX, Weather Yield index) that could be used for crop insurance purposes in Malawi. AMS computes a crop specific water balance to derive value-added crop-weather variables that can be combined with other data (e.g. remote sensing inputs, farm inputs such as fertilizer use) and statistically related with crop yield using standard multiple regression techniques 3. Value-added crop-weather variables are variables such as actual evapotranspiration that are know to be more meaningful than raw meteorological variables; see, for instance, the documents listed in footnote 3 for theory and references. The technical cooperation programme between World Bank and FAO also included a visit by an Agro-meteorologist from the Malawi Department of Meteorological Services (DoMS) to Rome (Italy) for a period of three months under the WB-FAO Partnership Programme to work on the procedure to be implemented. Based on the work of Hess and Syroka (2004) 4 and French (2004) 5, as well as the discussions the second author held in Blantyre and Lilongwe (in particular with DoMS), an index used for crop insurance should have the following characteristics: Tamper-resistance: potential beneficiaries of the insurance should not be in a position to directly or indirectly manipulate the index. Objectivity: once the methodology has been defined in precise enough terms, the index value should be independent on who carries out the calculations. Good correlation with crop yield: A poor year is defined as a year in which conditions are bad enough to trigger the payment of claims to insurance subscribers. A poor year can be defined based on three approaches at least: (1) absolute yield levels (possibly the most appropriate choice for food security), (2) a percentage of the average local yield (a fair choice as expectations are different in high potential and low potential areas and (3) probability of exceeding of a specific yield (this usually gives good results in 2 ftp://ext-ftp.fao.org/sd/sdr/agromet/agrometshell/ 3 General methodological information can be found under ftp://extftp.fao.org/sd/sdr/agromet/documents/, especially documents agro005a.pdf and agro003a.pdf. 4 Weather Based Insurance against covariate shocks in Southern Africa, Food Security and Weather Risk Management in SADC, Focus on Malawi. Report prepared for SADC Secretariat by Ulrich Hess and Joanna Syroka, CRMG/ARD (2004). 5 Pre-Feasibility Analysis of Index-Based Drought Insurance in Malawi, unpublished report by Vicky French, available from FAO/ESCG (2004) 2
. However, this indicator turned out to be relatively poorly linked with crop yields.")
3 terms of statistical significance). Rather than the statistical strength of the correlation between yield and crop weather index, it is the number of false positives (good year assessed to be poor) and false negatives (poor year assessed as good) that constitutes the most important criteria. Some guidance will be needed from ARD/CRMG on: (i) the definition of a poor year and on the criteria to be adopted for test the goodness of the methodology; (ii) if the required index has to incorporate yield reductions due to water excess. Insensitivity to missing data: the best way to circumvent the occurrence of missing spatial data is to use gridded information that is not too sensitive to individual missing stations, provided sufficient data points are available and the interpolation process takes into account topography and climatic gradients. Publicity: the methodology has to be made available to potential subscribers of the insurance. Crop insurance indices will be published regularly in national agrometeorological bulletins and other channels as well as on the website of Malawi Department of Meteorological Services.. 3
 the definition of a poor year and on the criteria to be adopted for test the goodness of the methodology; (ii) if the required index has to")
4 4

5 2. Methodological overview 1) Verify stationarity of time series of meteorological data after 1990: no trend changes occurred during the calibration period (4.2); 2) Derive pseudo-penman equation to be able to compute Potential Evapotranspiration (PET) for all the years of the calibration period (4.1); 3) Define best strategy to determine planting dates based on actual phenological reports (4.6); 4) Determine optimal spatial interpolation technique and compute 556 dekad rainfall grids (46 stations from ) and 376 PET (22 stations from ) grids at a resolution of approximately 5 km (4.4); 5) In the AgroMetShell (AMS) software, create a grid of 3928 points covering the whole country at a resolution of approx 5 km (4.5); 6) Determine altitude of 3928 points, crop cycle lengths and planting dates (based on crop type and elevation), and read rainfall and PET values (point 4 above) into the AMS database (4.5, 4.6); 7) Compute water balance for the 3928 points from 1994/94 to 2004/2005 (4.6, 4.6, 4.7); 8) Spatialise water balance parameters using Satellite Enhanced Data Interpolation (SEDI) with NOAA NDVI as background images. The water balance parameters mainly include Water Satisfaction Index WSI 6, actual evapotranspiration, water stress and water deficit for phenological phases and the whole crop cycle (4.8); 9) Extract spatial EPA averages of the water balance parameters from the above-mentioned maps (see 8 above) (4.9 and 4.10) 10)Build a calibration matrix of approximately 1365 lines that includes all the spatially averaged water balance parameters (see point 9) and the average EPA yields. The matrix mixes time-series and cross sectional data, i.e. it is made up by 11 years times 154 EPAs. Missing data include 2003 and 2004 plus some others missing; 11)Create spatially continuous maps of average (reference) yields in Malawi (one for local maize and one for hybrids (4.11 and 4.12); 12)Identify groups of independent variables in calibration matrix through Principal Components Analysis (PCA), and use the variables with the highest correlation with the first components as test explanatory variables; 13)Derive regression equations for local and hybrid maize (5.1 and 5.2) and verify statistical validity of equations (5.3). 6 The FAO WSI is a classical crop monitoring index that expresses the percentage of actual crop water requirements that have actually been met. WSI normally varies from 0 to
; 4) Determine optimal spatial interpolation technique and compute 556 dekad rainfall grids (46 stations from 1990-2005) and 376 PET (22 stations from1995-2005) grids at a resolution of")
6 6

7 7

8 3. input data The weather data used in developing a weather-based Maize Yield index (WYX) for Malawi were collected from the Department of Meteorological Services (DoMS), crop and yield data from the Ministry of Agriculture (MoA) through Malawi National Early Warning Unit (NEWU) and Remote Sensing data obtained from FAO/ARTEMIS and through the Southern Africa Development Community (SADC) Regional Remote Sensing Unit (RRSU) in Gaborone, Botswana. Specifically, the data collected included the following: a) Long-term ( ) monthly data on Rainfall, Maximum and Minimum temperatures from 22 synoptic stations to carry out a proper trend analysis. The objective was to ensure that the period used to calibrate the WYX is climatically homogeneous; b) January to December dekadal (10-day period) data on Rainfall, Maximum and Minimum temperatures and Wind Speed from January1990 May 2005, Sunshine hours from January , Relative Humidity January 1995 May 2005 from 22 full meteorological stations; c) January to December dekadal rainfall data from 1990 May 2005 from 24 rainfall stations; d) Maize phenology data (planting, flowering, maturity) compiled from the Extension Planning Area (EPA) reports collected using the fortnightly phenological reporting forms designed under the Malawi National Early Warning Unit (NEWU) for 1992/93, 1993/94, 1995/96., 1996/97 and 1998/99 growing seasons. The purpose of the data is to ensure that the planting dates determined from the tools in AMS are realistic; e) Reference data such as soil Water Holding Capacity (WHC), Crop Phenology and Crop Cycle lengths; f) Area (Ha) and yield (Kg per Ha) data for Maize by Extension Planning Area (EPA) from 1984 to 2005; g) National Oceanic Atmospheric Administration (NOAA) Normalized Difference Vegetation Index (NDVI) dekadal images for Malawi country window from The images were used for the spatial interpolation of water balance outputs using the Satellite Enhanced Data Interpolation (SEDI) technique. See Section 4.8 for details. 8
 Long-term (1961-2005) monthly data on Rainfall, Maximum and Minimum temperatures from 22 synoptic stations to carry out a proper trend")
9 4. Tools and details of methodology 4.1 Potential Evapotranspiration: the pseudo-penman Missing data characterize most of the real world. For instance, from 2004 there are no radiation data in Malawi due to unavailability of the charts needed to record sunshine hours with the Campbell-Stokes Sunshine recorder. This affected the computation of actual Potential Evapotranspiration (PET) using the conventional Penman-Monteith method which requires sunshine hours. Therefore, a simplified PET Method that does not utilise sunshine hours had to be developed. The pseudo-penman equation that was eventually adopted for Malawi is the following (PE in mm/mth): pseudo-penman = * RH * wind * Tmax * Tmin This performs significantly better than the Blaney-Criddle and the Hargreaves methods. The coefficient of determination is This was therefore, used to compute actual dekadal PET values (mm per dekad) for 22 full meteorological stations. Complete data for PET computations were only available for the period Prior to this period relative humidity data were not available at most stations. 4.2 Trends in the time series Southern Africa has apparently been undergoing some climatic trend changes in the last decades or two, in particular with the 1991/92 El Niño and the associated drought, a very rare occurrence in the region over the previous decades. It is, therefore, important to ensure that the time period used for the calibration of crop forecasting methods is devoid of any significant trends that can invalidate the results 7. As regards precipitations, one observes little change in the monthly long-term series of the stations of Chileka, Chitedze, Mzimba, Salima and Thyolo that were selected for the analysis of the stationarity 8. In Chileka one observes a significant increase in the in January rainfall, starting in , the average passing from 181,2 mm to 238,3 mm. In Thyolo, one also observes an increase in the rainfall in 1984, the average passing from 203,9 mm to 302,2 mm and a fall of the rain in October 1989, the average passing from 44,2 mm to 18,8 mm. The changes for temperatures are more significant. In general the key-years for the changes of the minimum temperatures are 1982 or between 1986 and For the maximum ones, the majority of the changes generally take place between 1980 and The analyses were kindly carried out by Marc Vandiepenbeeck of the Belgian Meteorological Service. 8 Stationarity means that there has been no significant change in the average or time trend over the period considered corresponds to the maximum of the drought in the Sahel, confirming the negative correlation between Sourthern and Western African rainfall ( 9

10 10
11 This confirms that rainfall and temperatures are indeed stationary for the period used for the calibration of the maize yield index ( ). 4.3 Software tools In this study FAO SDRN (Environment and Natural Resources Service) software tools namely, New_LocClim, AgroMetShell (AMS) and WinDisp 10 were extensively used. All of them are easy to use, public domain software, developed and maintained by FAO and its cooperating partners. New_LocClim was developed to provide an estimate of climatic conditions at locations for which no observations are available. New_LocClim provides nine different interpolation methods that can be compared with respect to pre-given spatial fields. It allows for an extensive investigation of interpolation errors and the influence of different settings on the results. This allows optimising the interpolation with respect to the data analysed. Furthermore, statistical analysis of the interpolated spatial fields is provided and detailed analysis for single geographic points can be drawn. Windisp is a software package for the display and analysis of satellite images, maps and associated databases. WinDisp was originally developed for the FAO Global Information and Early Warning System. AgroMetShell is a software tool designed to support crop forecasting. The central part of the software is formed by the Crop Water Balance calculations. Based on rainfall, Evapotranspiration and crop data AgroMetShell can calculate if and when a crop experienced water shortage, eventually leading to reduced crop yields. 4.4 Preparation of climate weather grids Climate and weather data were collected from 22 full meteorological stations and 24 rainfall stations located throughout Malawi. Figure 1 shows elevation and distribution of the forty six (46) weather stations. The data were systematically gridded (spatialised) before any water balance calculations were conducted 11. This has the main advantages of (1) providing nation-wide coverage (as opposed to stations with a limited are of spatial representativeness) and (2) significantly reducing the potential negative impact of missing data. Dekadal spatial grids with a resolution of 0.05 degrees latitude and longitude (approximately 5 km) were created using New_LocClim software. The data were reformatted to fit the format required by New_LocClim. New_LocClim requires the data to be formatted by Longitude, Latitude, Altitude and value. Therefore 36 dekadal spatial grid files were made in each year from January 1990 December 2004 and 16 files during Sample maps showing actual dekadal rainfall and PET grids are given in figure 3. For this study, among the interpolation methods available in New LocClim, the Kriging method was selected because it produced minimal mean- 10 All are available from the ftp site indicated above for AMS. 11 This represents a very significant amount of work... 11

12 square errors between grid estimates and station data. Kriging method provided the best results with the following settings: Grid Co-ordinates: Longitude from: 32.5 to 36 Latitude from : to -9 Grid size: 0.05 (approximately 5Km) Shadow correction performed. Weight: 1 Darkness: 1 Breadth: 1 No negative interpolated values permitted. Maximum Number of Stations used: 5 Maximum Distance of Stations used: 300 km, and 400 Km for PET grids only. PET grids were created for the period only. The grids were exported from New LocClim to WinDisp images. Image headers were edited for uniform slope and intercept values using ad hoc tools 12. All dekadal rainfall images were formatted to a slope of 2.37 and an intercept of 0 while the slope for PET images was 0.5 with an intercept of 0. Dekadal Rainfall and actual PET images were later imported into a grid-based station list created in AgroMetShell database (see section 3.5 below). 4.5 Creation of station list in AgroMetShell A grid-based station list was created using Tools Create Station list from grid function and a boundary map of Malawi (MW_ADM1.BNA) in AgroMetShell. The list was named Malawi Grid. The stations were created at a resolution of 0.05 degrees latitude and longitude (approximately 5 km). The process generated a total of 3928 monitoring points within the borders of Malawi. Most of weather and climate data needed to analyse the impact of weather on crop yields were imported into a Malawi Grid in AgroMetShell database from WinDisp images. Dekadal rainfall and PET data for each year were imported from dekadal rainfall and PET images respectively. Similarly normal dekad rainfall and PET data were imported from normal dekadal rainfall and PET images. Station altitude data were imported from Southern Africa Altitude image (Sa_Alt.img). Crop data were imported from crop parameter file which contains data on soil water holding capacity, effective rainfall, the planting dekad, the cycle length, pre-season crop coefficient and irrigation data if needed. Crop cycle length data was imported by assigning values to the Southern Africa Altitude image. In Malawi for calculation of FAO Crop Specific Water Balance, the Crop cycle for local and composite maize is taken as 12 dekads or 120 days for elevation of up to 800m and 14 dekads or 140 days for elevation of higher than 800m. Similarly, the crop cycle for hybrid maize is taken as 10 dekads for elevation of up to 800m and 12 dekads for elevation of higher than 800m. Water Holding Capacity (WHC) of the soil was assumed at 50 mm. 12 See Two independent implementations of a slope/intercept changer for IDA images 12

13 13

14 4.6 Definition of Planting Dekad Reported average planting dates for maize were summarised by EPA for 1992/93, 1993/94, 1995/96., 1996/97 and 1998/99 seasons. Analysis of the data showed variations in planting periods from one season to another. Based on this information in most EPAs observed average planting dekad for maize was found to occur when the rising rangeland-index (RI) curve crossed the 40% threshold. Therefore, in AgroMetShell the planting dekad for maize was defined based on a rangeland-index of 40% between October in one year and February the following year. The "rangeland-index" (RI) is the classic FAO water satisfaction index WSI computed for periods of 5 dekads, with normal Evapotranspiration kept at potential level (KCR=1) and an assumed WHC of 50 mm. Similar to moving averages, the value assigned to a dekad corresponds to the five-dekad period centred about that dekad. Effective rain (Efrain) was assumed to be 100%. Effective rain is a percentage by which actual rain is multiplied to assess actual water supply. Usually Efrain is less than 100% on slopes and Efrain more than 100% in low lying areas. A pre-season crop coefficient (Kcr) of 0.3 was used. The model is run for rain fed crops only therefore irrigation data were not required. The values of irrigation and the height of the bund for irrigated crops were entered as Running FAO Crop Specific Water Balance model The FAO Water Balance model was prepared to monitor growth and development of two maize crops in Malawi namely, local+composite (simply referred to as local in this report) and hybrid for each season from to The Crop cycle for local and composite maize was 12 dekads for elevation of up to 800m and 14 dekads for elevation of higher than 800m. Similarly, the crop cycle for hybrid maize was 10 dekads for elevation of up to 800m and 12 dekads for elevation of higher than 800m. 4.8 Making images from water balance model outputs Calculations of water balance model in AgroMetShell (AMS) were done on a point grid with a resolution of 0.05 degrees latitude and longitude, as indicated above. The results of water balance model in AMS are saved in the summary dekad output file. The water balance variables were converted into images with maximum and average NOAA NDVI images during each season as background images to guide spatial interpolation 13 (see 4.10). In each season maximum NOAA NDVI image was used to guide interpolation of water excess images over the phenological phases described as initial, vegetative, flowering, ripening, and whole cycle (sum of previous values). Similarly, an average NOAA NDVI image was used to guide interpolation of water deficit images described as initial, vegetative, flowering, ripening, and total for whole cycle (sum of previous values), actual Evapotranspiration and actual crop Evapotranspiration images over the phenological phases and the value totalled over the growing season. 4.9 Extracting average statistics by Extension Planning Area (EPA) in WinDisp The FAO Crop Specific Water Balance model produced various water balance parameters for the various stages for growth and development of maize for each 13 The Satellite Enhanced Data Interpolation (SEDI) function of AMS was used. 14

15 season from 1994/95 to 2004/2005. The variables included excess soil water, actual Evapotranspiration, soil water deficit over the initial, vegetative, flowering and ripening stages. Other products included total water requirement and water requirement satisfaction index at the time of monitoring as well as at the end of the growing season. EPA wide average statistics were extracted from images of the various water balance parameters using the Process statistics function and an EPA boundary map in WinDisp. Eventually the average statistics for the various water balance parameters were calibrated against average EPA maize yields for two maize crops in Malawi namely, local+composite and hybrid using Microsoft excel. Relationships between various water balance parameters and EPA maize yields were established. Significant variables were selected for final regression models. In this study local+composite is modelled as local maize (LMZ) while hybrid as hybrid maize (HMZ). The original selection of the variables was done through a Principal Components Analysis 14 (PCA) Creating seasonal Maximum and Average NDVI images in WinDisp Maximum NOAA NDVI image for each growing season was created using Process - Series - Max function in WinDisp. Dekadal NOAA NDVI images for Malawi for the period October to May were used in the series Creating EPA Average Co-ordinates in WinDisp Maize yields from 1984 to 2005 were presented in Malawi old Extension Planning Area (EPA) format. EPA average maize yields for the series were calculated. The coordinates for the centre of gravity of each EPA polygon were computed. A file with EPA central point latitudes and longitudes and average yields was created Creating Average Yield Image Map in New LocClim The average yield image map was created in by using EPA central point coordinates and average yields and a grid with a resolution of 0.05 degrees latitude and longitude. The average yield (Yavg) image map for each crop was used in the final maize yield index forecasting equation. 14 When the results of the current work were presented to a group of statisticians and economists in Rome, they suggested that the first PCs could be used instead of the agrometeorological variables. While recognising that the suggestion is a very sound one from a statistical point of view (independence of explanatory variables), the authors prefer to use the variables that display the highest correlation with the first Pcs. The main reason for that is to retain some control over the meaning of the variables. 15

16 5. Results of yield calibration 5.1 Local Maize Average EPA maize yields were regressed against selected significant variables, mixing cross-sectional and time series data. This results in about 1350 observations corresponding to the number of EPAS times the number of annual yield values (per EPA). The regression coefficients and other related statistical data are shown in Table 1. The table also shows the number of observations, number of degrees of freedom, standard error of average maize yield estimates (Yavg) and standard errors of the regression variables. Table 1: The regression coefficients used to forecast local maize yield (Ycal(local)) with relation to average yields, total water deficit and excess, Evapotranspiration at vegetative stage and water deficit at vegetative stage. SUMMARY OUTPUT Regression Statistics Multiple R R Square Adjusted R Square Standard Error Observations ANOVA df SS MS F Significance of F Regression Residual Total Coefficients Standard Error t Stat P-value Lower 95% Upper 95% Intercept #N/A #N/A #N/A #N/A #N/A Yavg DEFtot WEXtot ETAveg DEFveg Therefore, the final Malawi local maize forecasting equation is, for each pixel, Yield= *Yavg *DEFtot *WEXtot *ETAveg *DEFveg where Yield is the weather based yield index for local maize, Yavg is average yield for local maize, DEFtot is total water deficit, WEXtot is total water excess, ETAveg is Evapotranspiration at vegetative stage and DEFveg is water deficit at vegetative stage. The required average local maize yield image was created in New LocClim and converted into a WinDisp image. The size and projection parameters of this image were different from others that were created in AMS. Therefore, the yield image was rescaled using one of the images that were created in AMS as a reference image. Pixel-based maize yield index maps covering the whole country with a resolution of 0.05 degrees latitude and longitude (approximately 5 km) were produced for each 15 For regressions through the origin, R and Rsquare are meaningless. Actual values are those given in figure 5. 16
 and standard errors of the regression variables.")

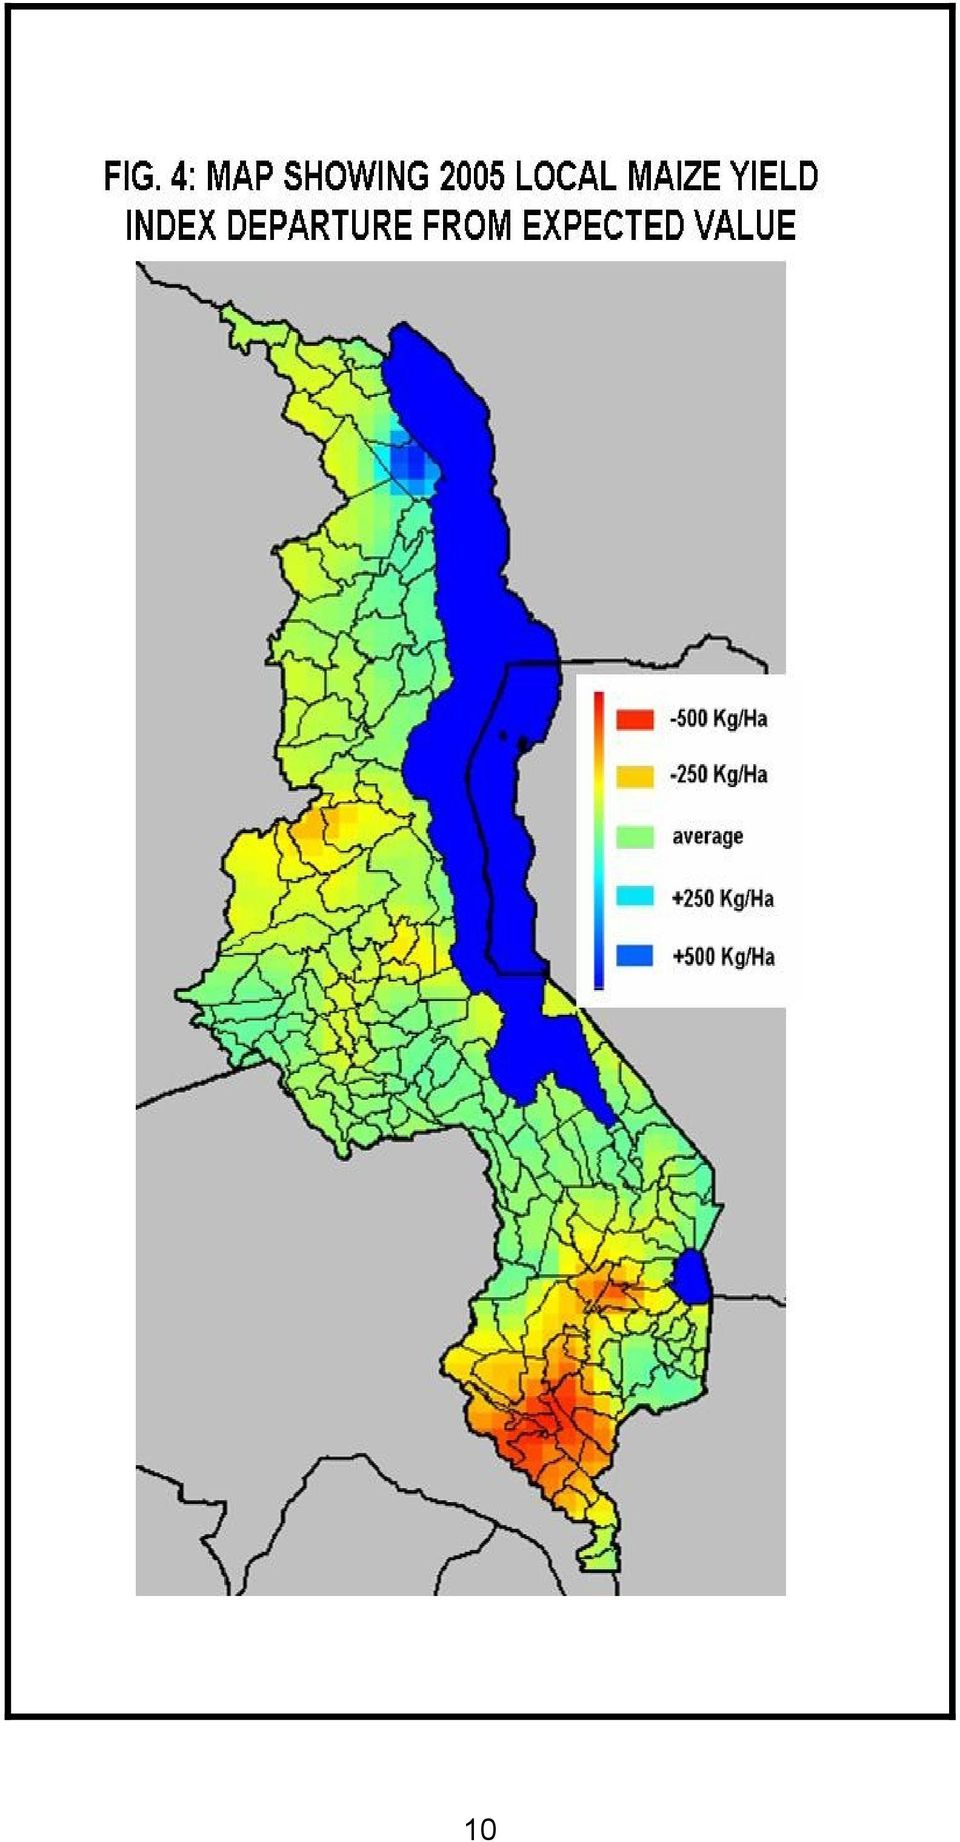
17 season from 1994/95 to 2004/2005 using Tools Image Calculations with formula in AgroMetShell. In this case the final Malawi local maize forecasting equation was used in the calculations. EPA average local maize yield indices were extracted using WinDisp. The results were compared against actual average and EPA yields reported by Ministry of Agriculture. Summary of the results are presented in figures 5 and 6. Maize yield index maps will be produced and updated every ten days. 5.2 Hybrid maize For hybrid maize, the following equation was derived Yield/Yavg= Year-2E-05Year WRSIfin-0.008ETAtot+1.2E-05 ETAtot 2 where Yield is the weather based yield index for hybrid maize, Yavg is average yield for hybrid maize, Year is the year for which the calculations are done, WRSIfin is the Water satisfaction index computed for the end of the crop cycle and ETAtot is the total ETA over the cycle. Figure 6: hybrid maize yields by EPA Vs estimated yields Compared with local maize, the main differences include the following: both Year and ETAtot appear with a quadratic term. This non-linearity corresponds to a slight downward trend of hybrid maize yields, while such a trend was absent from local 17

18 maize. Regarding ETA, the effect of this variable on yields is negative, with a minimum (maximum negative effect) that occurs around 350 mm, corresponding to the average of EPA observations. Altogether, the main and dominant variable is the water satisfaction index. The table below shows the regression statistics Table 2: regression coefficients used to forecast hybrid maize yield with relation to average yields, time trend, ETATtot and final water satisfaction index WRSIfin. 5.3 Validation Very detailed validation was done for local maize. No statistically significant values of the regression coefficients were found for the following situations: coefficients are computed with the whole data set of 1365 observations coefficients are computed with early years and late years (data sorted according to time, and split in the middle OF THE DATA SET) the data set is randomly split in two halves This indicates the stability over time and across EPAs of the derived equations. 18

19 6. Conclusions The methodology has demonstrated the possibility of producing weather based maize yield index for Crop Insurance for any point in Malawi every ten days starting from planting time. Real-time pixel based maize yield indices covering the whole country with a resolution of 0.05 degrees latitude and longitude can be objectively produced. The methodology is repeatable by anybody who has access to basic weather data. The methodology uses gridded information that is not too sensitive to individual missing stations, provided sufficient data points are available and the interpolation process takes into account topography and climatic gradients. The methodology is temper-resistant, potential beneficiaries of the insurance are not in a position to directly or indirectly manipulate the yield index. Therefore, the developed maize yield index satisfies all the desirable criteria for maize crop insurance in Malawi. First estimates of Index can be provided at planting time and updated in real time throughout the season. However, the index needs to be refined using criteria to be provided by insurance experts. More specific products for crop insurance can be prepared, and the methodology can easily be extended to other crops. 19

Making an image using altitude as background image
 Try to re-do the previous exercise with different settings under Distance in Km between gridlines, Maximum interpolation radius (in Km), Minimum number of nearest stations and Maximum number of nearest
World Water and Climate Atlas
 International Water Management Institute World Water and Climate Atlas Direct access to water and climate data improves agricultural planning The IWMI World Water and Climate Atlas provides rapid access
CLIMWAT 2.0 for CROPWAT
 CLIMWAT 2. for CROPWAT Giovanni Muñoz and Jürgen Grieser FAO of the UN, Viale delle Terme di Caracalla, 1 Rome, Italy Contact Giovanni.Munoz@fao.org September 26 CLIMWAT 2. for CROPWAT is a joint publication
Index Insurance for Climate Impacts Millennium Villages Project A contract proposal
 Index Insurance for Climate Impacts Millennium Villages Project A contract proposal As part of a comprehensive package of interventions intended to help break the poverty trap in rural Africa, the Millennium
Basic Climatological Station Metadata Current status. Metadata compiled: 30 JAN 2008. Synoptic Network, Reference Climate Stations
 Station: CAPE OTWAY LIGHTHOUSE Bureau of Meteorology station number: Bureau of Meteorology district name: West Coast State: VIC World Meteorological Organization number: Identification: YCTY Basic Climatological
Weather Index Crop Insurance. White Paper. Implementation, Product Design, Challenges And Successes Lessons Learned In The Field
 White Paper Weather Index Crop Insurance Implementation, Product Design, Challenges And Successes Lessons Learned In The Field By Shadreck Mapfumo, Vice President, Agriculture, MicroEnsure November 2008
Predicting daily incoming solar energy from weather data
 Predicting daily incoming solar energy from weather data ROMAIN JUBAN, PATRICK QUACH Stanford University - CS229 Machine Learning December 12, 2013 Being able to accurately predict the solar power hitting
MONITORING OF DROUGHT ON THE CHMI WEBSITE
 MONITORING OF DROUGHT ON THE CHMI WEBSITE Richterová D. 1, 2, Kohut M. 3 1 Department of Applied and Land scape Ecology, Faculty of Agronomy, Mendel University in Brno, Zemedelska 1, 613 00 Brno, Czech
Armenian State Hydrometeorological and Monitoring Service
 Armenian State Hydrometeorological and Monitoring Service Offenbach 1 Armenia: IN BRIEF Armenia is located in Southern Caucasus region, bordering with Iran, Azerbaijan, Georgia and Turkey. The total territory
Monitoring Global Crop Condition Indicators Using a Web-Based Visualization Tool
 Monitoring Global Crop Condition Indicators Using a Web-Based Visualization Tool Bob Tetrault, Regional Commodity Analyst, and Bob Baldwin, GIS Specialist, USDA, Foreign Agricultural Service, Washington,
Traditional Products. The two Traditional Crop Insurance Products are: Named Peril Crop Insurance (NPCI) Multi Peril Crop Insurance (MPCI)
 Multi Peril Crop Insurance (MPCI)") Traditional Products Traditional crop insurance relies on the principle of indemnity, where losses are measured in the field either after the event (named peril crop insurance) or through yield measurement
Traditional Products Traditional crop insurance relies on the principle of indemnity, where losses are measured in the field either after the event (named peril crop insurance) or through yield measurement
South Africa. General Climate. UNDP Climate Change Country Profiles. A. Karmalkar 1, C. McSweeney 1, M. New 1,2 and G. Lizcano 1
 UNDP Climate Change Country Profiles South Africa A. Karmalkar 1, C. McSweeney 1, M. New 1,2 and G. Lizcano 1 1. School of Geography and Environment, University of Oxford. 2. Tyndall Centre for Climate
DESIGNING WEATHER INSURANCE CONTRACTS FOR FARMERS
 DESIGNING WEATHER INSURANCE CONTRACTS FOR FARMERS In Malawi, Tanzania and Kenya Excerpts from final report to the Commodity Risk Management Group, ARD, World Bank June 2007 Download the full report here:
Deficit Rainfall Insurance Payouts in Most Vulnerable Agro Climatic Zones of Tamil Nadu, India
 Deficit Rainfall Insurance Payouts in Most Vulnerable Agro Climatic Zones of Tamil Nadu, India S.Senthilnathan, K.Palanisami, C.R.Ranganathan and Chieko Umetsu 2 Tamil Nadu Agricultural University, Coimbatore,
Fire Weather Index: from high resolution climatology to Climate Change impact study
 Fire Weather Index: from high resolution climatology to Climate Change impact study International Conference on current knowledge of Climate Change Impacts on Agriculture and Forestry in Europe COST-WMO
GLOBAL INFORMATION AND EARLY WARNING SYSTEM ON FOOD AND AGRICULTURE (GIEWS)
") GLOBAL INFORMATION AND EARLY WARNING SYSTEM ON FOOD AND AGRICULTURE (GIEWS) S P E C I A L A L E R T No. 336 REGION: Southern Africa DATE: Delayed onset of seasonal rains in parts of Southern Africa raises
GLOBAL INFORMATION AND EARLY WARNING SYSTEM ON FOOD AND AGRICULTURE (GIEWS) S P E C I A L A L E R T No. 336 REGION: Southern Africa DATE: Delayed onset of seasonal rains in parts of Southern Africa raises
Land Use/Land Cover Map of the Central Facility of ARM in the Southern Great Plains Site Using DOE s Multi-Spectral Thermal Imager Satellite Images
 Land Use/Land Cover Map of the Central Facility of ARM in the Southern Great Plains Site Using DOE s Multi-Spectral Thermal Imager Satellite Images S. E. Báez Cazull Pre-Service Teacher Program University
Monthly Agromet Bulletin National Agromet Centre Pakistan Meteorological Department Islamabad
 Monthly Bulletin FEBRUARY, 2016 Monthly Agromet Bulletin National Agromet Centre Pakistan Meteorological Department Islamabad Vol: 02-2016 FEBRUARY, 2016 Highlights Below normal rainfall reported in most
dynamic vegetation model to a semi-arid
 Application of a conceptual distributed dynamic vegetation model to a semi-arid basin, SE of Spain By: M. Pasquato, C. Medici and F. Francés Universidad Politécnica de Valencia - Spain Research Institute
Southern Africa The 2014-2015 Rainfall Season
 Southern Africa The 2014-2015 Rainfall Season HIGHLIGHTS In the early stages (October-November) of the 2014-2015 growing season in Southern Africa significant rainfall deficits and delayed starts to the
Application of Numerical Weather Prediction Models for Drought Monitoring. Gregor Gregorič Jožef Roškar Environmental Agency of Slovenia
 Application of Numerical Weather Prediction Models for Drought Monitoring Gregor Gregorič Jožef Roškar Environmental Agency of Slovenia Contents 1. Introduction 2. Numerical Weather Prediction Models -
Use of numerical weather forecast predictions in soil moisture modelling
 Use of numerical weather forecast predictions in soil moisture modelling Ari Venäläinen Finnish Meteorological Institute Meteorological research ari.venalainen@fmi.fi OBJECTIVE The weather forecast models
Titelmasterformat durch Klicken. bearbeiten
 Evaluation of a Fully Coupled Atmospheric Hydrological Modeling System for the Sissili Watershed in the West African Sudanian Savannah Titelmasterformat durch Klicken June, 11, 2014 1 st European Fully
Pasture, Rangeland, and Forage Insurance: A Risk Management Tool for Hay and Livestock Producers
 October 2012 Pasture, Rangeland, and Forage Insurance: A Risk Management Tool for Hay and Livestock Producers Monte Vandeveer, Otoe County Extension Educator University of Nebraska-Lincoln Institute of
El Niño-Southern Oscillation (ENSO): Review of possible impact on agricultural production in 2014/15 following the increased probability of occurrence
: Review of possible impact on agricultural production in 2014/15 following the increased probability of occurrence") El Niño-Southern Oscillation (ENSO): Review of possible impact on agricultural production in 2014/15 following the increased probability of occurrence EL NIÑO Definition and historical episodes El Niño
El Niño-Southern Oscillation (ENSO): Review of possible impact on agricultural production in 2014/15 following the increased probability of occurrence EL NIÑO Definition and historical episodes El Niño
EXPLANATION OF WEATHER ELEMENTS AND VARIABLES FOR THE DAVIS VANTAGE PRO 2 MIDSTREAM WEATHER STATION
 EXPLANATION OF WEATHER ELEMENTS AND VARIABLES FOR THE DAVIS VANTAGE PRO 2 MIDSTREAM WEATHER STATION The Weather Envoy consists of two parts: the Davis Vantage Pro 2 Integrated Sensor Suite (ISS) and the
4.3. David E. Rudack*, Meteorological Development Laboratory Office of Science and Technology National Weather Service, NOAA 1.
 43 RESULTS OF SENSITIVITY TESTING OF MOS WIND SPEED AND DIRECTION GUIDANCE USING VARIOUS SAMPLE SIZES FROM THE GLOBAL ENSEMBLE FORECAST SYSTEM (GEFS) RE- FORECASTS David E Rudack*, Meteorological Development
DESIGNING WEATHER INSURANCE CONTRACTS FOR FARMERS
 DESIGNING WEATHER INSURANCE CONTRACTS FOR FARMERS In Malawi, Tanzania and Kenya Final report to the Commodity Risk Management Group, ARD, World Bank June 27 Prepared by: Daniel Osgood, Megan McLaurin,
Simple Methods and Procedures Used in Forecasting
 Simple Methods and Procedures Used in Forecasting The project prepared by : Sven Gingelmaier Michael Richter Under direction of the Maria Jadamus-Hacura What Is Forecasting? Prediction of future events
Training session for the. Firm Yield Estimator. Version 1.0. Prepared for the Massachusetts Department of Environmental Protection
 Training session for the Firm Yield Estimator Version 1.0 Prepared for the Massachusetts Department of Environmental Protection June 6, 2000 Firm Yield Estimator - Introduction Software tool for estimating
CLIMATE, WATER & LIVING PATTERNS THINGS
 CLIMATE, WATER & LIVING PATTERNS NAME THE SIX MAJOR CLIMATE REGIONS DESCRIBE EACH CLIMATE REGION TELL THE FIVE FACTORS THAT AFFECT CLIMATE EXPLAIN HOW THOSE FACTORS AFFECT CLIMATE DESCRIBE HOW CLIMATES
Module 3: Correlation and Covariance
 Using Statistical Data to Make Decisions Module 3: Correlation and Covariance Tom Ilvento Dr. Mugdim Pašiƒ University of Delaware Sarajevo Graduate School of Business O ften our interest in data analysis
Scholar: Elaina R. Barta. NOAA Mission Goal: Climate Adaptation and Mitigation
 Development of Data Visualization Tools in Support of Quality Control of Temperature Variability in the Equatorial Pacific Observed by the Tropical Atmosphere Ocean Data Buoy Array Abstract Scholar: Elaina
Indian Research Journal of Extension Education Special Issue (Volume I), January, 2012 161
, January, 2012 161") Indian Research Journal of Extension Education Special Issue (Volume I), January, 2012 161 A Simple Weather Forecasting Model Using Mathematical Regression Paras 1 and Sanjay Mathur 2 1. Assistant Professor,
Indian Research Journal of Extension Education Special Issue (Volume I), January, 2012 161 A Simple Weather Forecasting Model Using Mathematical Regression Paras 1 and Sanjay Mathur 2 1. Assistant Professor,
CLIDATA In Ostrava 18/06/2013
 CLIDATA In Ostrava 18/06/2013 Content Introduction...3 Structure of Clidata Application...4 Clidata Database...5 Rich Java Client...6 Oracle Discoverer...7 Web Client...8 Map Viewer...9 Clidata GIS and
William Northcott Department of Biosystems and Agricultural Engineering Michigan State University. NRCS Irrigation Training Feb 2-3 and 9-10, 2010
 William Northcott Department of Biosystems and Agricultural Engineering Michigan State University NRCS Irrigation Training Feb 2-3 and 9-10, 2010 Irrigation Scheduling Process of maintaining an optimum
Global environmental information Examples of EIS Data sets and applications
 METIER Graduate Training Course n 2 Montpellier - february 2007 Information Management in Environmental Sciences Global environmental information Examples of EIS Data sets and applications Global datasets
ELECTRICITY DEMAND DARWIN ( 1990-1994 )
") ELECTRICITY DEMAND IN DARWIN ( 1990-1994 ) A dissertation submitted to the Graduate School of Business Northern Territory University by THANHTANG In partial fulfilment of the requirements for the Graduate
ELECTRICITY DEMAND IN DARWIN ( 1990-1994 ) A dissertation submitted to the Graduate School of Business Northern Territory University by THANHTANG In partial fulfilment of the requirements for the Graduate
Weather Insurance to Protect Specialty Crops against Costs of Irrigation in Drought Years
 Weather Insurance to Protect Specialty Crops against Costs of Irrigation in Drought Years By Edouard K. Mafoua Post-Doctoral Associate Food Policy Institute Rutgers, The State University of New Jersey
The Economic Impacts of Climate Change: Evidence from Agricultural Profits and Random Fluctuations in Weather: Reply.
 The Economic Impacts of Climate Change: Evidence from Agricultural Profits and Random Fluctuations in Weather: Reply Online Appendix Olivier Deschênes University of California, Santa Barbara, IZA and NBER
Unit 31 A Hypothesis Test about Correlation and Slope in a Simple Linear Regression
 Unit 31 A Hypothesis Test about Correlation and Slope in a Simple Linear Regression Objectives: To perform a hypothesis test concerning the slope of a least squares line To recognize that testing for a
American Society of Agricultural and Biological Engineers
 ASAE S580.1 NOV2013 Testing and Reporting Solar Cooker Performance American Society of Agricultural and Biological Engineers ASABE is a professional and technical organization, of members worldwide, who
Climate and Weather. This document explains where we obtain weather and climate data and how we incorporate it into metrics:
 OVERVIEW Climate and Weather The climate of the area where your property is located and the annual fluctuations you experience in weather conditions can affect how much energy you need to operate your
Environmental Data Services for Delaware:
 Environmental Data Services for Delaware: Serving Emergency Responders, Planners, and Researchers Network Delaware Day November 6, 2013 Overview Operational Data Services More than just research DEOS and
THE ECOSYSTEM - Biomes
 Biomes The Ecosystem - Biomes Side 2 THE ECOSYSTEM - Biomes By the end of this topic you should be able to:- SYLLABUS STATEMENT ASSESSMENT STATEMENT CHECK NOTES 2.4 BIOMES 2.4.1 Define the term biome.
Near Real Time Blended Surface Winds
 Near Real Time Blended Surface Winds I. Summary To enhance the spatial and temporal resolutions of surface wind, the remotely sensed retrievals are blended to the operational ECMWF wind analyses over the
Climate Change risk and Agricultural Productivity in the Sahel
 Climate Change risk and Agricultural Productivity in the Sahel Imed Drine and Younfu Huang World Institute for Development Economics Research, United Nations University UNU WIDER) 1 The Sahel is extremely
Monsoon Variability and Extreme Weather Events
 Monsoon Variability and Extreme Weather Events M Rajeevan National Climate Centre India Meteorological Department Pune 411 005 rajeevan@imdpune.gov.in Outline of the presentation Monsoon rainfall Variability
Session 3 - Innovations in Management of Agricultural and Weather Data
 Session 3 - Innovations in Management of Agricultural and Weather Data Nuno Meira Congrès International sur l'assurance et la réassurance des risques agricoles Marrakech, MAROC 29 au 31 janvier 2014 Agriculture
Rain on Planting Protection. Help Guide
 Rain on Planting Protection Help Guide overview Rain on Planting Protection allows growers to protect themselves from losses if rain prevents planting from being completed on schedule. Coverage is highly
Inputs provided by: 1. General description of mandates and objective(s) of your organization / associated network with institutional structure
 of your organization / associated network with institutional structure") Inputs provided by: Deutsche Gesellschaft für Internationale Zusammenarbeit (GIZ) GmbH 1. General description of mandates and objective(s) of your organization / associated network with institutional structure
Inputs provided by: Deutsche Gesellschaft für Internationale Zusammenarbeit (GIZ) GmbH 1. General description of mandates and objective(s) of your organization / associated network with institutional structure
The impact of window size on AMV
 The impact of window size on AMV E. H. Sohn 1 and R. Borde 2 KMA 1 and EUMETSAT 2 Abstract Target size determination is subjective not only for tracking the vector but also AMV results. Smaller target
Connected Farm Field Services. Dan Rooney InfoAg Conference, July 30, 2014
 Connected Farm Field Services Dan Rooney InfoAg Conference, July 30, 2014 What is Connected Farm? Connected Farm is an integrated operations management solution that combines industry-leading hardware,
1. What is the critical value for this 95% confidence interval? CV = z.025 = invnorm(0.025) = 1.96
 = 1.96") 1 Final Review 2 Review 2.1 CI 1-propZint Scenario 1 A TV manufacturer claims in its warranty brochure that in the past not more than 10 percent of its TV sets needed any repair during the first two years
1 Final Review 2 Review 2.1 CI 1-propZint Scenario 1 A TV manufacturer claims in its warranty brochure that in the past not more than 10 percent of its TV sets needed any repair during the first two years
Use of Geographic Information Systems in late blight warning service in Germany. Kleinhenz, Zeuner, Jung, Martin, Röhrig, Endler
 Use of Geographic Information Systems in late blight warning service in Germany Kleinhenz, Zeuner, Jung, Martin, Röhrig, Endler Structure of ZEPP 14 Crop Protection Services of the German Federal States
Peer review on manuscript "Predicting environmental gradients with..." by Peer 410
 Peer review on manuscript "Predicting environmental gradients with..." by Peer 410 ADDED INFO ABOUT FEATURED PEER REVIEW This peer review is written by Dr. Richard Field, Associate Professor of Biogeography
Practical Uses of Crop Monitoring for Arizona Cotton
 Practical Uses of Crop Monitoring for Arizona Cotton J. C. Silvertooth The use of crop monitoring and plant mapping has received a considerable amount of attention in the cotton production arena in recent
AGRICULTURAL METEOROLOGICAL DATA, THEIR PRESENTATION AND STATISTICAL ANALYSIS
 CHAPTER 3 AGRICULTURAL METEOROLOGICAL DATA, THEIR PRESENTATION AND STATISTICAL ANALYSIS 3.1 INTRODUCTION Agricultural meteorology is the science that applies knowledge in weather and climate to qualitative
Energy Performance Indicators (EnPI) Tim Dantoin Focus on Energy
 Tim Dantoin Focus on Energy") Energy Performance Indicators (EnPI) Tim Dantoin Focus on Energy Learning Objectives Identify and test one or more EnPls. Identify factors that may affect EnPls. Establish an energy baseline. Analyze your
Energy Performance Indicators (EnPI) Tim Dantoin Focus on Energy Learning Objectives Identify and test one or more EnPls. Identify factors that may affect EnPls. Establish an energy baseline. Analyze your
Simple linear regression
 Simple linear regression Introduction Simple linear regression is a statistical method for obtaining a formula to predict values of one variable from another where there is a causal relationship between
Current capabilities in the analysis of climate risks and adaptation strategies in critical areas
 Current capabilities in the analysis of climate risks and adaptation strategies in critical areas M. Arif Goheer Global Change Impact Studies Centre (GCISC) Islamabad- 44000, Pakistan Symposium on Climate
Stage 4. Geography. Blackline Masters. By Karen Devine
 1 Devine Educational Consultancy Services Stage 4 Geography Blackline Masters By Karen Devine Updated January 2010 2 This book is intended for the exclusive use in NSW Secondary Schools. It is meant to
DRAFT REPORT NOT FOR CIRCULATION. Nigeria. Crop Weather Index Insurance. Pre-Feasibility Study Report. November 2011. The World Bank THE WORLD BANK
 DRAFT REPORT NOT FOR CIRCULATION Nigeria Crop Weather Index Insurance Pre-Feasibility Study Report November 2011 The World Bank THE WORLD BANK Table of Contents Executive Summary... iii Context... iii
Catastrophe Bond Risk Modelling
 Catastrophe Bond Risk Modelling Dr. Paul Rockett Manager, Risk Markets 6 th December 2007 Bringing Science to the Art of Underwriting Agenda Natural Catastrophe Modelling Index Linked Securities Parametric
Index Insurance and Climate Risk Management In Malawi:
 Index Insurance and Climate Risk Management In Malawi: Theory and Practice (mostly practice) Presented by Daniel Osgood (IRI) at the 2007 CPASW, Seattle deo@iri.columbia.edu Material contributed by: Miguel
Micro Crop Insurance and Protecting the Poor Lessons From the Field
 Micro Crop Insurance and Protecting the Poor Lessons From the Field Aaron Oxley CTO, Micro Insurance Agency aaron.oxley@microinsuranceagency.com The Program Who are we an what do we do? Who are the poor?
Development of an Integrated Data Product for Hawaii Climate
 Development of an Integrated Data Product for Hawaii Climate Jan Hafner, Shang-Ping Xie (PI)(IPRC/SOEST U. of Hawaii) Yi-Leng Chen (Co-I) (Meteorology Dept. Univ. of Hawaii) contribution Georgette Holmes
An introduction to Value-at-Risk Learning Curve September 2003
 An introduction to Value-at-Risk Learning Curve September 2003 Value-at-Risk The introduction of Value-at-Risk (VaR) as an accepted methodology for quantifying market risk is part of the evolution of risk
Visualizing of Berkeley Earth, NASA GISS, and Hadley CRU averaging techniques
 Visualizing of Berkeley Earth, NASA GISS, and Hadley CRU averaging techniques Robert Rohde Lead Scientist, Berkeley Earth Surface Temperature 1/15/2013 Abstract This document will provide a simple illustration
Comparative Evaluation of High Resolution Numerical Weather Prediction Models COSMO-WRF
 3 Working Group on Verification and Case Studies 56 Comparative Evaluation of High Resolution Numerical Weather Prediction Models COSMO-WRF Bogdan Alexandru MACO, Mihaela BOGDAN, Amalia IRIZA, Cosmin Dănuţ
Using R for Linear Regression
 Using R for Linear Regression In the following handout words and symbols in bold are R functions and words and symbols in italics are entries supplied by the user; underlined words and symbols are optional
Estimating Firn Emissivity, from 1994 to1998, at the Ski Hi Automatic Weather Station on the West Antarctic Ice Sheet Using Passive Microwave Data
 Estimating Firn Emissivity, from 1994 to1998, at the Ski Hi Automatic Weather Station on the West Antarctic Ice Sheet Using Passive Microwave Data Mentor: Dr. Malcolm LeCompte Elizabeth City State University
THE USE OF A METEOROLOGICAL STATION NETWORK TO PROVIDE CROP WATER REQUIREMENT INFORMATION FOR IRRIGATION MANAGEMENT
 THE USE OF A METEOROLOGICAL STATION NETWORK TO PROVIDE CROP WATER REQUIREMENT INFORMATION FOR IRRIGATION MANAGEMENT Reimar Carlesso 1*,, Mirta Teresinha Petry 2, Celio Trois 3 1 Professor of the Agriculture
The AIR Multiple Peril Crop Insurance (MPCI) Model For The U.S.
 Model For The U.S.") The AIR Multiple Peril Crop Insurance (MPCI) Model For The U.S. According to the National Climatic Data Center, crop damage from widespread flooding or extreme drought was the primary driver of loss in
The AIR Multiple Peril Crop Insurance (MPCI) Model For The U.S. According to the National Climatic Data Center, crop damage from widespread flooding or extreme drought was the primary driver of loss in
Comparison of different methods in estimating potential evapotranspiration at Muda Irrigation Scheme of Malaysia
 Journal of Agriculture and Rural Development in the Tropics and Subtropics Vol. 113 No. 1 (2012) 77 85 urn:nbn:de:hebis:34-2012091441739 ISSN: 1612-9830 journal online: www.jarts.info Comparison of different
For Online Publication. Appendix 1: Data. 1. Rainfall Data and Drought
 For Online Publication Appendix 1: Data 1. Rainfall Data and Drought The South African Weather Service http://www.weathersa.co.za/web/ provided the raw historical rainfall data. These data contain monthly
Part 2: Analysis of Relationship Between Two Variables
 Part 2: Analysis of Relationship Between Two Variables Linear Regression Linear correlation Significance Tests Multiple regression Linear Regression Y = a X + b Dependent Variable Independent Variable
The relationships between Argo Steric Height and AVISO Sea Surface Height
 The relationships between Argo Steric Height and AVISO Sea Surface Height Phil Sutton 1 Dean Roemmich 2 1 National Institute of Water and Atmospheric Research, New Zealand 2 Scripps Institution of Oceanography,
Index Insurance in India
 Index Insurance in India Kolli N Rao, PhD Aon Benfield, India Indian Agriculture & Risks What s Index Insurance? Why Index Insurance? The Outline Architecture of Indian Crop Insurance Coverage: The Numbers
MONITORING IRRIGATION SEASON - A SUPPORT TOOL FOR WATER MANAGEMENT AND SHORT-TERM ACTIONS
 OECD WORKSHOP ON IMPROVING THE INFORMATION BASE TO BETTER GUIDE WATER RESOURCE DECISION-MAKING 4-7 May, 2010, Zaragoza MONITORING IRRIGATION SEASON - A SUPPORT TOOL FOR WATER MANAGEMENT AND SHORT-TERM
General and statistical principles for certification of RM ISO Guide 35 and Guide 34
 General and statistical principles for certification of RM ISO Guide 35 and Guide 34 / REDELAC International Seminar on RM / PT 17 November 2010 Dan Tholen,, M.S. Topics Role of reference materials in
2.8 Objective Integration of Satellite, Rain Gauge, and Radar Precipitation Estimates in the Multisensor Precipitation Estimator Algorithm
 2.8 Objective Integration of Satellite, Rain Gauge, and Radar Precipitation Estimates in the Multisensor Precipitation Estimator Algorithm Chandra Kondragunta*, David Kitzmiller, Dong-Jun Seo and Kiran
Formal Insurance, Informal Risk Sharing, and Risk-Taking. A. Mushfiq Mobarak Mark Rosenzweig Yale University
 Formal Insurance, Informal Risk Sharing, and Risk-Taking A. Mushfiq Mobarak Mark Rosenzweig Yale University Background Formal insurance markets largely absent where they are needed 75% of the world s poor
BASIC APPROACH TO CLIMATE MONITORING PRODUCTS AND CLIMATE MONITORING PRODUCTS IN WMO RA VI
 BASIC APPROACH TO CLIMATE MONITORING PRODUCTS AND CLIMATE MONITORING PRODUCTS IN WMO RA VI Mesut DEMIRCAN Geodesy and Photogrametry Engineer Turkish State Meteorological Service Agrometeorology and Climatological
Week TSX Index 1 8480 2 8470 3 8475 4 8510 5 8500 6 8480
 1) The S & P/TSX Composite Index is based on common stock prices of a group of Canadian stocks. The weekly close level of the TSX for 6 weeks are shown: Week TSX Index 1 8480 2 8470 3 8475 4 8510 5 8500
ESSENTIAL COMPONENTS OF WATER-LEVEL MONITORING PROGRAMS. Selection of Observation Wells
 ESSENTIAL COMPONENTS OF WATER-LEVEL MONITORING PROGRAMS Before discussing the uses and importance of long-term water-level data, it is useful to review essential components of a water-level monitoring
THE COMMODITY RISK MANAGEMENT GROUP WORLD BANK
 THE COMMODITY RISK MANAGEMENT GROUP WORLD BANK Agricultural Insurance: Scope and Limitations for Rural Risk Management 5 March 2009 Agenda The global market Products Organisation of agricultural insurance
Chapter 10. Key Ideas Correlation, Correlation Coefficient (r),
,") Chapter 0 Key Ideas Correlation, Correlation Coefficient (r), Section 0-: Overview We have already explored the basics of describing single variable data sets. However, when two quantitative variables
Chapter 0 Key Ideas Correlation, Correlation Coefficient (r), Section 0-: Overview We have already explored the basics of describing single variable data sets. However, when two quantitative variables
User Perspectives on Project Feasibility Data
 User Perspectives on Project Feasibility Data Marcel Šúri Tomáš Cebecauer GeoModel Solar s.r.o., Bratislava, Slovakia marcel.suri@geomodel.eu http://geomodelsolar.eu http://solargis.info Solar Resources
Study and Evaluation of Solar Energy Variation in Nigeria
 Study and Evaluation of Solar Energy Variation in Nigeria Engr. C. O. Osueke (Ph.D, Post Ph.D) 1, Engr. (Dr) P. Uzendu 2, Engr. I. D. Ogbonna 3 1 Department of Mechanical Engineering, Landmark University,
Electricity Generation from Renewable Energy in Sri Lanka: Future Directions
 Electricity Generation from Renewable Energy in Sri Lanka: Future Directions Presented by M.M.C. Ferdinando, Secretary, Ministry of Power and Energy R.J. Gunawardana, Additional General Manager (Transmission),
Regression step-by-step using Microsoft Excel
 Step 1: Regression step-by-step using Microsoft Excel Notes prepared by Pamela Peterson Drake, James Madison University Type the data into the spreadsheet The example used throughout this How to is a regression
Practical Exercise on PC. Create Climate files Daily time step. Solution of the exercise
 Practical Exercise on PC Create Climate files Daily time step B Solution of the exercise Legend Red flash indicates buttons to click Red frame Green frame indicates data to input indicates output data
Temporal variation in snow cover over sea ice in Antarctica using AMSR-E data product
 Temporal variation in snow cover over sea ice in Antarctica using AMSR-E data product Michael J. Lewis Ph.D. Student, Department of Earth and Environmental Science University of Texas at San Antonio ABSTRACT
The Standardized Precipitation Index
 The Standardized Precipitation Index Theory The Standardized Precipitation Index (SPI) is a tool which was developed primarily for defining and monitoring drought. It allows an analyst to determine the
Data Processing Flow Chart
 Legend Start V1 V2 V3 Completed Version 2 Completion date Data Processing Flow Chart Data: Download a) AVHRR: 1981-1999 b) MODIS:2000-2010 c) SPOT : 1998-2002 No Progressing Started Did not start 03/12/12
Understanding Raster Data
 Introduction The following document is intended to provide a basic understanding of raster data. Raster data layers (commonly referred to as grids) are the essential data layers used in all tools developed
CIESIN Columbia University
 Conference on Climate Change and Official Statistics Oslo, Norway, 14-16 April 2008 The Role of Spatial Data Infrastructure in Integrating Climate Change Information with a Focus on Monitoring Observed
Climate Change: A Local Focus on a Global Issue Newfoundland and Labrador Curriculum Links 2010-2011
 Climate Change: A Local Focus on a Global Issue Newfoundland and Labrador Curriculum Links 2010-2011 HEALTH Kindergarten: Grade 1: Grade 2: Know that litter can spoil the environment. Grade 3: Grade 4:
GIS: Geographic Information Systems A short introduction
 GIS: Geographic Information Systems A short introduction Outline The Center for Digital Scholarship What is GIS? Data types GIS software and analysis Campus GIS resources Center for Digital Scholarship