Making an image using altitude as background image
|
|
|
- Delphia Pierce
- 8 years ago
- Views:
Transcription
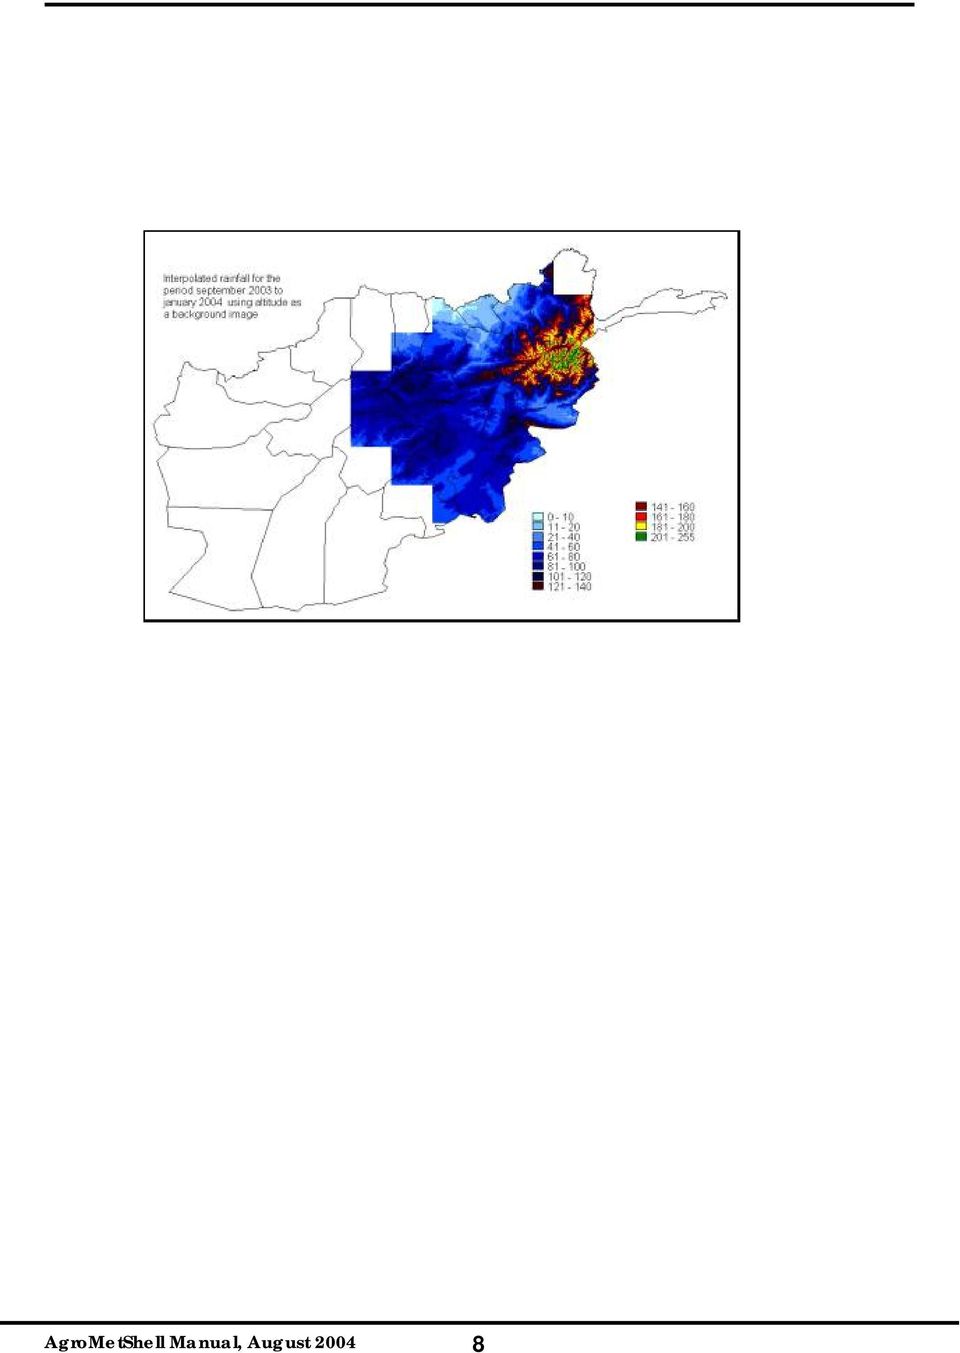
1 Try to re-do the previous exercise with different settings under Distance in Km between gridlines, Maximum interpolation radius (in Km), Minimum number of nearest stations and Maximum number of nearest stations. Notice the difference in the resulting images. Exercising with the settings is the best way to understand them. Making an image using altitude as background image In general, rainfall amounts are higher with higher altitudes. You can use this knowledge to produce better rainfall maps. If for example you have an image of altitude for Afghanistan with a file name of this image is being DemGL_20.afg. The image can be displayed in Windisp using the File Open Image function. The altitude map can now be used to interpolate rainfall for a particular dekad using the SEDI inverse distance method. First, export the data from the database to an ASCII file in exactly the same way as you did in the previous paragraph. The file contains rainfall for the first dekad of December Then Start the Interpolate SEDI Inverse distance function. Fill the screen according to your needs (it is probably best to accept most defaults and refine later). Press. AMS now displays interpolated rainfall for the first dekad of December 2003:

2 The details of all settings will not be explained here. The created image is compatible with Windisp. After that you can now view the map in Windisp using a new colour table and create a nice map for input into a bulletin. The map can then be labeled as shown in figure: AgroMetShell Manual, August

3 Making an interpolated image with data for a whole season The AMS option you used previously to make the input data file for the SEDI image ( Interpolate Make input file Database ) will not provide accumulated rainfall for a whole season. To have less work in Excel you first aggregate the dekadal values to monthly using the AMS function Database Calculate - Aggregate. First you do this for 2003 and then again for To make such a SEDI input file you need Excel. First you export the data from AMS to ASCII using the Tools-Make input file from database function. This ASCII file will be imported into Excel. You will export columns for all monthly rainfall values from September 2003 up to January You see the following screen: First you have to add the longitude and the latitude. Double click on Station parameters and add longitude and latitude: AgroMetShell Manual, August

4 Now add rainfall data for all the months in the season. First double-click the right part of the tree on the left side: Then specify which month column to add and which appropriate title to use as a heading: In the same way you add all 5 monthly columns for 2003 and 2004 until you have the following screen: AgroMetShell Manual, August

5 Press Save and the output file is shown in the AMS viewer: Exit AMS and open Excel with the file you just produced. In Excel use File-Open. The following screen is presented: AgroMetShell Manual, August

6 Press Next. Specify Comma Press Finish AgroMetShell Manual, August

7 The following screen is presented in Excel as shown in figure. First remove all stations with missing values (you cannot calculate totals for those). Create a new column at the end of the data range and calculate the totals. The following file should remain. Finally you remove some columns, because you no longer need them. Beware: Column I contains formulas, not values. Column I would fail if you would remove column D-G. Therefore, first make values in column I. Do this by selecting column I and press Ctrl-C. Then go to the menu-item Edit-Paste Special and set the settings as follows: AgroMetShell Manual, August

8 Now remove the name column and the monthly data columns as well as the title until you have the following structure: Column A now represents the longitude, B the latitude and C the seasonal total. Save this worksheet to a comma delimited CSV file using File-Save as with the following settings: The input file for the interpolation is now ready. Please proceed in the same way as the previous paragraph. Due to the lack of data, estimates are not produced for a large part of the country. The final map produced looks like this: AgroMetShell Manual, August

9 AgroMetShell Manual, August
10 From Water Balance results to yields For Afghanistan the following steps should be taken to run the water balance as part of a crop forecasting activity: As a separate preparing activity you calculate the water balances for every year in history for which you have sufficient data, calculate the index and establish a relationship between the index and the yield data obtained from the crop assessment missions and the National Statistical Office. Then for the running season you do the following: 1. For every station in the network, establish the crops to be monitored. In Afghanistan the crops are wheat, rice and perhaps maize and barley. 2. For every station in the network establish early, average and late planting dates and corresponding cycle lengths. 3. Make separate monitoring runs for 2 crops and 3 planting dates, so in this case 6 runs. 4. Throughout the season re-calculate the water balance whenever new data are received. The water balance always calculates the predicted final index. How to analyze data that have a different geographical format Basically data come to crop forecasting officers in three different ways: 1. As point data (usually by stations). E.G. Rainfall data and other parameters (temperatures etc..) reach Kabul is this way from the field stations. The data from ISPRA are in tabular form as well 2. By province or district (technically called polygon data). Yield data are an example of this type of data. 3. By image (technically called raster or grid data). As an example: you have images for NDVI, you have an altitude image, you have created images with AMS (e.g. SEDI) Now, you can only analyze and integrate datasets if the data are in same geographical format. So, if you want to analyze your data, select one of the three basic formats described above. The following paragraphs are an overview of these three data formats and how to get the data from other formats into the right geographic format. Analyzing information on station level Station data are easy to work with. You enter the in AMS and you can use AMS, Windisp and Excel to analyze the data. You can present the station data on a map using Windisp, AMS or ArcView. The disadvantage of working with station data is the lack of overview. There is no approximation of the parameters for areas in between the stations. However, you could work with station data as long as the analysis takes place and convert the station data into images for presentation of the results and an estimation of what happens in between the stations. If you have data by province or district you can convert them into point data as follows: 1. Assign values to districts and provinces. Make an image of the province/districts data with the AMS function Tools Assign Image Values Within Boundaries 2. Extract values for your stations into the database with the AMS function Database Import - From image. If the parameter does not exist in the database, you will have to define a new parameter in AMS using the Database Configure Parameter Definitions function. 3. If you want to do an analysis in Excel, export the data using the AMS function Tools Make input file from database or the Database Report function. AgroMetShell Manual, August

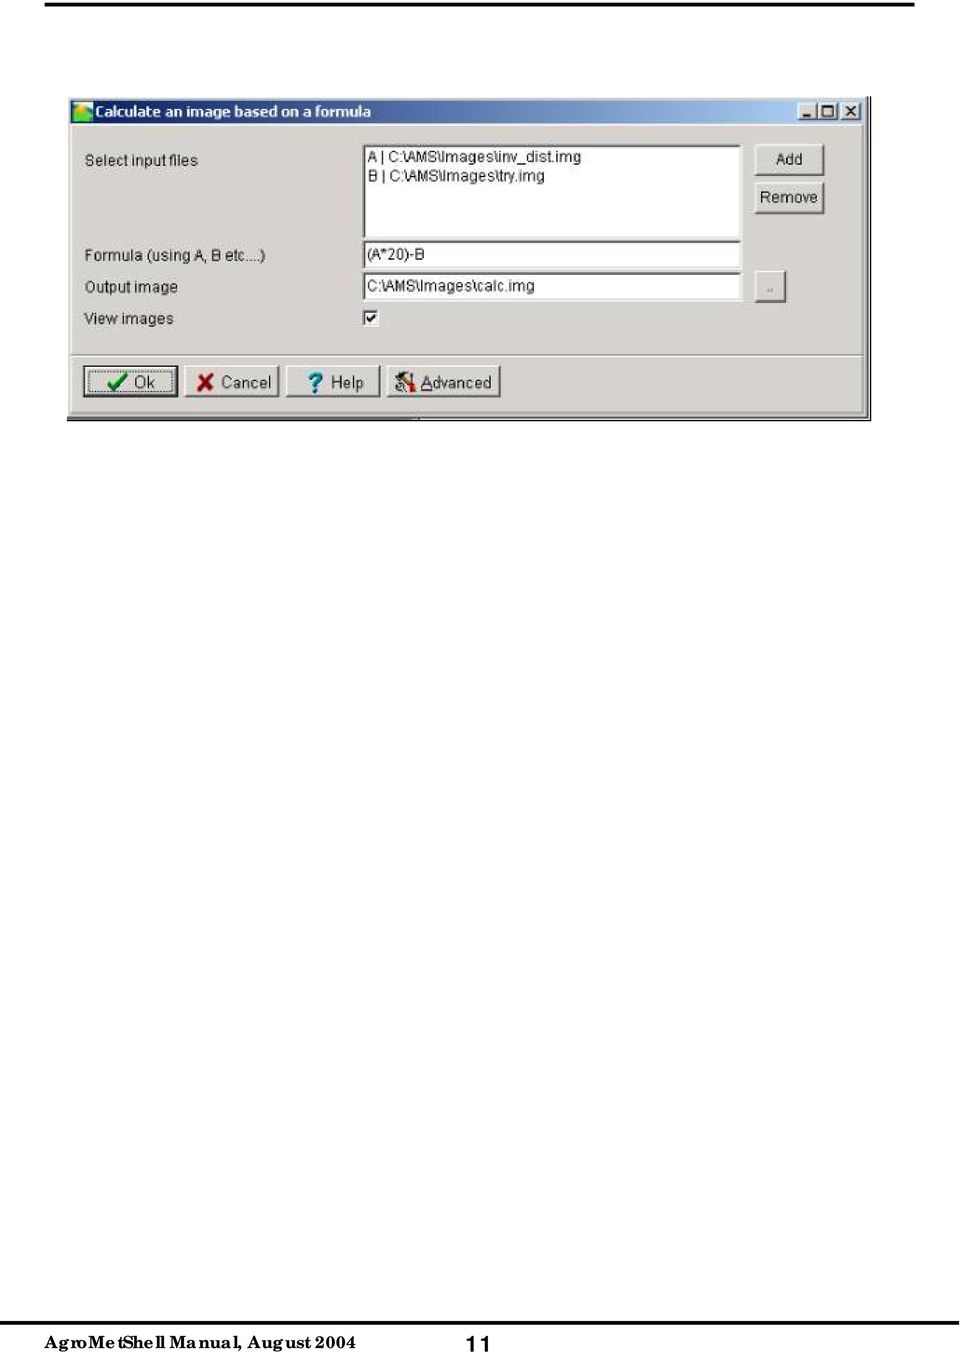
11 If you have data by image you essentially do the same: 1. Take the image and extract values for your stations into the database with the AMS function using the function Database Import - From image. Again, if the parameter does not exist in the database, you will have to define a new parameter in AMS. 2. If you want to do an analysis in Excel, export the data using the AMS function Tools Make input file from database or the Database Report function. Analyzing information on province/district level (area averaging) For the analysis of this type of data you use AMS, Windisp and Excel. ArcView is another possibility. ArcView essentially uses this type of information (polygonal). So, if you plan to work with ArcView this is probably the preferred geographical format to bring your data in. If you have station data and you have to aggregate them to provinces and districts, you do the following: 1. Make an image of the point data using any of the functions in the AMS Interpolate menu. You might want to use Interpolate Inverse distance or (if you have a background field related to the parameter) you can use the SEDI functions. 2. Extract average values for the districts by using the Windisp function Process Stats Average. This will create an ASCII file with averaged values for your parameter by district/province. 3. Now you can use your data in Excel next to other data on province district level. If you are an expert in ArcView you might join the ASCII table to an ArcView shape file. If you have images you essentially do this: 1. Extract average values for the districts by using the Windisp function Process Stats Average. This will create an ASCII file with averaged values for your parameter by district/province. Analyzing information on image level Analyzing information on this level has the advantage that all your (intermediate) products are highly graphical and show a country-wide picture. A disadvantage is that the information uses more hard disk space. However, the affordable huge hard disks of today make this disadvantage less important. If you have station data you can make images in just 1 step: 1. Make an image of the point data using any of the functions in the AMS Interpolate menu. You might want to use Interpolate Inverse distance or (if you have a background field related to the parameter) you can use the SEDI functions. If you have data by province or district you can convert them into images with just one step: 1. Assign values to districts and provinces. Make an image of the province/districts data with the AMS function Tools Assign Image Values Within Boundaries Working with images is not restricted to display only. Images can be subjected to adding, subtracting and every possible other mathematical operation using the Tools Image calculations with formula function: AgroMetShell Manual, August
 For the analysis of this type of data you use AMS, Windisp and Excel. ArcView is another possibility.")
12 AgroMetShell Manual, August
13 AgroMetShell Manual, August

How to Download Census Data from American Factfinder and Display it in ArcMap
 How to Download Census Data from American Factfinder and Display it in ArcMap Factfinder provides census and ACS (American Community Survey) data that can be downloaded in a tabular format and joined with
SA-9600 Surface Area Software Manual
 SA-9600 Surface Area Software Manual Version 4.0 Introduction The operation and data Presentation of the SA-9600 Surface Area analyzer is performed using a Microsoft Windows based software package. The
Realist 2.0 MLS Support (512) 454-7636 Monday thru Friday 9:00 am 5:00 pm
 454-7636 Monday thru Friday 9:00 am 5:00 pm") Realist 2.0 MLS Support (512) 454-7636 Monday thru Friday 9:00 am 5:00 pm 0 Understanding Realist On Realist s main page you ll find a full set of searching and mapping tools, all contained within one,
Realist 2.0 MLS Support (512) 454-7636 Monday thru Friday 9:00 am 5:00 pm 0 Understanding Realist On Realist s main page you ll find a full set of searching and mapping tools, all contained within one,
Pharmacy Affairs Branch. Website Database Downloads PUBLIC ACCESS GUIDE
 Pharmacy Affairs Branch Website Database Downloads PUBLIC ACCESS GUIDE From this site, you may download entity data, contracted pharmacy data or manufacturer data. The steps to download any of the three
Studying Topography, Orographic Rainfall, and Ecosystems (STORE)
") Studying Topography, Orographic Rainfall, and Ecosystems (STORE) Basic Lesson 3: Using Microsoft Excel to Analyze Weather Data: Topography and Temperature Introduction This lesson uses NCDC data to compare
Studying Topography, Orographic Rainfall, and Ecosystems (STORE) Basic Lesson 3: Using Microsoft Excel to Analyze Weather Data: Topography and Temperature Introduction This lesson uses NCDC data to compare
Analyzing Excel Data Using Pivot Tables
 NDUS Training and Documentation Analyzing Excel Data Using Pivot Tables Pivot Tables are interactive worksheet tables you can use to quickly and easily summarize, organize, analyze, and compare large amounts
DEVELOPMENT OF A WEATHER YIELD INDEX (WYX) FOR
 FOR") DEVELOPMENT OF A WEATHER YIELD INDEX (WYX) FOR MAIZE CROP INSURANCE IN MALAWI Adams Chavula Agrometeorologist, FAO-SDRN Consultant 1 and René Gommes Senior Agrometeorologist, FAO-SDRN March 2006 1 Adams
DEVELOPMENT OF A WEATHER YIELD INDEX (WYX) FOR MAIZE CROP INSURANCE IN MALAWI Adams Chavula Agrometeorologist, FAO-SDRN Consultant 1 and René Gommes Senior Agrometeorologist, FAO-SDRN March 2006 1 Adams
MAS 500 Intelligence Tips and Tricks Booklet Vol. 1
 MAS 500 Intelligence Tips and Tricks Booklet Vol. 1 1 Contents Accessing the Sage MAS Intelligence Reports... 3 Copying, Pasting and Renaming Reports... 4 To create a new report from an existing report...
HOW TO COLLECT AND USE DATA IN EXCEL. Brendon Riggs Texas Juvenile Probation Commission Data Coordinators Conference 2008
 HOW TO COLLECT AND USE DATA IN EXCEL Brendon Riggs Texas Juvenile Probation Commission Data Coordinators Conference 2008 Goals To be able to gather and organize information in Excel To be able to perform
Getting Data From Your Practice Management System
 Step 1: Initial Setup - 3 Month Report This one-time-only setup helps ensure that the PhoneTree software has all the information needed to incorporate data from your appointment schedules into automated
GeoLytics. User Guide for Business Demographics & Historical Business Demographics
 GeoLytics User Guide for Business Demographics & Historical Business Demographics Contents A. Installation 1 B. Introduction 2 C. Five Steps to Producing Files and Maps 2 1. Name your File 2 2. Select
Microsoft Office. Mail Merge in Microsoft Word
 Microsoft Office Mail Merge in Microsoft Word TABLE OF CONTENTS Microsoft Office... 1 Mail Merge in Microsoft Word... 1 CREATE THE SMS DATAFILE FOR EXPORT... 3 Add A Label Row To The Excel File... 3 Backup
Latin American and Caribbean Flood and Drought Monitor Tutorial Last Updated: November 2014
 Latin American and Caribbean Flood and Drought Monitor Tutorial Last Updated: November 2014 Introduction: This tutorial examines the main features of the Latin American and Caribbean Flood and Drought
University of Arkansas Libraries ArcGIS Desktop Tutorial. Section 4: Preparing Data for Analysis
 : Preparing Data for Analysis When a user acquires a particular data set of interest, it is rarely in the exact form that is needed during analysis. This tutorial describes how to change the data to make
Getting Started With LP360
 Getting Started With LP360 10/30/2014 1 Contents What is LP360?... 3 System Requirements... 3 Installing LP360... 4 How to Enable the LP360 Extension... 4 How to Display the LP360 Toolbar... 4 How to Import
Earthquakes, volcanoes and plate tectonics in ArcGIS Online
 Earthquakes, volcanoes and plate tectonics in ArcGIS Online For non-commercial use only by schools and universities Copyright Esri UK GIS Esri for School UK Ltd Programme 2014 www.esriuk.com/schools Earthquakes,
Excel 2007: Basics Learning Guide
 Excel 2007: Basics Learning Guide Exploring Excel At first glance, the new Excel 2007 interface may seem a bit unsettling, with fat bands called Ribbons replacing cascading text menus and task bars. This
Personal Geodatabase 101
 Personal Geodatabase 101 There are a variety of file formats that can be used within the ArcGIS software. Two file formats, the shape file and the personal geodatabase were designed to hold geographic
Creating a Store Locator
 Creating a Store Locator A handy print-out guide to Blipstar v2 Background Store locators are simple. You enter a zip code or post code or address and get a list of relevant places ordered by distance.
Hands-On Microsoft Windows Server 2008
 Hands-On Microsoft Windows Server 2008 Chapter 10 Managing System Reliability and Availability Using and Configuring Event Viewer Event Viewer Houses the event logs that record information about all types
User s Guide to ArcView 3.3 for Land Use Planners in Puttalam District
 User s Guide to ArcView 3.3 for Land Use Planners in Puttalam District Dilhari Weragodatenna IUCN Sri Lanka, Country Office Table of Content Page No Introduction...... 1 1. Getting started..... 2 2. Geo-referencing...
Specific Information for installation and use of the database Report Tool used with FTSW100 software.
 Database Report Tool This manual contains: Specific Information for installation and use of the database Report Tool used with FTSW100 software. Database Report Tool for use with FTSW100 versions 2.01
SPSS: Getting Started. For Windows
 For Windows Updated: August 2012 Table of Contents Section 1: Overview... 3 1.1 Introduction to SPSS Tutorials... 3 1.2 Introduction to SPSS... 3 1.3 Overview of SPSS for Windows... 3 Section 2: Entering
Intro to Excel spreadsheets
 Intro to Excel spreadsheets What are the objectives of this document? The objectives of document are: 1. Familiarize you with what a spreadsheet is, how it works, and what its capabilities are; 2. Using
Excel Companion. (Profit Embedded PHD) User's Guide
 User's Guide") Excel Companion (Profit Embedded PHD) User's Guide Excel Companion (Profit Embedded PHD) User's Guide Copyright, Notices, and Trademarks Copyright, Notices, and Trademarks Honeywell Inc. 1998 2001. All
Excel Companion (Profit Embedded PHD) User's Guide Excel Companion (Profit Embedded PHD) User's Guide Copyright, Notices, and Trademarks Copyright, Notices, and Trademarks Honeywell Inc. 1998 2001. All
Reef Explorer User Guide
 Reef Explorer User Guide Contents USER INTERFACE...2 DATA CONTENT...3 BASEMAPS...4 ESRI BASEMAPS...4 National Geographic World Map...4 Light Gray Canvas Map...4 Ocean Basemap...4 World Terrain Base...4
Radius Maps and Notification Mailing Lists
 Radius Maps and Notification Mailing Lists To use the online map service for obtaining notification lists and location maps, start the mapping service in the browser (mapping.archuletacounty.org/map).
Email Mail Merge Using Thunderbird. Bob Booth February 2009 AP-Tbird2
 Email Mail Merge Using Thunderbird. Bob Booth February 2009 AP-Tbird2 University of Sheffield Contents 1. Introduction... 3 2. Installing the Mail Tweak Plug-In... 4 2.1 DOWNLOADING MAIL TWEAK... 4 2.2
Chapter 6: Data Acquisition Methods, Procedures, and Issues
 Chapter 6: Data Acquisition Methods, Procedures, and Issues In this Exercise: Data Acquisition Downloading Geographic Data Accessing Data Via Web Map Service Using Data from a Text File or Spreadsheet
Advanced Excel 10/20/2011 1
 Advanced Excel Data Validation Excel has a feature called Data Validation, which will allow you to control what kind of information is typed into cells. 1. Select the cell(s) you wish to control. 2. Click
Importing TSM Data into Microsoft Excel using Microsoft Query
 Importing TSM Data into Microsoft Excel using Microsoft Query An alternate way to report on TSM information is to use Microsoft Excel s import facilities using Microsoft Query to selectively import the
Raster to Vector Conversion for Overlay Analysis
 Raster to Vector Conversion for Overlay Analysis In some cases, it may be necessary to perform vector-based analyses on a raster data set, or vice versa. The types of analyses that can be performed on
How to Import Data into Microsoft Access
 How to Import Data into Microsoft Access This tutorial demonstrates how to import an Excel file into an Access database. You can also follow these same steps to import other data tables into Access, such
Coupling Microsoft Excel with NI Requirements Gateway
 Coupling Microsoft Excel with NI Requirements Gateway Contents Using the Excel Type This document explains how NI Requirements Gateway interfaces with Microsoft Excel. Use this document to familiarize
Simply Accounting Intelligence Tips and Tricks Booklet Vol. 1
 Simply Accounting Intelligence Tips and Tricks Booklet Vol. 1 1 Contents Accessing the SAI reports... 3 Running, Copying and Pasting reports... 4 Creating and linking a report... 5 Auto e-mailing reports...
Tutorial Creating a regular grid for point sampling
 This tutorial describes how to use the fishnet, clip, and optionally the buffer tools in ArcGIS 10 to generate a regularly-spaced grid of sampling points inside a polygon layer. The steps below should
Summary of important mathematical operations and formulas (from first tutorial):
:") EXCEL Intermediate Tutorial Summary of important mathematical operations and formulas (from first tutorial): Operation Key Addition + Subtraction - Multiplication * Division / Exponential ^ To enter a
EXCEL Intermediate Tutorial Summary of important mathematical operations and formulas (from first tutorial): Operation Key Addition + Subtraction - Multiplication * Division / Exponential ^ To enter a
Microsoft Excel Basics
 COMMUNITY TECHNICAL SUPPORT Microsoft Excel Basics Introduction to Excel Click on the program icon in Launcher or the Microsoft Office Shortcut Bar. A worksheet is a grid, made up of columns, which are
Autodesk Product Manager Tool
 Autodesk Product Manager Tool A Step Guide for Conducting a Software Audit 2007 Autodesk 1 Autodesk Product Manager Installing and Conducting a Software Audit The Autodesk Product Manager (APM) utility
MicroStrategy Desktop
 MicroStrategy Desktop Quick Start Guide MicroStrategy Desktop is designed to enable business professionals like you to explore data, simply and without needing direct support from IT. 1 Import data from
SEA START Climate Change Analysis Tool v1.1
 SEA START Climate Change Analysis Tool v1.1 SEA START RC has developed tool to aid data analysis for the future climate data which is downloaded from Climate Data Distribution System (http://cc.start.or.th).
Fig. 1 Suitable data for a Crosstab Query.
 Crosstab Queries A Crosstab Query is a special kind of query that summarizes data by plotting one field against one or more other fields. Crosstab Queries can handle large amounts of data with ease and
PC-MIS. IAPT Intermediate Database Creation Procedure. Patient Case Management Information System
 PC-MIS Patient Case Management Information System IAPT Intermediate Database Creation Procedure Patient Case Management Information System PC-MIS v.4.6.0 Document Control Document Information Title IAPT
How To Use Optimum Control EDI Import. EDI Invoice Import. EDI Supplier Setup General Set up
 How To Use Optimum Control EDI Import EDI Invoice Import This optional module will download digital invoices into Optimum Control, updating pricing, stock levels and account information automatically with
BEST PRACTICES AND YOUR PROGRAMS. Brendon Riggs Texas Juvenile Probation Commission Data Coordinators Conference 2008
 BEST PRACTICES AND YOUR PROGRAMS Brendon Riggs Texas Juvenile Probation Commission Data Coordinators Conference 2008 OUTLINE Defining best practice programs The importance of best practices/model practices
GIS MAPPING FOR IRRIGATION DISTRICT RAPID APPRAISALS Daniel J. Howes 1, Charles M. Burt 2, Stuart W. Styles 3 ABSTRACT
 GIS MAPPING FOR IRRIGATION DISTRICT RAPID APPRAISALS Daniel J. Howes 1, Charles M. Burt 2, Stuart W. Styles 3 ABSTRACT Geographic information system (GIS) mapping is slowly becoming commonplace in irrigation
Canterbury Maps Quick Start - Drawing and Printing Tools
 Canterbury Maps Canterbury Maps Quick Start - Drawing and Printing Tools Quick Start Guide Standard GIS Viewer 2 Canterbury Maps Quick Start - Drawing and Printing Tools Introduction This document will
Create a Pipe Network with Didger & Voxler
 Create a Pipe Network with Didger & Voxler Over the past few years, Golden Software s technical support team has been contacted a few times with user questions about using Voxler s WellRender module to
Lesson 15 - Fill Cells Plugin
 15.1 Lesson 15 - Fill Cells Plugin This lesson presents the functionalities of the Fill Cells plugin. Fill Cells plugin allows the calculation of attribute values of tables associated with cell type layers.
Tutorial case study D (GIS import)
") GeoModeller User Manual Tutorial case study D (GIS ) 1 Tutorial case study D (GIS ) 3D GeoModeller User Manual and Tutorials Author: Desmond Fitzgerald, Intrepid Geophysics Editor: Claire Edwards, Intrepid
GeoModeller User Manual Tutorial case study D (GIS ) 1 Tutorial case study D (GIS ) 3D GeoModeller User Manual and Tutorials Author: Desmond Fitzgerald, Intrepid Geophysics Editor: Claire Edwards, Intrepid
Basics Series-4004 Database Manager and Import Version 9.0
 Basics Series-4004 Database Manager and Import Version 9.0 Information in this document is subject to change without notice and does not represent a commitment on the part of Technical Difference, Inc.
Affiliate Program CSV Export User Guide
 Affiliate Program CSV Export User Guide Copyright 2006, E-Z Data, Inc., All Rights Reserved No part of this documentation may be copied, reproduced, or translated in any form without the prior written
A quick guide to... List Segmentation
 A quick guide to... List Segmentation In this guide... Learn how to create razor-sharp list segments based on precise combinations of conditions then use those segments to generate profitable email marketing
A Method Using ArcMap to Create a Hydrologically conditioned Digital Elevation Model
 A Method Using ArcMap to Create a Hydrologically conditioned Digital Elevation Model High resolution topography derived from LiDAR data is becoming more readily available. This new data source of topography
HELCOM Data and Map Service. User Manual
 HELCOM Data and Map Service User Manual Version 2.2 - February 2015 1 Table of contents 1. General Information... 3 1.1 Background... 3 1.2 Technical requirements... 3 1.3 Contact... 3 2. Accessing HELCOM
CLIDATA In Ostrava 18/06/2013
 CLIDATA In Ostrava 18/06/2013 Content Introduction...3 Structure of Clidata Application...4 Clidata Database...5 Rich Java Client...6 Oracle Discoverer...7 Web Client...8 Map Viewer...9 Clidata GIS and
MGL Avionics. MapMaker 2. User guide
 MGL Avionics MapMaker 2 User guide General The MGL Avionics MapMaker application is used to convert digital map images into the raster map format suitable for MGL EFIS systems. Note: MapMaker2 produces
Microsoft Access Rollup Procedure for Microsoft Office 2007. 2. Click on Blank Database and name it something appropriate.
 Microsoft Access Rollup Procedure for Microsoft Office 2007 Note: You will need tax form information in an existing Excel spreadsheet prior to beginning this tutorial. 1. Start Microsoft access 2007. 2.
Quick Start Using DASYLab with your Measurement Computing USB device
 Quick Start Using DASYLab with your Measurement Computing USB device Thank you for purchasing a USB data acquisition device from Measurement Computing Corporation (MCC). This Quick Start document contains
NIS-Elements: Using Regions of Interest (ROIs) & ROI Statistics
 & ROI Statistics") NIS-Elements: Using Regions of Interest (ROIs) & ROI Statistics Various ROI tools and functions NIS-Elements has several ROI functions designed for data analysis and image quantification. ROIs are a core
NIS-Elements: Using Regions of Interest (ROIs) & ROI Statistics Various ROI tools and functions NIS-Elements has several ROI functions designed for data analysis and image quantification. ROIs are a core
Ofgem Carbon Savings Community Obligation (CSCO) Eligibility System
 Eligibility System") Ofgem Carbon Savings Community Obligation (CSCO) Eligibility System User Guide 2015 Page 1 Table of Contents Carbon Savings Community Obligation... 3 Carbon Savings Community Obligation (CSCO) System...
Ofgem Carbon Savings Community Obligation (CSCO) Eligibility System User Guide 2015 Page 1 Table of Contents Carbon Savings Community Obligation... 3 Carbon Savings Community Obligation (CSCO) System...
ArcGIS Online. Visualizing Data: Tutorial 3 of 4. Created by: Julianna Kelly
 ArcGIS Online Visualizing Data: Tutorial 3 of 4 2014 Created by: Julianna Kelly Contents of This Tutorial The Goal of This Tutorial In this tutorial we will learn about the analysis tools that ArcGIS Online
History of Revisions. Ordering Information
 No part of this document may be reproduced in any form or by any means without the express written consent of II Morrow Inc. II Morrow, Apollo, and Precedus are trademarks of II Morrow Inc. Windows is
STATISTICAL SOFTWARE PACKAGE
 STATISTICAL SOFTWARE PACKAGE Jeff Harris david.j.harris@usace.army.mil, Gary Brunnergary.w.brunner@usace.army.mil, Matt Fleming matthew.j.fleming@usace.army.mil, Beth Faber Ph.D. beth.a.faber@usace.army.mil,
How to use PGS: Basic Services Provision Map App
 How to use PGS: Basic Services Provision Map App The PGS: Basic Services Provision Map App The main features of the PGP Basic Services web application includes: Navigation Tools Map Tools Main Map Links
Resources You can find more resources for Sync & Save at our support site: http://www.doforms.com/support.
 Sync & Save Introduction Sync & Save allows you to connect the DoForms service (www.doforms.com) with your accounting or management software. If your system can import a comma delimited, tab delimited
Ad Hoc Reporting: Data Export
 Ad Hoc Reporting: Data Export Contents Ad Hoc Reporting > Data Export... 1 Export Format Options... 3 HTML list report (IMAGE 1)... 3 XML (IMAGE 2)... 4 Delimited Values (CSV)... 4 Fixed Width (IMAGE 10)...
Files Used in this Tutorial
 Generate Point Clouds Tutorial This tutorial shows how to generate point clouds from IKONOS satellite stereo imagery. You will view the point clouds in the ENVI LiDAR Viewer. The estimated time to complete
Working with Spreadsheets
 osborne books Working with Spreadsheets UPDATE SUPPLEMENT 2015 The AAT has recently updated its Study and Assessment Guide for the Spreadsheet Software Unit with some minor additions and clarifications.
Under GIS Data select Hydrography This will show all of the state-wide options for hydrography data. For this project, we want the seventh entry in
 Introductory Exercises for GIS Using ArcMap & ArcCatalog GIS Cyberinfrastructure Module EEB 5894, section 10 Please refer to the ESRI online GIS Dictionary for additional details on any of the terms in
Bank Reconciliation need not be back breaking anymore!!!
 Bank Reconciliation need not be back breaking anymore!!! Bank Reconciliation BankReconciliation.com takes the pain out of preparing bank reconciliations, credit card reconciliations, CUSIP and other data
Tutorial 8 Raster Data Analysis
 Objectives Tutorial 8 Raster Data Analysis This tutorial is designed to introduce you to a basic set of raster-based analyses including: 1. Displaying Digital Elevation Model (DEM) 2. Slope calculations
Basic Pivot Tables. To begin your pivot table, choose Data, Pivot Table and Pivot Chart Report. 1 of 18
 Basic Pivot Tables Pivot tables summarize data in a quick and easy way. In your job, you could use pivot tables to summarize actual expenses by fund type by object or total amounts. Make sure you do not
Using Net2 Timesheet. Net2 AN1029. Timesheet software. Configuring Clocking In and Clocking Out readers
 Using Timesheet Timesheet software This program provides basic time and attendance reporting when used with the access control system. A user must be defined as an operator to log in to. The level of detail
UTILITIES BACKUP. Figure 25-1 Backup & Reindex utilities on the Main Menu
 25 UTILITIES PastPerfect provides a variety of utilities to help you manage your data. Two of the most important are accessed from the Main Menu Backup and Reindex. The other utilities are located within
Working with climate data and niche modeling I. Creation of bioclimatic variables
 Working with climate data and niche modeling I. Creation of bioclimatic variables Julián Ramírez-Villegas 1 and Aaron Bueno-Cabrera 2 1 International Centre for Tropical Agriculture (CIAT), Cali, Colombia,
Modeled Attainment Test Software
 4550 Montgomery Avenue Bethesda, MD 20814 www.abtassociates.com Modeled Attainment Test Software User's Manual Prepared for Office of Air Quality Planning and Standards U.S. Environmental Protection Agency
Quick Start User Guide
 Quick Start User Guide Table of Contents Getting to Know CRM... 3 Importing Your Contact Information from Outlook and Excel... 6 Using Your Calendar... 11 Managing Tasks, Events and Marketing Programs...
TUTORIAL: Reporting Gold-Vision 6
 Reporting Using SQL reporting Services Tutorial Objectives: Introduction to Gold-Vision Reporting Standard Reports Searching for a Report Running a Standard Report Viewing a Report Exporting Data Example
Site Waste Management Plan Tracker User Guide
 Site Waste Management Plan Tracker User Guide User Guide Project code: WAS770-002 Date: December 2009 Introduction The SWMP Tracker is an online tool that allows users to collate, aggregate and analyse
MARS STUDENT IMAGING PROJECT
 MARS STUDENT IMAGING PROJECT Data Analysis Practice Guide Mars Education Program Arizona State University Data Analysis Practice Guide This set of activities is designed to help you organize data you collect
Using Geocoded TIFF & JPEG Files in ER Mapper 6.3 with SP1. Eric Augenstein Earthstar Geographics Web: www.es-geo.com
 Using Geocoded TIFF & JPEG Files in ER Mapper 6.3 with SP1 Eric Augenstein Earthstar Geographics Web: www.es-geo.com 1 Table of Contents WHAT IS NEW IN 6.3 SP1 REGARDING WORLD FILES?...3 WHAT IS GEOTIFF
Step 2: Save the file as an Excel file for future editing, adding more data, changing data, to preserve any formulas you were using, etc.
 R is a free statistical software environment that can run a wide variety of tests based on different downloadable packages and can produce a wide variety of simple to more complex graphs based on the data
ArcGIS online Introduction... 2. Module 1: How to create a basic map on ArcGIS online... 3. Creating a public account with ArcGIS online...
 Table of Contents ArcGIS online Introduction... 2 Module 1: How to create a basic map on ArcGIS online... 3 Creating a public account with ArcGIS online... 3 Opening a Map, Adding a Basemap and then Saving
Formulas, Functions and Charts
 Formulas, Functions and Charts :: 167 8 Formulas, Functions and Charts 8.1 INTRODUCTION In this leson you can enter formula and functions and perform mathematical calcualtions. You will also be able to
DATA VISUALIZATION WITH TABLEAU PUBLIC. (Data for this tutorial at www.peteraldhous.com/data)
") DATA VISUALIZATION WITH TABLEAU PUBLIC (Data for this tutorial at www.peteraldhous.com/data) Tableau Public allows you to create a wide variety of interactive graphs, maps and tables and organize them
DATA VISUALIZATION WITH TABLEAU PUBLIC (Data for this tutorial at www.peteraldhous.com/data) Tableau Public allows you to create a wide variety of interactive graphs, maps and tables and organize them
MICROSOFT ACCESS STEP BY STEP GUIDE
 IGCSE ICT SECTION 11 DATA MANIPULATION MICROSOFT ACCESS STEP BY STEP GUIDE Mark Nicholls ICT Lounge P a g e 1 Contents Task 35 details Page 3 Opening a new Database. Page 4 Importing.csv file into the
CODESOFT 9 EDITION - COMPARISON SHEET
 October 2010 Product Information CODESOFT 9 EDITION - COMPARISON SHEET General UNICODE Multi-level undo 1 40 40 40 Auto Save document Lock/Unlock objects Export label as a graphic Import ULD file Import
DIVA-GIS v5 - Tutorial February 2005
 DIVA-GIS v5 - Tutorial February 2005 This tutorial guides you through some commands in DIVA-GIS, in order to become familiar with the some of the most basic aspects of the program. More details can be
Introduction to IBM Watson Analytics Data Loading and Data Quality
 Introduction to IBM Watson Analytics Data Loading and Data Quality December 16, 2014 Document version 2.0 This document applies to IBM Watson Analytics. Licensed Materials - Property of IBM Copyright IBM
Importing ASCII Grid Data into GIS/Image processing software
 Importing ASCII Grid Data into GIS/Image processing software Table of Contents Importing data into: ArcGIS 9.x ENVI ArcView 3.x GRASS Importing the ASCII Grid data into ArcGIS 9.x Go to Table of Contents
UPS System Capacity Management Configuration Utility
 StruxureWare Power Monitoring 7.0 UPS System Capacity Management Configuration Utility User Guide UPS System Capacity Management Configuration Utility This document provides an overview of the StruxureWare
Using Adobe Dreamweaver CS4 (10.0)
") Getting Started Before you begin create a folder on your desktop called DreamweaverTraining This is where you will save your pages. Inside of the DreamweaverTraining folder, create another folder called
Getting Started Before you begin create a folder on your desktop called DreamweaverTraining This is where you will save your pages. Inside of the DreamweaverTraining folder, create another folder called
BA-1000 Software Package. Version 1.00
 BA-1000 Software Package Version 1.00 Table of Content TABLE OF CONTENT...2 INTRODUCTION...3 FEATURES...3 INSTALLATION...3 Install from ZIP Disk... 3 Install from Internet... 3 PROGRAM SETUP...3 ZIP Drive
Release 2.1 of SAS Add-In for Microsoft Office Bringing Microsoft PowerPoint into the Mix ABSTRACT INTRODUCTION Data Access
 Release 2.1 of SAS Add-In for Microsoft Office Bringing Microsoft PowerPoint into the Mix Jennifer Clegg, SAS Institute Inc., Cary, NC Eric Hill, SAS Institute Inc., Cary, NC ABSTRACT Release 2.1 of SAS
BID2WIN Workshop. Advanced Report Writing
 BID2WIN Workshop Advanced Report Writing Please Note: Please feel free to take this workbook home with you! Electronic copies of all lab documentation are available for download at http://www.bid2win.com/userconf/2011/labs/
RS/GIS Quick Start Guides Collaborative training materials available from the Biodiversity Informatics & Geospatial Innovation Facilities
 http://gif.berkeley.edu Collaborative training materials available from the Biodiversity Informatics & Geospatial Innovation Facilities http://biodiversityinformatics.amnh.org Using the ArcMap model builder
Marketing and Query Guide
 Marketing and Query Guide 111011 2011 Blackbaud, Inc. This publication, or any part thereof, may not be reproduced or transmitted in any form or by any means, electronic, or mechanical, including photocopying,
User Guide for YB Admin Centre
 User Guide for YB Admin Centre www.ybtracking.com General Overview The Back-Office system is designed to provide a single-point of control for Iridium-based tracking devices. The system can support a multitude
Downloading SSURGO Soil Data from Internet
 Downloading SSURGO Soil Data from Internet Prepared by Venkatesh Merwade School of Civil Engineering, Purdue University vmerwade@purdue.edu September 2012 Purpose The purpose of this exercise to demonstrate