GREATER COLUMBUS OFFICE MARKET OVERVIEW. Current Market Trends
|
|
|
- Randall Reed
- 8 years ago
- Views:
Transcription
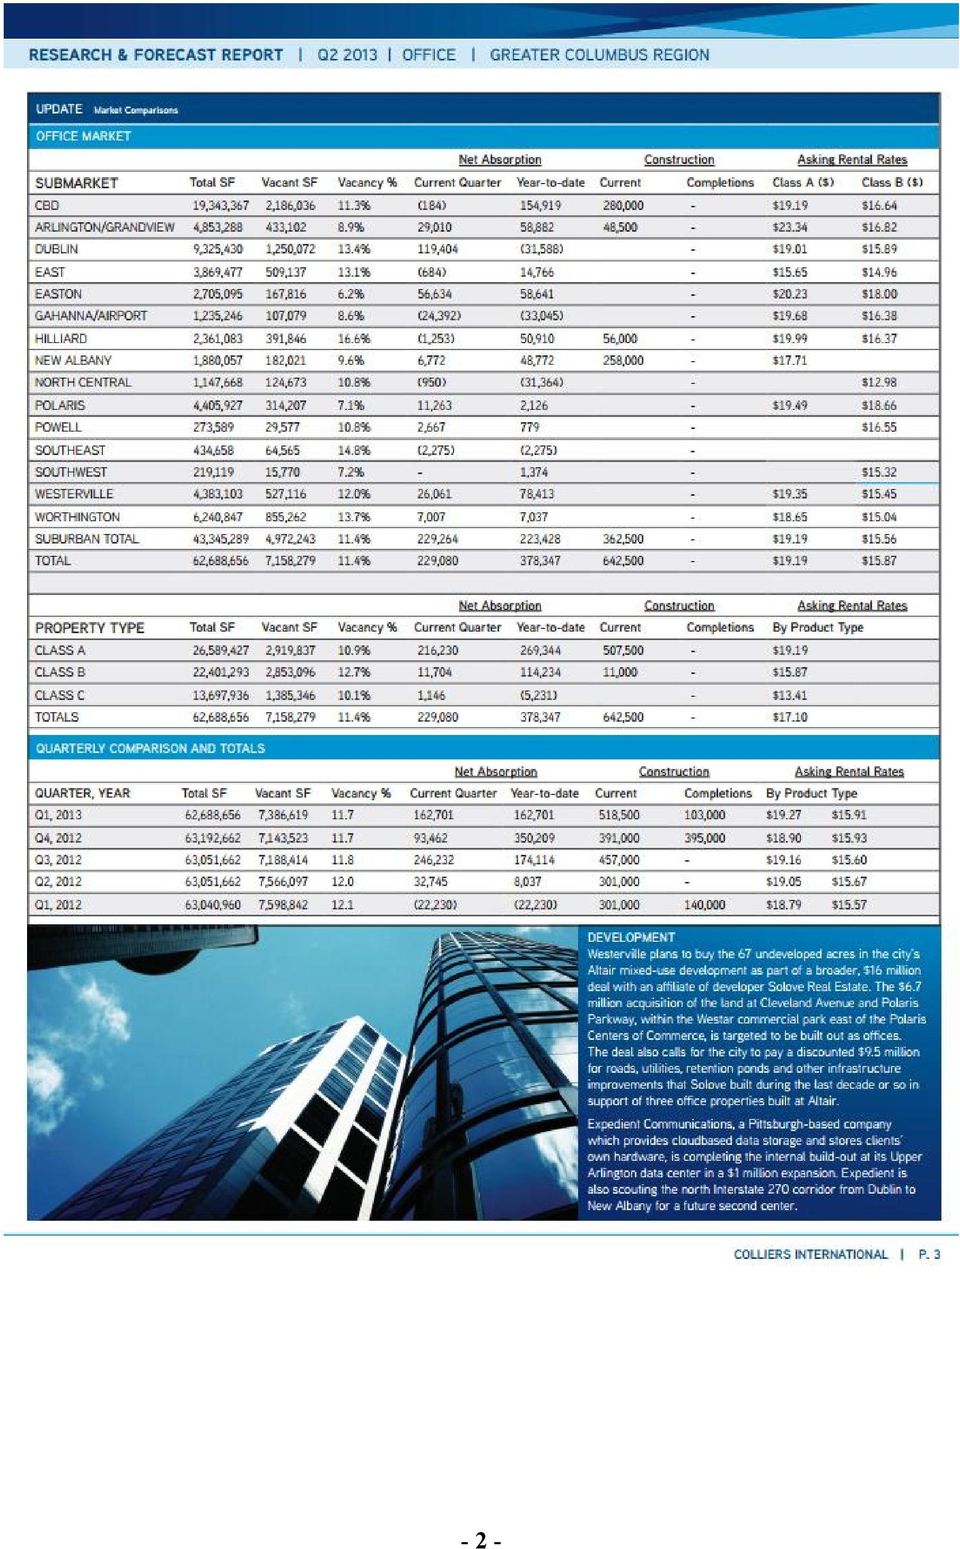
1 GREATER COLUMBUS OFFICE MARKET OVERVIEW Current Market Trends Over the past 12 months, overall market conditions have continued to improve. Vacancy declined, absorption remains positive and rental rates have increased. Additionally, new construction has mostly been limited to build-to-suit scenarios, which has helped to alleviate the oversupply of existing space within the regional market. Supply In assessing the Columbus office market, several sources have been considered. These sources include Colliers International and CB Richard Ellis. The broadest survey appears to have been conducted by Colliers International. This survey includes over 62.6 million square feet of tenant-occupied office space. Reporting criteria has now been expanded to include all nongovernment office buildings with 10,000 square feet and greater, as opposed to their previous methodology, which was based on buildings of 20,000 square feet and greater. By comparison, the CB Richard Ellis survey identifies 32.6 million square feet within the greater Columbus office market. The substantial difference in square footage included in the Colliers International survey includes owner- and partial owner-occupied office buildings with significant amounts of sub-lease space available. According to historical records, the greater Columbus office market is made up of approximately 57% multi-tenant, investor-owned office space, while the remaining 43% is owner-occupied. Using these estimates against the CB Richard Ellis survey indicates approximately 57.2 million square feet of total office space in the Columbus metropolitan area. The Colliers International 2 nd Quarter 2013 Research & Forecast Report is presented on the following page

2 - 2 -
3 Occupancy The surveys indicate that market vacancy decreased approximately 0.7% from Q to Q2 2013, slightly improving the stability of the regional office market. Current vacancy rate estimates range from 11.4% (Colliers International) to 19.3% (CB Richard Ellis). The decrease in vacancy during 2013 was caused by positive absorption and some new construction. Easton, in the northeastern portion of the region, anchored by the area s largest regional mall development, is the strongest suburban submarket, with overall vacancy estimated at 6.2%. The second strongest submarket, Polaris, is currently estimated at 7.1% (per Colliers International). Recently, the strongest demand has been from medical, insurance technology and higher education users. Absorption Demand While the historical performance of the metropolitan Columbus office market is not a guarantee of future performance, it provides insight into the supply and demand components that created office absorption in the past and, therefore, what components are likely to promote absorption in the future. In recent years, the suburban submarkets have accounted for most of the new office space in the metropolitan area. These areas have also claimed the vast majority of the office space absorption. In years 2009 and 2010, the regional office market indicated negative absorption in both the CBD and Suburban office markets, reflecting the declining economic conditions that became apparent by the end of However, by 2010, leasing activity increased, and 2011 ended with positive absorption. Annualized absorption for 2013 indicates continued improvement, as to-date results have exceeded total 2012 absorption. After several years of fragile market conditions, it appears that corporations are beginning to illustrate their confidence by taking on additional space. A historical perspective of the absorption is provided in the following table. Historical Office Absorption Submarket Q2 CBD: 172, , , ,362 (196,241) (10,000) 161,101 10, ,919 Suburban: (58,651) 509, , ,526 (389,211) (243,648) 482, , ,428 Total All: 113, , , ,888 (585,452) (253,648) 643, , ,347 Source: Multiple - 3 -
.")
4 A summary of new office construction, by year, is summarized in the following chart. As shown, new construction over the past ten years reached its lowest point in 2010, when the only new construction took place in the Grandview Yard area. During this time, financing was largely unavailable to most users, and unemployment rates were near peak levels. Development activity increased in 2011 and 2012, although current development activity is far-outpacing the previous two years. The majority of this new construction is occurring in the CBD and New Albany, in several corporate headquarter offices (Bob Evans and AEP). Additional speculative development is also occurring in New Albany. New Office Construction , , , , , , , , , Q2 642,500 Historical Office Transfer Information The actual office transfers within Franklin County include all offices with recorded conveyance forms. The historical transfer information, as reported by Jacqueline Haines Associates, is presented in the following chart

5 Historical Office Transfer Information Number of Total Dollar Average Average Building Average Price Year Transactions Volume Transaction S ize (S F) Per S F $262,591,576 $1,727,576 22,791 $ $493,608,068 $2,384,580 31,793 $ $296,962,457 $1,462,869 17,077 $ $202,347,644 $1,027,145 14,522 $ $180,767,213 $961,528 11,840 $ $320,520,712 $1,863,495 21,848 $ $146,888,802 $689,619 9,543 $ $262,465,647 $1,089,069 18,043 $ $385,916,991 $1,663,435 22,248 $ $359,948,394 $1,419,120 19,614 $ $475,094,308 $2,273,178 22,746 $ $256,164,814 $1,642,082 21,476 $ $124,986,299 $1,016,149 11,709 $ $212,027,697 $1,472,415 21,836 $ $326,014,304 $2,202,799 32,457 $ $289,741,968 $1,609,678 32,281 $ Q2 100 $75,848,549 $758,485 12,666 $65.17 Source: Jacqueline Haines Associates - 5 -

6 - 6 -

7 The volume of sales activity has continued to increase over the past several years, although the average price-per-square-foot has fluctuated near the low end of the range over the past decade, due to the influence of distressed transactions and a market correction. The average sale price-per-square-foot has remained relatively constant over the past several years, showing limited appreciation. The demand for office property will continue to be owner-occupied office buildings and newer, well-occupied investment properties. One significant trend influencing the market is the single-asset LLC transfer (business entity) rather than the real estate itself. The sale of the business entity allows investors to disguise the true purchase price and escape the payment of conveyance fees. In Ohio, real estate taxes are based on market value, and disclosing the true purchase price creates the risk of increasing real estate taxes. The number of transfers in 2010 and 2011 has remained consistent, although the average price-per-square-foot has remained near the low end of the range over the past decade, due to the influence of distressed transactions. Office Land Most submarkets still have ample land appropriately zoned and serviced for office development. Over the past year, developers have begun to acquire land for new office development in select, strong submarkets, such as New Albany. However, overall, recent market conditions have stopped most speculative office development. Duke Realty, which owned significant acreage in both New Albany and Dublin, has been aggressively marketing for sale all of their vacant office land in the Columbus market. Land that was previously priced in the $150,000 to $250,000 per-acre category has been sold for as little as $65,000 per-acre within the past months. Even at these extraordinary prices, limited transactions are occurring. Construction Costs Construction costs have been increasing over the past several years, largely due to increasing material and labor costs. Direct and indirect construction costs for general office space typically ranged from $ to $ per square foot, including a $25.00 to $35.00 per square foot tenant improvement allowance for general office space. Medical office finish is experiencing tenant improvement costs in excess of $40.00 per square foot. Therefore, total costs with land were exceeding $ per square foot before profit
 rather than the real estate itself.")
8 Market Rents New office space is typically being leased on the basis of net rental rates, with the tenant responsible for either directly paying, or reimbursing to the owner, all fixed and operating expenses. Class A CBD office building rent is typically $19.00 to $21.00 per square foot on a gross basis. Class B and C CBD office buildings typically experience gross rental rates ranging from $14.00 to $17.00 per square foot. General, Class A suburban office rates are typically $20.00± per square foot (gross), while Class B suburban office rates range from $12.00 to $16.00 per square foot (gross), depending on location, condition, etc. After several years of rental rate stagnation, average rates have begun to improve slightly. Still, in some locations, building owners remain more reliant on short-term rental concessions, such as free or discounted rent, to attract tenants. Lease agreements are more commonly requiring tenants to pay all building-related expenses during occupancy, including management and major capital expenditures (i.e. replacement reserves). The most significant operating expense continues to be real estate taxes. Some office developments have secured real estate tax-abatements that reduce the tenant s occupancy costs. These incentives increase the building s competitive advantage from a marketing standpoint and, therefore, typically reduce the required absorption period. However, over the long-term, these abatements have generated additional movement within the market, as tenants relocate to other municipalities providing these incentives. This activity does not generate office growth in the market, but creates additional vacant space within the regional supply. Operating Expenses According to the IREM 2012 Office Buildings Income/Expense Analysis, operating expenses range from $6.50 to $8.00 per square foot. Assuming net rental rates, these expenses would be paid for by the tenant during occupancy. Building owners are typically responsible for all expenses during vacancies. More commonly, owners are also requiring reimbursement for management and capital expenditures in newer building leases. Medical office space expenses are typically $1.50 to $2.00 per square foot higher, due to higher real estate taxes, utilities and janitorial costs
, depending on location, condition, etc. After several years of rental rate stagnation, average rates have begun to improve slightly.")
9 Financing Availability After a period of limited financing availability, market conditions are beginning to appear favorable to development, as favorable financing rates and terms are available for developments in strong locations. Lenders typically require a 25% to 35% equity position in office transactions. Interest rates are approximately 4.25% to 5.0% or slightly lower, depending upon the quality of the property and the tenants. Amortization schedules typically range from 20 to 30 years, with debt coverage ratios of at least As interest rates have remained steady or fallen, investors have increased their required rate of return. Equity dividend rates currently range from 10% to 15%, depending upon the investment. Current equity dividend rates, as provided by RealtyRates.com, are as follows: RealtyRates.Com Investor Survey (Office/R & D Equity Dividend Rates) Min Max Avg. Office:.12% 17.09% 13.05% Suburban: 8.12% 15.89% 11.62% CBD: 8.32% 17.09% 12.27% Medical: 8.22% 16.49% 11.94% R & D/Flex: 7.84% 17.01% 11.96% Capitalization Rates Due to the softness in the Columbus office market, overall capitalization rates are 50 to 100 basis points higher than the national averages. Capitalization rates vary based upon building age, location, occupancy, and other characteristics. The following capitalization rates have been experienced in the Columbus market: Current Columbus MSA Capitalization Rates (Stabilized Properties) Office: General Class-A 8.0% - 9.0% Office: General Class-B 8.5% % Office: General Class-C 9.0% % Office: Medical (New) 6.5% - 8.0% Office: Medical (Other) 8.0% - 9.5% - 9 -

10 Conclusion The current Columbus office market is extremely segmented by price, product type, age, and location. Smaller, owner-occupied office buildings are still experiencing the strongest demand, as is medical office space. However, strong leased fee interests remain attractive to institutional investors. Until recently, construction costs new were higher than market values; this, in addition to limited financing availability and overall weakened economic conditions, prevented new development between 2009 and Within the past year, market conditions have continued to improve, and a new wave of office development has begun in strong locations, such as the CBD and New Albany. Overall, market participants are anticipated to remain cautiously optimistic over the near term. Without significant new construction in most parts of the region and positive absorption, overall vacancy is anticipated to moderately improve for the next several quarters. Much of the new construction will continue to be limited to build-to-suit and owner-occupied opportunities. The inventory of the region s older buildings are struggling to maintain occupancies due to changing design demands by the typical tenant and the extreme cost of retrofitting older buildings to meet current standards. With limited rental rate appreciation, in addition to the previous factors, no significant changes to these trends are anticipated within the foreseeable future, although the overall strength of the regional office market will still be reliant upon economic conditions, which remain slightly fragile

Discretionary Capital Expenditures. Discretionary Capital Expenditure. Presented by Byron Smith, CCIM
 Discretionary Capital Expenditures Discretionary Capital Expenditure Presented by Byron Smith, CCIM Discretionary Capital Expenditure Case Study Overview During the holding period of a commercial real
NAI Houston Office Report First Quarter 2012
 NAI Houston Office Report First Quarter 2012 Houston: Office Report CITYWIDE OFFICE LEASING STATISTICS: ABSORPTION: Measure of Demand in Square Footage for Office Space Total net absorption for 2012 YTD
VOIT REPORTS POSITIVE ABSORPTION FOR OFFICE AND LOW INDUSTRIAL VACANCY IN ORANGE COUNTY Q1 MARKET REPORTS
 Contact: Jerry Holdner Voit Real Estate Services (949) 263-5371 Jholdner@voitco.com VOIT REPORTS POSITIVE ABSORPTION FOR OFFICE AND LOW INDUSTRIAL VACANCY IN ORANGE COUNTY Q1 MARKET REPORTS Orange County,
Lents Town Center Mixed-Use Market Study Office Market Analysis Lents, Oregon
 Lents Town Center Mixed-Use Market Study Office Market Analysis Lents, Oregon Portland Development Commission January 2008 Draft Copy 9220 SW Barbur Boulevard Portland, Oregon 97219 503.636.1659 www.marketekinc.com
Regional Markets for Office and Industrial Space
 Regional Markets for Office and Industrial Space FEELING PAIN: REGIONAL MARKETS FOR OFFICE AND INDUSTRIAL SPACE I ve never seen anything like this in 36 years. Sharon Ryals-Taylor, Thalhimer Commercial
Vacancy Rate Increases Above 20% As Space Givebacks Continue
 OFFICE LOS ANGELES MARKET REPORT Rate Increases Above 20% As Space Givebacks Continue MARKET OVERVIEW MARKET INDICATORS - VACANCY 20.1% NET ABSORPTION -137,400 CONSTRUCTION 508,200 RENTAL RATE $34.56 P
March 13, 2006. Hon. Scott M. Stringer Manhattan Borough President 1 Centre Street New York, NY 10007. Dear Borough President Stringer:
 THE CITY OF NEW YORK INDEPENDENT BUDGET OFFICE 110 WILLIAM STREET, 14 TH FLOOR NEW YORK, NEW YORK 10038 (212) 442-0632 FAX (212) 442-0350 EMAIL: ibo@ibo.nyc.ny.us http://www.ibo.nyc.ny.us Hon. Scott M.
OFFICE MARKET ANALYSIS SUBURBAN CHICAGO. According to Costar Property, the Suburban Chicago office market is distributed as follows:
 OFFICE MARKET ANALYSIS SUBURBAN CHICAGO Market Composition & Distribution According to Costar Property, the Suburban Chicago office market is distributed as follows: Office Submarket Cluster Distribution
Renewals Dominate Downtown Los Angeles Activity as Vacancy Decreases
 office downtown LOS ANGELES market report Renewals Dominate Downtown Los Angeles Activity as Decreases Market overview MARKET indicators - VACANCY 18.1% NET ABSORPTION 68,400 CONSTRUCTION 1,042,900 RENTAL
Real Estate Trends. in the Sacramento Region. Key Points
 Real Estate Trends The opening of Golden 1 Center in the fall of 2016 will certainly be one of the most significant events in recent Sacramento history. Golden 1 Center Downtown Sacramento photo credit:
EQUITY OFFICE ANNOUNCES FIRST QUARTER 2004 RESULTS
 Two North Riverside Plaza, Suite 2100 Chicago, Illinois 60606 phone 312.466.3300 fax 312.454.0332 www.equityoffice.com Equity Office (Investors/Analysts): Diane Morefield 312.466.3286 Equity Office (Media):
BUSINESS BRIEFING SELF STORAGE
 BUSINESS BRIEFING VALUATION & ADVISORY A Cushman & Wakefield Valuation & Advisory Publication JANUARY 2015 SOLID YEAR AHEAD IN As we enter 2015, investors always ask about market expectations for the New
4Q 15. Industrial Market Report
 4Q 15 Industrial Market Report ST. LOUIS, MO The Market Multiple indicators point towards 2016 as a year of continued construction for the St. Louis Industrial Market. The 2.3 million square feet of new
Economic Impact and Development Analysis. Proposed Sports Entertainment District
 THE LONDON GROUP Economic Impact and Development Analysis Proposed Sports Entertainment District Prepared For: The City of Escondido November 2010 The London Group 2010 Report Prepared by: Gary H. London,
Conditions of the Chicago Real Estate Market
 Conditions of the Chicago Real Estate Market Downtown Office Market 2015 March 12, 2015 presented by: David J. Gelfand Executive Vice President Colliers International david.gelfand@colliers.com Square
INDUSTRIAL QUICK STATS SUMMARY & OUTLOOK MARKET TRENDS VACANCY & NET ABSORPTION ECONOMIC STATS
 ORANGE COUNTY INDUSTRIAL SECOND QUARTER 216 QUICK STATS Direct Vacancy 2.6% Overall Vacancy 2.7% Lease Rate NNN $.82 Gross Absorption Under Construction MARKET TRENDS Current Quarter 3,969,645 SF 41,668
Vacancy Down, Rental Rates Up
 Research & Forecast Report ST. LOUIS OFFICE First Quarter 2016 Vacancy Down, Rental Rates Up Business as usual for the St. Louis office market during first quarter 2016. Suburban office continues to drive
The Little Train That Could
 Research & Forecast Report RENO OFFICE Q3 2015 The Little Train That Could > > Rents continued to move higher as rates over $2.00 per square foot are becoming more common in the Class A buildings in the
Lease-Versus-Buy. By Steven R. Price, CCIM
 Lease-Versus-Buy Cost Analysis By Steven R. Price, CCIM Steven R. Price, CCIM, Benson Price Commercial, Colorado Springs, Colorado, has a national tenant representation and consulting practice. He was
New York City Office Market Report, First Quarter 2013
 New York City Office Market Report, First Quarter 213 Q1-213 New York City Office Market Report, First Quarter 213 OFFICE MARKET # BLDGS. TOTAL RBA DIRECT SUBLET TOTAL TOTAL AVERAGE UNDER (SF) AVAILABLE
More Liquidity in Debt and Equity Markets to Spur Higher Investment Activity
 -morenews release for immediate release Contact: Erin Mays Phone: 312.698.6735 Email: erin.mays@grubb-ellis.com Grubb & Ellis Predicts Commercial Real Estate Leasing Recovery to Proceed in 2011, Multi
Minneapolis/St. Paul Office MarketView
 Minneapolis/St. Paul Office MarketView Q2 2014 CBRE Global Research and Consulting BIG 2ND QUARTER HAS VACANCY RATE TRENDING DOWNWARD Quick Stats GDP GROWTH MN EXPORTS MN UNEMPLOYMENT CONSUMER SPENDING
Fiscal impact analysis of three development scenarios in Nashville-Davidson County, TN
 Fiscal impact analysis of three development scenarios in Nashville-Davidson County, TN April 2013 Prepared by 1 SUMMARY BY SMART GROWTH AMERICA Summary This study examines the relative fiscal costs and
Market Report MANHATTAN OFFICE 2Q 2015. Leasing Activity MSF. Absorption SF. Availability Rate 10.1% -0.6pp -0.9pp N/A. Average Asking Rent ($/SF/YR)
") Market Report MANHATTAN OFFICE 2Q 2015 Accelerating success. 2Q 2015 Quarter-to- Quarter Change Year-to- Year Change YTD 2015 ± % $ Leasing Activity MSF Absorption SF 8,087,659-2.8% -8.0% 16,409,154 2,890,076
Market Report MANHATTAN OFFICE 2Q 2015 Accelerating success. 2Q 2015 Quarter-to- Quarter Change Year-to- Year Change YTD 2015 ± % $ Leasing Activity MSF Absorption SF 8,087,659-2.8% -8.0% 16,409,154 2,890,076
Central Los Angeles Leasing Activity Surges Despite Negative Absorption
 office CENTRAL LOS ANGELES market report Central Los Angeles Leasing Activity Surges Despite Negative Absorption Market overview MARKET indicators - VACANCY 19.8% NET ABSORPTION -112,300 CONSTRUCTION 1,242,600
SUBJECT: Interim Audit Report for Clerk s Print Shop Operations, Renewal of the Lease Agreement for the Clerk s Printing Services Building
 REPORT NO. 2009-14 TO: FROM: Ken Burke Robert W. Melton, Chief Deputy Director Internal Audit Division SUBJECT: Interim Audit Report for Clerk s Print Shop Operations, Renewal of the Lease Agreement for
INCOME APPROACH Gross Income Estimate - $198,000 Vacancy and Rent Loss - $9,900
 INCOME APPROACH The Income Approach considers the return on Investment and is similar to the method that investors typically use to make their investment decisions. It is most directly applicable to income
Houston s Class A Medical Office Rental Rate Increases by 7.4% in First Half of 2012
 MIDYEAR 2012 MEDICAL OFFICE COLLIERS HEALTHCARE SERVICES GROUP - Houston Texas HEALTHCARE MARKET COMMENTARY Houston Houston s Class A Medical Office Rental Rate Increases by 7.4% in First Half of 2012
Purchasing a Multi-Family Rental Building
 Purchasing a Multi-Family Rental Building New Construction vs. Older Existing There has been a lot of buzz in the Metro Vancouver real estate market regarding the construction of new rental apartment buildings
C O M P R E H E N S I V E H O U S I N G M A R K E T A N A L Y S I S. Dallas, Texas. Summary. Economy. Sales Market
 C O M P R E H E N S I V E H O U S I N G M A R K E T A N A L Y S I S Dallas, Texas U.S. Department of Housing and Urban Development Office of Policy Development and Research As of April 1, 26 Summary Housing
Table 2. 2.56 spreads=eased) Premiums charged on riskier loans 2.35 Loan covenants 2.72 Collateralization requirements 2.89 Other 2.
 Premiums charged on riskier loans 2.35 Loan covenants 2.72 Collateralization requirements 2.89 Other 2.") Table 2 SENIOR LOAN OFFICER OPINION SURVEY ON BANK LENDING PRACTICES AT SELECTED BRANCHES AND AGENCIES OF FOREIGN BANKS IN THE UNITED STATES 1 (Status of policy as of April 2003) Questions 1-5 ask about
Table 2 SENIOR LOAN OFFICER OPINION SURVEY ON BANK LENDING PRACTICES AT SELECTED BRANCHES AND AGENCIES OF FOREIGN BANKS IN THE UNITED STATES 1 (Status of policy as of April 2003) Questions 1-5 ask about
Commercial Real Estate Investing 101
 Commercial Real Estate Investing 101 RealCrowd invest@realcrowd.com 2013 RealCrowd. All rights reserved. A better way to invest in real estate. What is RealCrowd? RealCrowd offers direct real estate investing
>> New Construction Delivers to the Orange County Office Market
 Research & Forecast Report ORANGE COUNTY OFFICE Accelerating success. >> New Construction Delivers to the Orange County Office Market Key Takeaways > Three new office developments were delivered to the
Current Issues Note 27 Central London office market through the recession By Yeukai Muchenje and Nick Ennis
 Current Issues Note 27 By Yeukai Muchenje and Nick Ennis copyright Greater London Authority November 2010 Published by Greater London Authority City Hall The Queen s Walk London SE1 2AA www.london.gov.uk
Midtown South Manhattan Office MarketView
 Midtown South Manhattan Office MarketView CBRE Global Research and Consulting LEASING ACTIVITY 1.1 MSF NYC UNEMPLOYMENT RATE (DEC. 1) 7.5% NYC OFFICE EMPLOYMENT (DEC. 1) 1,6, U.S. GDP CHANGE (Q 1) 4.1%
New York City Office Market Report, Second Quarter 2013
 New York City Office Market Report, Second Quarter 2013 2013 NAI Global The contents of this report are intended for the individuals to whom it is presented or delivered and their company associates. Any
The CoStar Office Report. F i r s t Q u a r t e r 2 0 1 5 National Office Market
 The CoStar Office Report F i r s t Q u a r t e r 2 0 1 5 First Quarter 2015 National Table of Contents Table of Contents................................................................. A Methodology......................................................................
Sales Velocity Surges as Rents Push Higher
 Research & Forecast Report GREATER PHOENIX MULTIFAMILY 2 Sales Velocity Surges as Push Higher Key Takeaways > > The Greater Phoenix multifamily market continued to improve in the fourth quarter, capping
Commercial/Industrial Market Analysis for Scott County, Minnesota
 Commercial/Industrial Market Analysis for Scott County, Minnesota Prepared for: Scott County Community Development Agency Shakopee, Minnesota February 2012 1221 Nicollet Mall Suite 218 Minneapolis, MN
Tenure by Household Size - 2009
 NEIGHBORHOOD APARTMENT MARKET ANALYSIS CITY OF CHICAGO Market Composition & Distribution The neighborhood apartment market consists of a range of properties developed from the early 1900s to more modern,
49.4 % 7 % 4.3 % 94.8 % NEWSLETTER MAY 2015 ANNUAL RENT GROWTH FROM ACQUISITION. AFFO PAYOUT RATIO (as at Q1/15) DISTRIBUTION YIELD
 DISTRIBUTION YIELD") NEWSLETTER Starlight U.S. Multi-Family (No. 2) Core Fund (the Fund ) is listed on the TSX Venture Exchange. The Fund is sponsored and asset managed by Starlight Investments Ltd. (the Manager ). The Fund
NEWSLETTER Starlight U.S. Multi-Family (No. 2) Core Fund (the Fund ) is listed on the TSX Venture Exchange. The Fund is sponsored and asset managed by Starlight Investments Ltd. (the Manager ). The Fund
Module 2: Preparing for Capital Venture Financing Financial Forecasting Methods TABLE OF CONTENTS
 Module 2: Preparing for Capital Venture Financing Financial Forecasting Methods Module 2: Preparing for Capital Venture Financing Financial Forecasting Methods 1.0 FINANCIAL FORECASTING METHODS 1.01 Introduction
CHAPTER 19 DATA SOURCES FOR REAL ESTATE MARKET ANALYSIS
 CHAPTER 19 DATA SOURCES FOR REAL ESTATE MARKET ANALYSIS INTRODUCTION SOURCES FOR REAL ESTATE MARKET DATA SOURCES FOR ECONOMIC AND DEMOGRAPHIC DATA INTRODUCTION Below we provide a partial list of sources
Milwaukee, WI 4th Quarter 2014 OFFICE. Market Trends COMMERCIAL REAL ESTATE INFORMATION. In partnership with
 Milwaukee, WI 4th Quarter 2014 OFFICE Market Trends COMMERCIAL REAL ESTATE INFORMATION In partnership with Table of Contents/Methodology of Tracked Set Table of Contents/Methodology of Tracked Set 2 Milwaukee
Suburban Boston Office MarketView
 Suburban Boston Office MarketView CBRE Global Research and Consulting U.S. UNEMPLOYMENT 7.3% MA UNEMPLOYMENT 7.2% OCCUPIED SF 93.3M AVAILABILITY 20.5% SUBLEASE SF 2.9M UNDER CONSTRUCTION 1.1M *Arrows indicate
Before you develop or acquire a property, you must know how big it is size is the key metric for real estate.
 Real Estate Development Key Terms If you want to understand real estate development, you need to know the key terms used to describe properties whether you re developing the properties from the ground
Housing Markets in Six Metropolitan Areas and their Main Central Cities
 Housing Markets in Six Metropolitan Areas and their Main Central Cities Rolf Pendall Director, Metropolitan Housing and Communities Policy Center, The Urban Institute Housing issues and opportunities at
OHIO RESEARCH RECOVERY STILL PROGRESSING. Brian T. Graham, CCIM Valuation & Advisory Services Director of Research Ohio brian.graham@colliers.
 Q2 2013 OVERALL OHIO RESEARCH RECOVERY STILL PROGRESSING EXECUTIVE SUMMARY The second quarter in Ohio kept a steady pace, as most markets and specialties saw good demand, positive absorption and a healthy
COMMERCIAL REAL ESTATE INVESTING
 REDEFINING REAL ESTATE INVESTING CRE101: INTRODUCTION TO COMMERCIAL REAL ESTATE INVESTING COMMERCIAL REAL ESTATE INVESTING ABOUT REALCROWD RealCrowd is a private, secure and simple-to-use online platform
Build-to-Rent Program
 About Greystone 1 Greystone is a single-family home builder that utilizes a solutions based approach to deliver the highest quality new construction rental properties with exceptional returns to the investor.
Office Market Analysis
 Office Market Analysis Kyle Smith, Regional Multiple List Service [RMLS] Fellow & Certificate of Real Estate Development Graduate Student Portland Office Market Grubb & Ellis reports that the market-wide
DEUTSCHE ASSET & WEALTH MANAGEMENT REAL ESTATE OUTLOOK
 Research Report DEUTSCHE ASSET & WEALTH MANAGEMENT REAL ESTATE OUTLOOK Second Quarter 2013 Economic Outlook Business and consumer spending to drive recovery Quantitative easing beginning its expected unwinding
PREDICTING LONG-TERM TRENDS & MARKET CYCLES IN COMMERCIAL REAL ESTATE
 PREDICTING LONG-TERM TRENDS & MARKET CYCLES IN COMMERCIAL REAL ESTATE by Glenn R. Mueller Working Paper #388 10/24/01 Land, together with labor and capital, is one of the three major factors of production.
For the non real estate professional
 For the non real estate professional An introductory case study of the building of a Transit Oriented Development Views from For Profit vs. Non-Profit Developers For Profit Developer Non-Profit Developer
Peeling The Onion on Capitalization Rates
 The compression in cap rates during the 2005-2007 commercial real estate (CRE) bubble led to miscalculations on the part of many sophisticated investors in regards to exit valuations. As we quantitatively
After Strong 2015, Omaha Exudes Cautious Optimism
 Research & Forecast Report OMAHA OFFICE Fourth Quarter 2015 After Strong 2015, Omaha Exudes Cautious Optimism The Omaha office market continued to improve in the fourth quarter of 2015 as it experienced
Net absorption was negative 67,299 square feet this quarter, marking a second consecutive quarter of negative net absorption.
 NAI Earle MEMBER Furman, NAME LLC Office Report First Second Quarter Quarter 20072009 Upstate Market TRENDS: STATISTICS: Vacancy Rate Net Absorption Number of Buildings...3,288 Market Size (SF)...31,367,198
Miami DDA Office Area. (134 Office Buildings)
") Miami DDA Office Area (134 Office Buildings) Miami Dade County Office Employment Growth 1988 to 2013: Following economic downturn, Miami Dade County office employment experiencing modest, but sustained
Miami DDA Office Area (134 Office Buildings) Miami Dade County Office Employment Growth 1988 to 2013: Following economic downturn, Miami Dade County office employment experiencing modest, but sustained
MAKE BIG DATA WORK FOR YOU INCOME/EXPENSE ANALYSIS REPORTS INTERACTIVE ONLINE LABS WWW.IREM.ORG/INCOMEEXPENSE FEATURING WITH PROPERTY DATA FOR:
 INCOME/EXPENSE ANALYSIS REPORTS FEATURING INTERACTIVE ONLINE LABS MAKE BIG DATA WORK FOR YOU WWW.IREM.ORG/INCOMEEXPENSE WITH PROPERTY DATA FOR: OFFICE BUILDINGS APARTMENTS SHOPPING CENTERS CONDOMINIUMS
Market Segmentation: The Omaha Condominium Market
 Market Segmentation: The Omaha Condominium Market Page 1 Market Segmentation: The Omaha Condominium Market Roger P. Sindt Steven Shultz Department of Economics and Real Estate University of Nebraska at
Houston Medical Office Market Slowly Recovering
 Q4 2011 COLLIERS HEALTHCARE SERVICES GROUP - Houston Texas HEALTHCARE MARKET COMMENTARY Houston Medical Office Market Slowly Recovering Houston Houston s medical office market closed 4Q 2011 with encouraging
Investment Analyst Case Study Iron Bank Real Estate Investors The Lyric (215 10 th Ave E) Seattle-Tacoma-Bellevue Metro
 Seattle-Tacoma-Bellevue Metro") Investment Analyst Case Study Iron Bank Real Estate Investors The Lyric (215 10 th Ave E) Seattle-Tacoma-Bellevue Metro OVERVIEW The Lyric ( Property ) is being offered for sale with an asking price of
Investment Analyst Case Study Iron Bank Real Estate Investors The Lyric (215 10 th Ave E) Seattle-Tacoma-Bellevue Metro OVERVIEW The Lyric ( Property ) is being offered for sale with an asking price of
Understanding the APOD How to Crunch the Numbers on Your Investment Transaction
 Understanding the APOD How to Crunch the Numbers on Your Investment Transaction Commercial Investment Education Alliance Commercial Success Series 105 1 Commercial Investment Education Alliance Please
Oklahoma City Industrial Market Leasing. OKC Industrial Market Information by Submarkets, Classes and Sizes
 03Executive Summary 04 04 04 05 06 08 09 10 11 13 National Economy Local Economy Oklahoma City Industrial Market Leasing Net Absorption and Inventory Rental Rates and Vacancy Rates OKC Industrial Market
Economic Forecast OUTPUT AND EMPLOYMENT WHAT THE TABLE SHOWS:
 Economic Forecast OUTPUT AND EMPLOYMENT 7 8 9 1 11 1 13 1 United States Real GDP $ billions (fourth quarter) $1,996 $1,575 $1,5 $1,9 $15, $15,5 $15,97 $16,6 % change over the four quarters 1.9% -.8% -.%.8%.%.%.%
CB RICHARD ELLIS RESEARCH AND CONSULTING. Special Report DUBLIN - A COMPARATIVE ANALYSIS OF COMPETING OFFICE MARKETS
 CB RICHARD ELLIS RESEARCH AND CONSULTING Special Report DUBLIN - A COMPARATIVE ANALYSIS OF COMPETING OFFICE MARKETS August 2010 TABLE OF CONTENTS Foreword 4 Introduction 5 Corporate Tax Rates 6 Rents
BTB Real Estate Investment Trust Management Discussion and Analysis. Quarter ended June 30, 2014. Space for. growth
 BTB Real Estate Investment Trust Management Discussion and Analysis Quarter ended June 30, 2014 Space for growth Table of Contents 11 Introduction 11 Forward-Looking Statements Caveat 12 Non-IFRS Financial
Press release first quarter figures 2010
 Press release first quarter figures 2010 VASTNED RETAIL REALISES DIRECT INVESTMENT RESULT OF 17.1 MILLION IN SPITE OF DIFFICULT LETTING MARKET; VALUE MOVEMENTS IN PROPERTY PORTFOLIO BACK INTO BLACK AFTER
Commercial Real Estate Vacancy Overview
 Commercial Real Estate Vacancy Overview RETAIL 4.63% 5.31% increase SUBURBAN OFFICE 18.2% 4.15% increase CBD OFFICE 12.75% 4.86% decrease INDUSTRIAL 5.69% 2.91% increase YEAREND 215 The Lexington commercial
Lecture Notes. Dollars and Sense of Building Rehabilitation. Attracting Equity and Debt. National Development Council
 1 Dollars and Sense of Building Rehabilitation Attracting Equity and Debt 2 Lecture Notes 927 Dudley Road Edgewood, KY 41017 ph: 859-578-4850 fax: 859-578-4860 2006 All rights reserved. Version: August
Economic Forecast OUTPUT AND EMPLOYMENT WHAT THE TABLE SHOWS:
 June, Economic Forecast OUTPUT AND EMPLOYMENT 7 8 9 5 United States Real GDP $ billions (fourth quarter) $,996 $,575 $,5 $,9 $5, $5,5 $5,9 $6,5 $7, % change over the four quarters.9% -.8% -.%.8%.%.%.6%.5%.8%
Midwest Region. Chicago Cincinnati Cleveland Columbus Detroit Indianapolis Kansas City Milwaukee Minneapolis Omaha St.
 Midwest Region Chicago Cincinnati Cleveland Columbus Detroit Indianapolis Kansas City Milwaukee Minneapolis Omaha St. Louis Toledo MidwestMarketSnapshot Trusted Advice. Proven Performance. CBRE/Torto Wheaton
Step 1: Determine the Size, Parameters and Construction Timeline for the Property
 The Real Estate Development Process While real estate development models may look complex, the actual concepts are simpler than what you see for normal companies. Real estate development modeling is different
Land Advisory Group Specialized Real Estate Services
 COLLIERS INTERNATIONAL Land Advisory Group Specialized Real Estate Services Accelerating success. Colliers International Land Advisory Group P. 1 This document has been prepared by Colliers International
Tabletop Exercises: Allowance for Loan and Lease Losses and Troubled Debt Restructurings
 Tabletop Exercises: Allowance for Loan and Lease Losses and Troubled Debt Restructurings Index Measuring Impairment Example 1: Present Value of Expected Future Cash Flows Method (Unsecured Loan)... - 1
EASTGROUP PROPERTIES ANNOUNCES THIRD QUARTER 2015 RESULTS
 FOR MORE INFORMATION, CONTACT: David H. Hoster II, Chief Executive Officer Marshall Loeb, President and Chief Operating Officer N. Keith McKey, Chief Financial Officer (601) 354-3555 EASTGROUP PROPERTIES
Momentum Traders in the Housing Market: Survey Evidence and a Search Model
 Federal Reserve Bank of Minneapolis Research Department Staff Report 422 March 2009 Momentum Traders in the Housing Market: Survey Evidence and a Search Model Monika Piazzesi Stanford University and National
Tab 2 - Multifamily Housing Core Underwriting Application
 Tab 2 - Multifamily Housing Core Underwriting Application An Application is required to be completed for all Agency Multifamily programs. Be sure to complete all sections, answer all questions, and provide
Government Properties Income Trust Announces Third Quarter 2015 Results
 FOR IMMEDIATE RELEASE Contact: Olivia Snyder, Investor Relations Analyst (617) 219-1410 Government Properties Income Trust Announces Third Quarter 2015 Results Normalized FFO of $0.59 Per Share for the
OKC Multi-Family Market Leasing by Classes and Unit Mix. OKC Multi-Family Market Leasing Information by Submarkets
 03Executive Summary 04 04 05 05 06 07 08 09 11 National Economy Local Economy OKC Multi-Family Market Leasing by Classes and Unit Mix OKC Multi-Family Market Leasing Information by Submarkets Construction,
Specialized Real Estate Solutions: Investor Services
 Specialized Real Estate Solutions: Investor Services United States Accelerating success. Industrial Grade: AGILE. Sturdy. ResilienT. Industrial real estate professionals at Colliers International bring
1041 N. California Chicago, IL 60622 3 Unit Mixed-Use $399,900
 Chicago, IL 60622 3 Unit Mixed-Use $399,900 Interra Realty LLC 640 North LaSalle Street, Ste 200 Chicago, Illinois 312-361-3140 www.interrarealty.com info@interrarealty.com CONFIDENTIALITY AND DISCLAIMER
Underwriting Commercial Loans
 Underwriting Commercial Loans T he objective of this study is to understand the basic principles of underwriting for multifamily housing and commercial real estate loans. As a mortgage broker, real estate
Director s Guide to Credit
 Federal Reserve Bank of Atlanta Director s Guide to Credit This guide was created by the Supervision and Regulation Division of the Federal Reserve Bank of Atlanta, 1000 Peachtree Street NE, Atlanta,
Chapter 12. Introduction to Value Determination
 Chapter 12 Value Theory, Highest and Best Use Analysis, and the Cost Approach 11/17/2005 FIN4777 - Special Topics in Real Estate - Professor Rui Yao 1 Introduction to Value Determination Price is usually
Milwaukee, WI 1st Quarter 2015 OFFICE. Market Trends COMMERCIAL REAL ESTATE INFORMATION. In partnership with
 Milwaukee, WI 1st Quarter 2015 OFFICE Market Trends COMMERCIAL REAL ESTATE INFORMATION In partnership with Table of Contents/Methodology of Tracked Set Table of Contents/Methodology of Tracked Set 2 Milwaukee
Summary. Abbas P. Grammy 1 Professor of Economics California State University, Bakersfield
 The State of the Economy: Kern County, California Summary Abbas P. Grammy 1 Professor of Economics California State University, Bakersfield Kern County households follow national trends. They turned less
National Property Type Cycle Locations. Hotel Full-Service Hotel Ltd. Service Retail 1st Tier Regional Mall. Retail Neighborhood/Community
 Cycle Monitor Real Estate Market Cycles Fourth Quarter 0 Analysis February 0 Physical Market Cycle Analysis of All Five Major Property Types in More Than 0 MSAs. U.S. GDP growth of.% was more than double
FHA Section 542(c) Risk-Sharing Program for Multifamily Housing Program Rules
 Risk-Sharing Program for Multifamily Housing Program Rules") FHA Section 542(c) Risk-Sharing Program for Multifamily Housing Program Rules Purpose Kentucky Housing Corporation (KHC) has partnered with HOPE of Kentucky, LLC, and the Community Reinvestment Fund, USA
FHA Section 542(c) Risk-Sharing Program for Multifamily Housing Program Rules Purpose Kentucky Housing Corporation (KHC) has partnered with HOPE of Kentucky, LLC, and the Community Reinvestment Fund, USA
Real Estate Investment Newsletter July 2004
 The Case for Selling Real Estate in California This month I am writing the newsletter for those investors who currently own rental properties 1 in California. In any type of investing, be it real estate,
GENERAL MATH PROBLEM CATEGORIES AND ILLUSTRATED SOLUTIONS MEASUREMENT STANDARDS WHICH MUST BE MEMORIZED FOR THE BROKER TEST
 Chapter 17 Math Problem Solutions CHAPTER 17 GENERAL MATH PROBLEM CATEGORIES AND ILLUSTRATED SOLUTIONS MEASUREMENT STANDARDS WHICH MUST BE MEMORIZED FOR THE BROKER TEST Linear Measure 12 inches = 1 ft
Land Acquisition and Development Finance Part I
 Land Acquisition and Development Finance Part I Introduction. Land Development is both an art and a science. It is an art that builds on your creativity, instincts and vision to transform an idea from
West Los Angeles Market Sees Negative Demand for First Time in Twelve Quarters
 OFFICE MARKET REPORT West Los Angeles Market Sees Negative Demand for First Time in Twelve Quarters MARKET OVERVIEW MARKET INDICATORS - VACANCY 12.9% NET ABSORPTION -349,900 CONSTRUCTION 972,700 RENTAL
C&W ECONOMIC UPDATE NATIONAL ECONOMIC OUTLOOK & REGIONAL OFFICE MARKET UPDATE: NEW YORK U.S. & NEW YORK CITY
 C&W ECONOMIC U.S. & NEW YORK CITY NATIONAL ECONOMIC OUTLOOK & REGIONAL OFFICE MARKET : NEW YORK The national economy remains in slow growth mode as the uncertainty created by the seemingly endless series
70,000 Rosemont O Hare. * MB Financial purchased6111 N. River Road with plans to occupy 150,000 RSF and lease the balance.
 During the Third Quarter 2003, lease activity levels were stronger than they have been all year, and perhaps as strong as activity has been since mid 2000. Activity has been bolstered by a number of significant
Sublease Space Thwarts a Good Quarter
 Research & Forecast Report RENO INDUSTRIAL Q3 Sublease Space Thwarts a Good Quarter > > Overall vacancy rate rose to 10.95% (without sublease space 8.16%) > > New construction completions totaled 626,000
MAPLEWOOD INTERNATIONAL REIT 2014 Second Quarter MD&A
 MANAGEMENT S DISCUSSION AND ANALYSIS and six June 30, 2014 August 15, 2014 TABLE OF CONTENTS CAUTION REGARDING FORWARD-LOOKING STATEMENTS... 1 BASIS OF PRESENTATION... 1 BUSINESS OVERVIEW... 2 INVESTMENT
Sublease Overview. Office users are taking advantage of lower lease rates on higher quality product.
 Key Office Market Indicators Henry County, GA 12-month outlook 1Q 2013 statistics Total office inventory 1,508,404 SF Building Overview/Current Offering Address: Location: Building Class: Year Built: 2007
West Michigan-Grand Rapids Commercial Real Estate Review and Forecast
 Seidman Business Review Volume 17 Issue 1 Article 5 Winter 211 West Michigan-Grand Rapids Commercial Real Estate Review and Forecast Jeff L. Williams Follow this and additional works at: http://scholarworks.gvsu.edu/sbr
Leasing activity drives new construction in Milwaukee
 MARKETVIEW Milwaukee Office, Q3 2015 Leasing activity drives new construction in Milwaukee Vacancy Rate 15.5% Lease Rate $22.29 PSF Net Absorption 108,597 SF Under Construction 563,717 SF *Arrows indicate