W.C. Rusty Riese, PhD Adjunct Professor, Rice University
|
|
|
- Leslie Cain
- 10 years ago
- Views:
Transcription
1 W.C. Rusty Riese, PhD Adjunct Professor, Rice University

2 What are we being told? What are the data? What are the take-aways? What are your responsibilities?

3 Mann Hockey Stick Curve

4

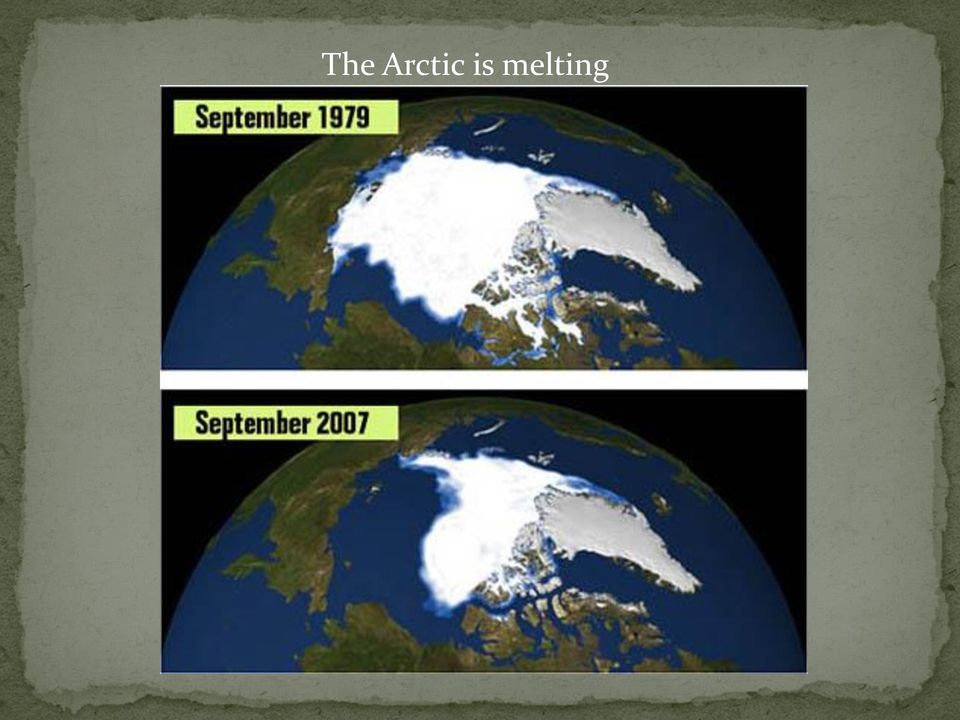
5 The Arctic is melting
6 Glaciers are retreating Stumps have been thawing from beneath the Mendenhall Glacier for about 50 years, but recently, considerably more have been found in upright positions with roots still intact. LiveScience, 9/20/2013

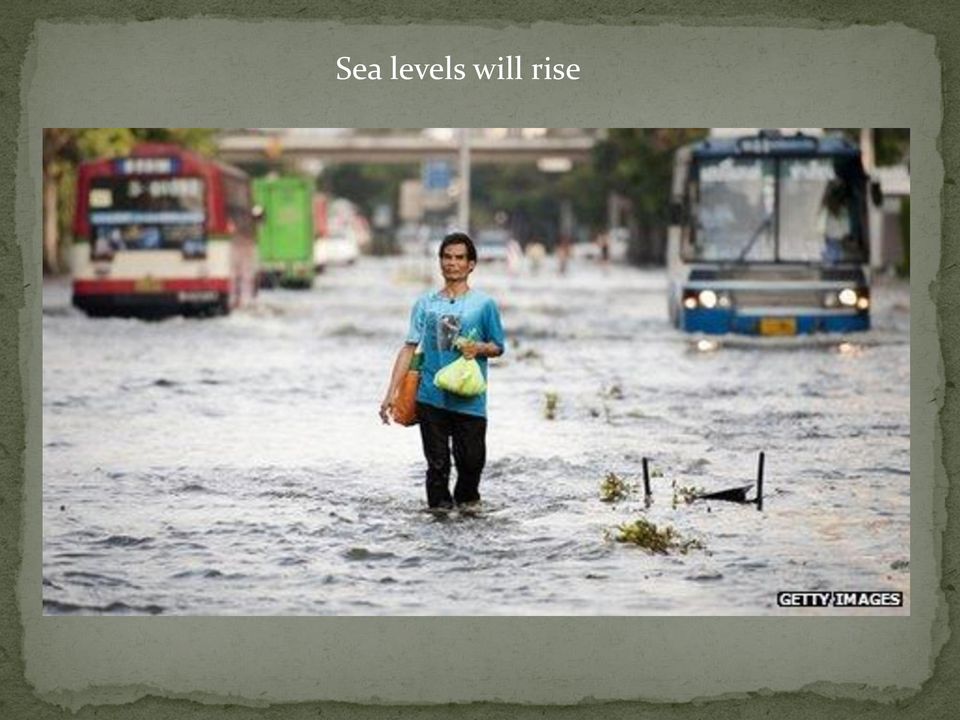
7 Sea levels will rise
8 Coastal cities will be inundated

9 Tropical storms numbers and intensity will increase

10 Tornados will become more frequent and intense

11 Precipitation will increase in frequency and severity

12 Famines will kill millions of people

13 But what do the data show?

14
15
16
17 The most common reference points are 1820, 1850, or Corresponds to the end of the Little Ice Age

18 If we change the reference point to the Medieval Maximum Then we are only just recovering from the Little Ice Age

19 Average Temperature Profiles Differ Slightly by Agency NASA Hadley NOAA

20 New Zealand Processed Data New Zealand Raw Data


21
22
23 So, is the Arctic melting?
24
25
26
27
28 Are glaciers retreating?
29
30
31 A barley field in Iceland. Photo by Páll Stefánsson Archeologists from the Danish National Museum have now proven that Eric the Red, who founded the Icelandic settlement in Greenland at the end of the tenth century AD, and his contemporaries were able to brew ale* DailyNews, 1/30/2012
32 Is sealevel rising? Increases are following the 150 year trend
33 Have tropical storms become more frequent or intense?

34 Have tornados become more frequent and intense?
35

36 Has precipitation changed in intensity or severity?
37

38
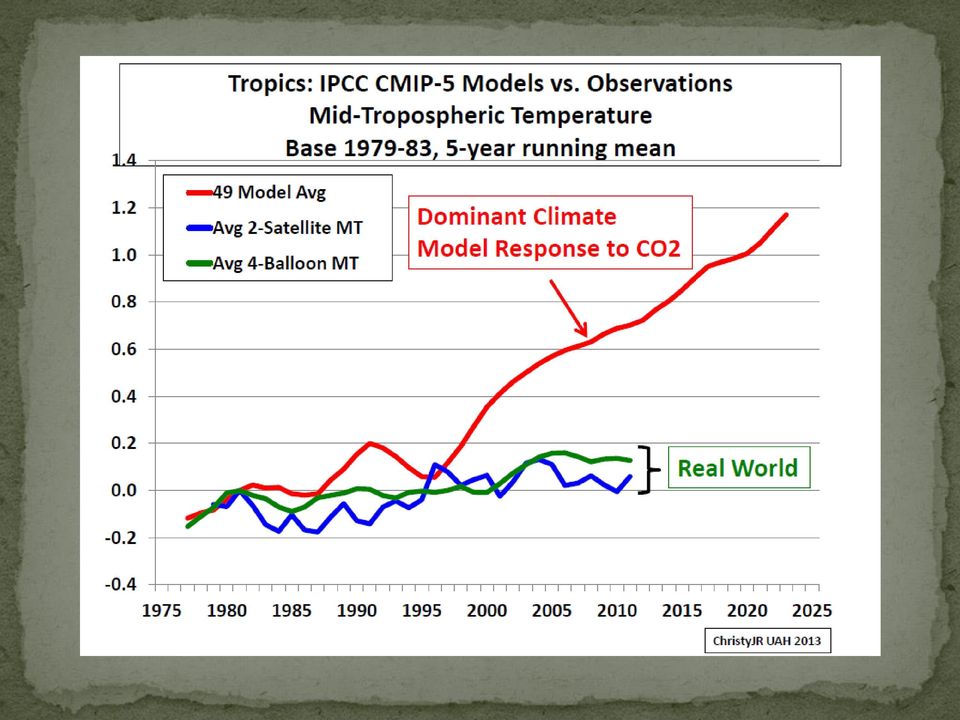
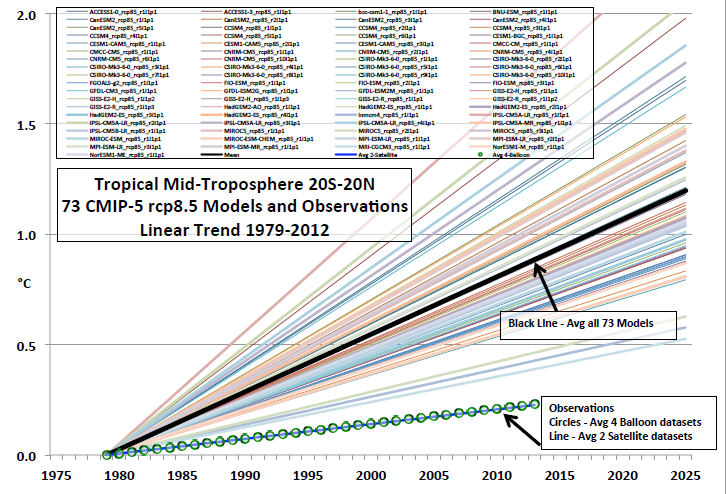
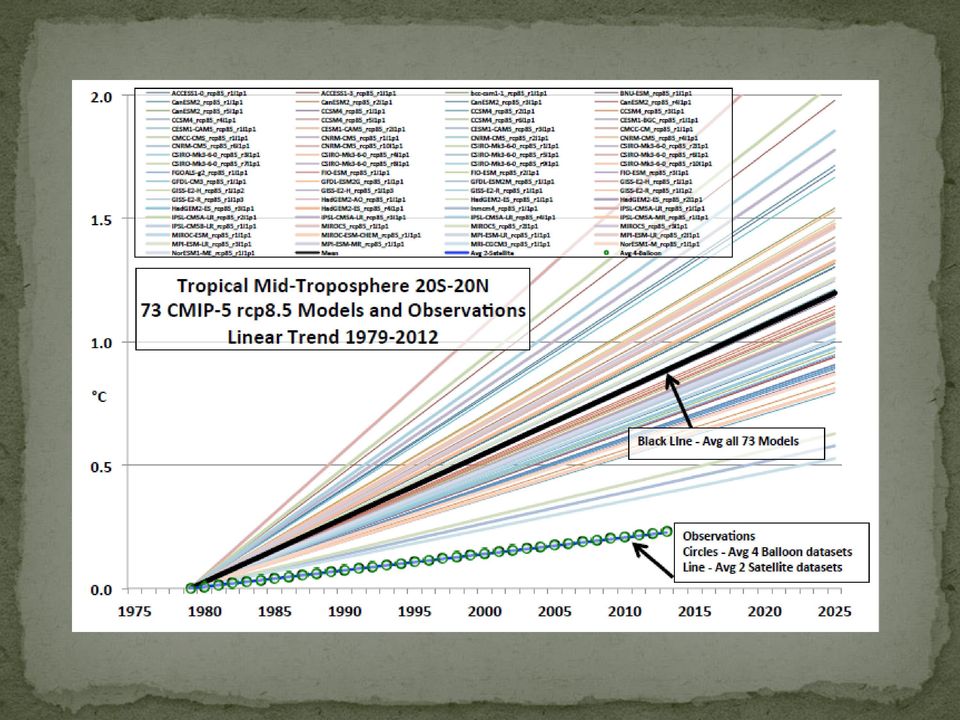
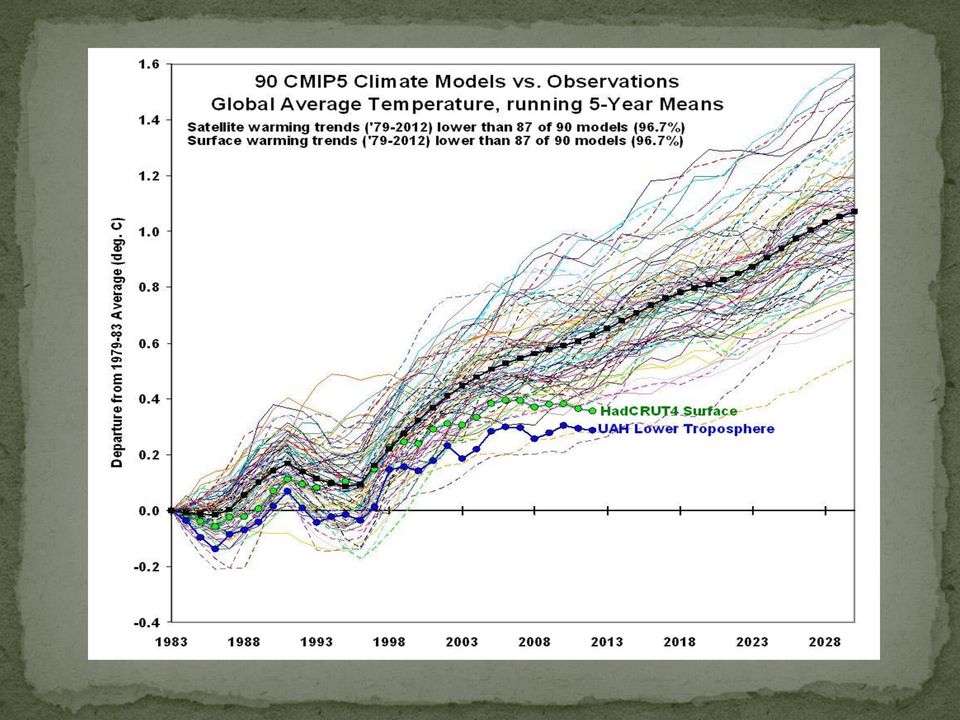
39 So, does atmospheric CO2 really drive climate change?
40
41
42 5 th IPCC report, January 30, 2014
43
44
45 Christopher Monckton, WUWT, 9/11/2013
46 Christopher Monckton, WUWT, 9/11/2013 Christopher Monckton, WUWT, 9/11/2013
47 Christopher Monckton, WUWT, 9/11/2013
48 Mann Hockey Stick Curve
49 What then is driving climate change?
50


51 After Svensmark re Laken et al Image: Jo Nova
52
53
54
55
56
57
58
59 Global Warming Just the Facts Sea Level Increase Historical rate of 0.07 inches/year not catastrophic May go down No more droughts or storms than normal Ice melting is normal for interglacial periods
60 Global Warming Just the Facts CO 2 Is Not The Cause of Global Warming Temperature increases may cause CO 2 increases Solar Activity Has a Stronger Impact Water vapor in the atmosphere demonstrates a more compelling correlation with temperature
61 Global Warming Just the Facts From mid 1800 s to 1998 Temperatures increased 0.8 o C From 1998 to 2007 Temperatures were flat From 2007 to 2012 Temperatures fell 0.02 to 0.03 o C
62 No amount of experimentation can ever prove me right; a single experiment can prove me wrong. Albert Einstein
63
64
65
66 There has been no universal trend in the overall extent of drought across the continental U.S. since Other trends in severe storms, including the intensity and frequency of tornadoes, hail, and damaging thunderstorm winds, are uncertain. (there is) a lack of any clear trend in landfall frequency along the U.S. eastern and Gulf coasts When averaging over the entire contiguous U.S., there is no overall trend in flood magnitudes.
67
68 Extra slides
69
70 There has been no universal trend in the overall extent of drought across the continental U.S. since Other trends in severe storms, including the intensity and frequency of tornadoes, hail, and damaging thunderstorm winds, are uncertain. Lack of any clear trend in landfall frequency along the U.S. eastern and Gulf coasts When averaging over the entire contiguous U.S., there is no overall trend in flood magnitudes.
71
72 Actual Average Temperature Scaled in whole Degrees Global Mean Temperatures: John Grisham, Source; NASA
73
74 arctic.atmos.uiuc.edu/cryosphere/timeserie s.anom
75
76
77 The Arctic is melting Glaciers are retreating Sea levels will rise Coastal cities will be inundated Tropical storms numbers and intensity will increase Tornados will become more frequent and intense Precipitation will increase in frequency and severity Famines will kill millions of people
78 Headlines Greenland Ice Disappearing Greenland was Green when it was discovered in Been There, Done That
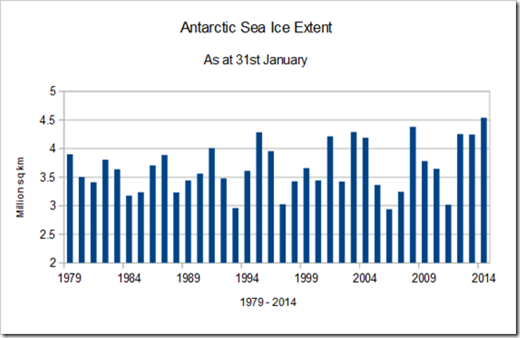
79 Antarctic sea ice extent on September 22 compared to median depicted by orange curve (NSIDC)
80

81
82
83 CET temperatures have been plummeting over the last 13 years (fall 2013 data not included). Chart by Ed Hoskins, data source: UK Met Office. - See more at:
84
85
86 Medieval Climate Optimum Not Medieval Climate Crisis
87 Why Call This A Climate Crisis? Modern Climate Optimum
88 Jan. 23, 2013 A new study provides surprising details on changes in Earth's climate during the last warm period (120, ,000 years ago). Even though temperatures in Northern Greenland were 5-8 degrees Celsius higher than today, the thickness of the ice sheet was only a few hundred meters lower. And this despite the fact that sea level was 4-8 metres higher than today. Science News & Niels Bohr Institute
89 The Arctic is Melting The Arctic seems to be warming up. Reports from fishermen, seal hunters, and explorers who sail the seas about Spitzbergen and the eastern Arctic, all point to a radical change in climatic conditions, and hitherto unheard-of high temperatures in that part of the earth's surface. 1922
90 A change in our climate is taking place very sensibly." Snowfall has become "less frequent and less deep." Rivers that once "seldom failed to freeze over in the course of the winter, scarcely ever do so now." And this is having an especially worrisome effect on the food supply: "This change has produced an unfortunate fluctuation between heat and cold, in the spring of the year, which is very fatal to fruits." "Notes on the State of Virginia" by Thomas Jefferson, 1785.
91 Global Warming Climategate Real Crisis? Alarmist Hype? Fraud?
Jessica Blunden, Ph.D., Scientist, ERT Inc., Climate Monitoring Branch, NOAA s National Climatic Data Center
 Kathryn Sullivan, Ph.D, Acting Under Secretary of Commerce for Oceans and Atmosphere and NOAA Administrator Thomas R. Karl, L.H.D., Director,, and Chair of the Subcommittee on Global Change Research Jessica
Teacher s Guide For. Glaciers and Ice Caps The Melting
 Teacher s Guide For Glaciers and Ice Caps The Melting For grade 7 - College Program produced by Centre Communications, Inc. for Ambrose Video Publishing, Inc. Executive Producer William V. Ambrose Teacher's
Storms Short Study Guide
 Name: Class: Date: Storms Short Study Guide Multiple Choice Identify the letter of the choice that best completes the statement or answers the question. 1. A(n) thunderstorm forms because of unequal heating
Impacts of Global Warming on Hurricane-related Flooding in Corpus Christi,Texas
 Impacts of Global Warming on Hurricane-related Flooding in Corpus Christi,Texas Sea-level Rise and Flood Elevation A one-foot rise in flood elevation due to both sea-level rise and hurricane intensification
Anyone Else Notice That Its Been Windy Lately?
 National Weather Service Aberdeen, South Dakota January 2014 Inside this issue: Has it Been Windy Lately or What? 2013 Year in Review 2013 Year in Review (cont.) 1 2 3 Has it Been Windy Lately or What?
Data Sets of Climate Science
 The 5 Most Important Data Sets of Climate Science Photo: S. Rahmstorf This presentation was prepared on the occasion of the Arctic Expedition for Climate Action, July 2008. Author: Stefan Rahmstorf, Professor
Orbital-Scale Climate Change
 Orbital-Scale Climate Change Climate Needed for Ice Age Warm winter and non-frozen oceans so lots of evaporation and snowfall Cool summer so that ice does not melt Ice Age Model When ice growing ocean
Sea level scenarios and extreme weather events
 Extreme weather and nuclear power plants (EXWE) Sea level scenarios and extreme weather events Milla Johansson, Kimmo Kahma, Hilkka Pellikka, Hanna Tietäväinen, Seppo Saku and Kirsti Jylhä Finnish Meteorological
Climate Ready Tools & Resources
 August 2, 2013 Mission Statement To provide the water sector (drinking water, wastewater, and stormwater utilities) with the practical tools, training, and technical assistance needed to adapt to climate
Geography affects climate.
 KEY CONCEPT Climate is a long-term weather pattern. BEFORE, you learned The Sun s energy heats Earth s surface unevenly The atmosphere s temperature changes with altitude Oceans affect wind flow NOW, you
sample The IPCC Special Report on Managing the Risks of Extreme Events and Disasters to Advance Climate Change Adaptation
 sample The IPCC Special Report on Managing the Risks of Extreme Events and Disasters to Advance Climate Change Adaptation A changing climate leads to changes in extreme weather and climate events 2 Impacts
Trends of Natural Disasters the Role of Global Warming
 Trends of Natural Disasters the Role of Global Warming Prof. Dr. Peter Hoeppe Geo Risks Research Munich Reinsurance Company Geo Risks Research Department of Munich Re - Analyses of natural disasters since
Geohazards: Minimizing Risk, Maximizing Awareness The Role of the Insurance Industry
 Geohazards: Minimizing Risk, Maximizing Awareness The Role of the Insurance Industry Prof. Dr. Peter Hoeppe Head of Geo Risks Research Munich Re International Year of Planet Earth, Paris, 13 February 2008
Georgia Performance Standards Framework for Natural Disasters 6 th Grade
 The following instructional plan is part of a GaDOE collection of Unit Frameworks, Performance Tasks, examples of Student Work, and Teacher Commentary. Many more GaDOE approved instructional plans are
Climate Change on the Prairie:
 Climate Change on the Prairie: A Basic Guide to Climate Change in the High Plains Region - UPDATE Global Climate Change Why does the climate change? The Earth s climate has changed throughout history and
Chapter 3: Climate and Climate Change Answers
 Chapter 3: Climate and Climate Change Answers Section A: Climate 1. (a) Explain what each of the following means: (4 x 1 mark) (i) climate the average weather of an area over a 25 30 year period (ii) maritime
Climate, water and renewable energy in the Nordic countries
 102 Regional Hydrological Impacts of Climatic Change Hydroclimatic Variability (Proceedings of symposium S6 held during the Seventh IAHS Scientific Assembly at Foz do Iguaçu, Brazil, April 2005). IAHS
2013 Annual Climate Summary for the Southeast United States
 Months of heavy rain forced the U.S. Army Corp of Engineers to open the spillways at Lake Hartwell, located at the headwaters of the Savannah River along the South Carolina-Georgia border, on July 9,.
FACTS ABOUT CLIMATE CHANGE
 FACTS ABOUT CLIMATE CHANGE 1. What is climate change? Climate change is a long-term shift in the climate of a specific location, region or planet. The shift is measured by changes in features associated
South Dakota Severe Weather Awareness Week April 22nd through 26th
 National Weather Service Aberdeen, South Dakota April 2013 Inside this issue: Severe Weather Awareness Impact Based Warnings Impact Based Warnings (cont) Record Cold March Record Cold March (cont) Seasonal
Climate Extremes Research: Recent Findings and New Direc8ons
 Climate Extremes Research: Recent Findings and New Direc8ons Kenneth Kunkel NOAA Cooperative Institute for Climate and Satellites North Carolina State University and National Climatic Data Center h#p://assessment.globalchange.gov
The IPCC Special Report on Managing the Risks of Extreme Events and Disasters to Advance Climate Change Adaptation
 The IPCC Special Report on Managing the Risks of Extreme Events and Disasters to Advance Climate Change Adaptation A changing climate leads to changes in extreme weather and climate events 2 How do changes
How Do Oceans Affect Weather and Climate?
 How Do Oceans Affect Weather and Climate? In Learning Set 2, you explored how water heats up more slowly than land and also cools off more slowly than land. Weather is caused by events in the atmosphere.
Tools from the US EPA s Climate Ready Water Utilities Initiative (CRWU) EPA Region 3 Conference Extreme Weather Events: Adapt, Mitigate, and Survive
 EPA Region 3 Conference Extreme Weather Events: Adapt, Mitigate, and Survive") Tools from the US EPA s Climate Ready Water Utilities Initiative (CRWU) EPA Region 3 Conference Extreme Weather Events: Adapt, Mitigate, and Survive May 9, 2013 1 Presentation Overview Background on EPA
Tools from the US EPA s Climate Ready Water Utilities Initiative (CRWU) EPA Region 3 Conference Extreme Weather Events: Adapt, Mitigate, and Survive May 9, 2013 1 Presentation Overview Background on EPA
climate science A SHORT GUIDE TO This is a short summary of a detailed discussion of climate change science.
 A SHORT GUIDE TO climate science This is a short summary of a detailed discussion of climate change science. For more information and to view the full report, visit royalsociety.org/policy/climate-change
How To Use The Climate Ready Utilities Program
 Introduction to the Climate Resilience Evaluation & Awareness Tool Climate Ready Water Utilities Webinar Series Curt Baranowski, US EPA Jim Hawhee, Albemarle-Pamlico NEP February 27, 2013 Use your mouse
WEATHER AND CLIMATE practice test
 WEATHER AND CLIMATE practice test Multiple Choice Identify the choice that best completes the statement or answers the question. 1. What role does runoff play in the water cycle? a. It is the process in
Costs of Global Warming for Alaska s Public Infrastructure
 Costs of Global Warming for Alaska s Public Infrastructure CONTEXT A warming climate results in: Thawing ground Undermining foundations of buildings, roads and runways Retreating sea ice Increasing coastal
Climate of Illinois Narrative Jim Angel, state climatologist. Introduction. Climatic controls
 Climate of Illinois Narrative Jim Angel, state climatologist Introduction Illinois lies midway between the Continental Divide and the Atlantic Ocean, and the state's southern tip is 500 miles north of
PMEL Press Releases and NOAA News Stories FY09- FY14
 PMEL Press Releases and NOAA News Stories FY09- FY14 PMEL WIDE Oceanographer named to head NOAA s Seattle research laboratory http://www.noaanews.noaa.gov/stories2011/20111018_pmel.html CLIMATE THEME most
Graphing Sea Ice Extent in the Arctic and Antarctic
 Graphing Sea Ice Extent in the Arctic and Antarctic Summary: Students graph sea ice extent (area) in both polar regions (Arctic and Antarctic) over a three-year period to learn about seasonal variations
Town of Warwick, Village of Florida, Village of Greenwood Lake and Village of Warwick MULTI JURISIDICTIONAL, MULTI HAZARD MITIGATION PLAN DRAFT
 Town of Warwick, Village of Florida, Village of Greenwood Lake and Village of Warwick MULTI JURISIDICTIONAL, MULTI HAZARD MITIGATION PLAN DRAFT Appendix B Historical Hazard Documentation Rev #0 May 2013
The atmosphere has a number of gases, often in tiny amounts, which trap the heat given out by the Earth.
 The Earth is wrapped in a blanket of air called the atmosphere, which is made up of several layers of gases. The sun is much hotter than the Earth and it gives off rays of heat (radiation) that travel
Monsoon Variability and Extreme Weather Events
 Monsoon Variability and Extreme Weather Events M Rajeevan National Climate Centre India Meteorological Department Pune 411 005 [email protected] Outline of the presentation Monsoon rainfall Variability
WeatherBug Vocabulary Bingo
 Type of Activity: Game: Interactive activity that is competitive, and allows students to learn at the same time. Activity Overview: WeatherBug Bingo is a fun and engaging game for you to play with students!
Climate Change Long Term Trends and their Implications for Emergency Management August 2011
 Climate Change Long Term Trends and their Implications for Emergency Management August 2011 Overview A significant amount of existing research indicates that the world s climate is changing. Emergency
Projections of sea level rise
 Projections of sea level rise Jonathan Gregory Lead author, Chapter 13, Sea level change Yann Arthus-Bertrand / Altitude Causes of global mean sea level rise (GMSLR) Global mean sea level rise is caused
WEATHER AND CLIMATE WHY DOES IT MATTER?
 WEATHER AND CLIMATE Rising global average temperature is associated with widespread changes in weather patterns. Scientific studies indicate that extreme weather events such as heat waves and large storms
Climate Projections for Transportation Infrastructure Planning, Operations & Maintenance, and Design
 Climate Projections for Transportation Infrastructure Planning, Operations & Maintenance, and Design KATHARINE HAYHOE, ANNE STONER, JO DANIEL, JENNIFER JACOBS and PAUL KIRSHEN THE INFRASTRUCTURE CLIMATE
Southern AER Atmospheric Education Resource
 Southern AER Atmospheric Education Resource Vol. 9 No. 5 Spring 2003 Editor: Lauren Bell In this issue: g Climate Creations exploring mother nature s remote control for weather and Climate. g Crazy Climate
Climate Change in Coastal Florida: Economic Impacts of Sea Level Rise
 Climate Change in Coastal Florida: Economic Impacts of Sea Level Rise CLIMTE CHNGE IN COSTL FLORID: ECONOMIC IMPCTS OF SE LEVEL RISE Context Global warming is expected to cause: Sea level rise Increased
The State of the Climate And Extreme Weather. Deke Arndt NOAA s National Climatic Data Center
 The State of the Climate And Extreme Weather Deke Arndt June Feb 2013 2011 1 The world s largest archive of weather and climate data NCDC is located in Asheville, North Carolina A place of active retirement
City of Cambridge Climate Protection Action Committee. Recommendations for Adaptation to Climate Change. Purpose
 City of Cambridge Climate Protection Action Committee Recommendations for Adaptation to Climate Change Purpose The Climate Protection Action Committee (CPAC) is an advisory body to the City Manager on
SETTING THE RECORD STRAIGHT
 SETTING THE RECORD STRAIGHT Responses To Common Challenges To Climate Science January 2009 Climate Leadership Initiative Institute for a Sustainable Environment University of Oregon http://climlead.uoregon.edu
The Polar Climate Zones
 The Polar Climate Zones How cold is it in the polar climate? Polar areas are the coldest of all the major climate zones The Sun is hardly ever high enough in the sky to cause the plentiful ice to melt,
Therefore, this is a very important question, which encourages consideration of the current management of the resource.
 Aalisarnermut, Piniarnermut Nunalerinermullu Naalakkersuisoqarfik Department of Fisheries, Hunting and Agriculture Finn's speech to NAFMC Climate change in the North Atlantic has become a reality which
The Oceans Role in Climate
 The Oceans Role in Climate Martin H. Visbeck A Numerical Portrait of the Oceans The oceans of the world cover nearly seventy percent of its surface. The largest is the Pacific, which contains fifty percent
How To Predict Climate Change In Tonga
 Niuatoputapu Niuafo'ou Late Island Vava u Group South Pacific Ocean Tofua Island Kotu Group Nomuka Group Ha apai Group NUKU ALOFA Eua Island Tongatapu Group Current and future climate of Tonga > Tonga
SIXTH GRADE WEATHER 1 WEEK LESSON PLANS AND ACTIVITIES
 SIXTH GRADE WEATHER 1 WEEK LESSON PLANS AND ACTIVITIES WATER CYCLE OVERVIEW OF SIXTH GRADE WATER WEEK 1. PRE: Evaluating components of the water cycle. LAB: Experimenting with porosity and permeability.
RaysWeather.Com 2015-2016 Winter Fearless Forecast
 Author: Dr. Ray Russell Founder and President of RaysWeather.Com Date: October 10, 2015 RaysWeather.Com 2015-2016 Winter Fearless Forecast Background It's that time of year--leaves change, temperatures
Hurricanes. Characteristics of a Hurricane
 Hurricanes Readings: A&B Ch. 12 Topics 1. Characteristics 2. Location 3. Structure 4. Development a. Tropical Disturbance b. Tropical Depression c. Tropical Storm d. Hurricane e. Influences f. Path g.
Climate Control and Ozone Depletion. Chapter 19
 Climate Control and Ozone Depletion Chapter 19 Global Warming and Global Cooling Are Not New Over the past 4.5 billion years the climate has been altered by Volcanic emissions Changes in solar input Movement
Impacts of Global Warming on North Carolina s Coastal Economy
 Impacts of Global Warming on North Carolina s Coastal Economy IMPACTS OF GLOBAL WARMING ON NORTH CAROLINA S COASTAL ECONOMY Key Findings Global warming is projected to have significant impacts on North
Chapter Overview. Seasons. Earth s Seasons. Distribution of Solar Energy. Solar Energy on Earth. CHAPTER 6 Air-Sea Interaction
 Chapter Overview CHAPTER 6 Air-Sea Interaction The atmosphere and the ocean are one independent system. Earth has seasons because of the tilt on its axis. There are three major wind belts in each hemisphere.
6.4 Taigas and Tundras
 6.4 Taigas and Tundras In this section, you will learn about the largest and coldest biomes on Earth. The taiga is the largest land biome and the tundra is the coldest. The taiga The largest land biome
Climate Change in Mexico implications for the insurance and reinsurance market
 Climate Change in Mexico implications for the insurance and reinsurance market Eberhard Faust Geo Risks Research Munich Reinsurance Company 1980 April 2008: Billion & Ten Billion Dollar Losses The costliest
SPATIAL DISTRIBUTION OF NORTHERN HEMISPHERE WINTER TEMPERATURES OVER THE SOLAR CYCLE DURING THE LAST 130 YEARS
 SPATIAL DISTRIBUTION OF NORTHERN HEMISPHERE WINTER TEMPERATURES OVER THE SOLAR CYCLE DURING THE LAST 130 YEARS Kalevi Mursula, Ville Maliniemi, Timo Asikainen ReSoLVE Centre of Excellence Department of
ROOF-GUARD 101. Affordable Roof Protection For Asphalt Shingles. Manufactured By
 ROOF-GUARD 101 Affordable Roof Protection For Asphalt Shingles Manufactured By 1019 SE Holbrook Ct. Port St. Lucie, FL, 34952 Phone: 772-335-8225 [email protected] Enviroseal has been instrumental in
Fundamentals of Climate Change (PCC 587): Water Vapor
: Water Vapor") Fundamentals of Climate Change (PCC 587): Water Vapor DARGAN M. W. FRIERSON UNIVERSITY OF WASHINGTON, DEPARTMENT OF ATMOSPHERIC SCIENCES DAY 2: 9/30/13 Water Water is a remarkable molecule Water vapor
Fundamentals of Climate Change (PCC 587): Water Vapor DARGAN M. W. FRIERSON UNIVERSITY OF WASHINGTON, DEPARTMENT OF ATMOSPHERIC SCIENCES DAY 2: 9/30/13 Water Water is a remarkable molecule Water vapor
Climate Change is Underway Lesson Plan
 Climate Change is Underway Lesson Plan For Teachers: The following is a lesson plan designed to be used with section of the Climate Change material entitled Climate Change is Underway from the After Earth
Climates are described by the same conditions used to describe
 58 The Causes of Climate R E A D I N G Climates are described by the same conditions used to describe weather, such as temperature, precipitation, and wind. You now know that oceans have an important effect
Grade 4 Standard 1 Unit Test Water Cycle. Multiple Choice. 1. Where is most water found on Earth? A. in glaciers B. in lakes C. in rivers D.
 Grade 4 Standard 1 Unit Test Water Cycle Multiple Choice 1. Where is most water found on Earth? A. in glaciers B. in lakes C. in rivers D. in oceans 2. What source of energy evaporates the most water from
Facts on Arctic Climate Change
 Facts on Arctic Climate Change A Summary of the Arctic Climate Impact Assessment ARCTIC CLIMATE CHANGE will not only affect local people and ecosystems but also the rest of the world, because the Arctic
The Next Generation Science Standards (NGSS) Correlation to. EarthComm, Second Edition. Project-Based Space and Earth System Science
 Correlation to. EarthComm, Second Edition. Project-Based Space and Earth System Science") The Next Generation Science Standards (NGSS) Achieve, Inc. on behalf of the twenty-six states and partners that collaborated on the NGSS Copyright 2013 Achieve, Inc. All rights reserved. Correlation to,
The Next Generation Science Standards (NGSS) Achieve, Inc. on behalf of the twenty-six states and partners that collaborated on the NGSS Copyright 2013 Achieve, Inc. All rights reserved. Correlation to,
Climate Change. Evidence & Causes. An overview from the Royal Society and the US National Academy of Sciences
 Climate Change Evidence & Causes An overview from the Royal Society and the US National Academy of Sciences n summary Foreword CLIMATE CHANGE IS ONE OF THE DEFINING ISSUES OF OUR TIME. It is now more certain
[ Climate Data Collection and Forecasting Element ] An Advanced Monitoring Network In Support of the FloodER Program
![[ Climate Data Collection and Forecasting Element ] An Advanced Monitoring Network In Support of the FloodER Program](/thumbs/33/16326315.jpg "[ Climate Data Collection and Forecasting Element ] An Advanced Monitoring Network In Support of the FloodER Program") [ Climate Data Collection and Forecasting Element ] An Advanced Monitoring Network In Support of the FloodER Program December 2010 1 Introduction Extreme precipitation and the resulting flooding events
[ Climate Data Collection and Forecasting Element ] An Advanced Monitoring Network In Support of the FloodER Program December 2010 1 Introduction Extreme precipitation and the resulting flooding events
Little Ice Age. Edited by. Dr Michael C MacCracken and Dr John S Perry. Encyclopedia of Global Environmental Change (ISBN 0-471-97796-9)
") Little Ice Age Michael E Mann Volume 1, The Earth system: physical and chemical dimensions of global environmental change, pp 54 59 Edited by Dr Michael C MacCracken and Dr John S Perry in Encyclopedia
Little Ice Age Michael E Mann Volume 1, The Earth system: physical and chemical dimensions of global environmental change, pp 54 59 Edited by Dr Michael C MacCracken and Dr John S Perry in Encyclopedia
Future needs of remote sensing science in Antarctica and the Southern Ocean: A report to support the Horizon Scan activity of COMNAP and SCAR
 Future needs of remote sensing science in Antarctica and the Southern Ocean: A report to support the Horizon Scan activity of COMNAP and SCAR Thomas Wagner ([email protected]) Charles Webb NASA Cryospheric
Climate Change Plan For Orange County Government
 Climate Change Plan For Orange County Government Mayor Richard T. Crotty and the Board of County Commissioners September 25, 2007 FINAL Table of Contents 1.0 Introduction... 1 2.0 Background... 1 3.0 Global
Severe Weather A Reading A Z Level T Leveled Book Word Count: 1,775
 Severe Weather A Reading A Z Level T Leveled Book Word Count: 1,775 LEVELED BOOK T SEVERE WEATHER Written by Bruce D. Cooper Illustrated by Cende Hill Visit www.readinga-z.com for thousands of books and
THE CURIOUS CASE OF THE PLIOCENE CLIMATE. Chris Brierley, Alexey Fedorov and Zhonghui Lui
 THE CURIOUS CASE OF THE PLIOCENE CLIMATE Chris Brierley, Alexey Fedorov and Zhonghui Lui Outline Introduce the warm early Pliocene Recent Discoveries in the Tropics Reconstructing the early Pliocene SSTs
The Ice Age By: Sue Peterson
 www.k5learning.com Objective sight words (pulses, intermittent, isotopes, chronicle, methane, tectonic plates, volcanism, configurations, land-locked, erratic); concepts (geological evidence and specific
THIRD GRADE WEATHER 1 WEEK LESSON PLANS AND ACTIVITIES
 THIRD GRADE WEATHER 1 WEEK LESSON PLANS AND ACTIVITIES WATER CYCLE OVERVIEW OF THIRD GRADE WATER WEEK 1. PRE: Comparing the different components of the water cycle. LAB: Contrasting water with hydrogen
Climate Change in North Carolina
 Climate Change in North Carolina Dr. Chip Konrad Director of the The Southeast Regional Climate Center Associate Professor Department of Geography University of North Carolina at Chapel Hill The Southeast
Continents join together and split apart.
 KEY CONCEPT Continents change position over time. BEFORE, you learned Earth s main layers are the core, the mantle, and the crust The lithosphere and asthenosphere are the topmost layers of Earth The lithosphere
An Online School for Weather. www.srh.noaa.gov/jetstream/atmos/ll_whatacycle_aquifers.pdf
 JetStream An Online School for Weather Aquifers Aquifers Aquifers 1 3 5 Aquifers Aquifers Aquifers 2 4 6 /atmos/ll_whatacycle_aquifers.pdf There are over 35 lesson plans in the National Weather Service
Basics of weather interpretation
 Basics of weather interpretation Safety at Sea Seminar, April 2 nd 2016 Dr. Gina Henderson Oceanography Dept., USNA [email protected] Image source: http://earthobservatory.nasa.gov/naturalhazards/view.php?id=80399,
Climate Change Mini-Simulation: Background Guide
 Climate Change Mini-Simulation: Background Guide United Nations The United Nations (UN) is an international organization founded in 1945 after the Second World War by 51 countries committed to creating
Keeping below 2 degrees
 Keeping below 2 degrees Avoiding dangerous climate change It is widely recognised that if the worst impacts of climate change are to be avoided then the average rise in the surface temperature of the Earth
SECTION 3.2 CLIMATE AND PRECIPITATION
 SECTION 3.2 CLIMATE AND PRECIPITATION Ulster County Climate Data A preliminary analysis of the Preserve s weather data shows that the average temperature has risen about two degrees over the past 114 years.
Temporal variation in snow cover over sea ice in Antarctica using AMSR-E data product
 Temporal variation in snow cover over sea ice in Antarctica using AMSR-E data product Michael J. Lewis Ph.D. Student, Department of Earth and Environmental Science University of Texas at San Antonio ABSTRACT
Climate Futures for the Southeast Australian Coast
 Climate Futures for the Southeast Australian Coast Supporting information for the National Climate Change Adaptation Research Facility (NCCARF) Coastal Settlements projects: What would a climate-adapted
Atmospheric Processes
 Atmospheric Processes Steven Sherwood Climate Change Research Centre, UNSW Yann Arthus-Bertrand / Altitude Where do atmospheric processes come into AR5 WGI? 1. The main feedbacks that control equilibrium
The Science and Ethics of Global warming. Global warming has become one of the central political and scientific issues of
 The Science and Ethics of Global warming Global warming has become one of the central political and scientific issues of our time. It holds a fascination for scientists because of the tremendous complexity
Key Idea 2: Ecosystems
 Key Idea 2: Ecosystems Ecosystems An ecosystem is a living community of plants and animals sharing an environment with non-living elements such as climate and soil. An example of a small scale ecosystem
Storm tide is the water level rise during a storm due to the combination of storm surge and the astronomical tide.
 INTRODUCTION TO STORM SURGE Introduction to Storm Surge BOLIVAR PENINSULA IN TEXAS AFTER HURRICANE IKE (2008) What is Storm Surge? Inland Extent Storm surge can penetrate well inland from the coastline.
Radiative effects of clouds, ice sheet and sea ice in the Antarctic
 Snow and fee Covers: Interactions with the Atmosphere and Ecosystems (Proceedings of Yokohama Symposia J2 and J5, July 1993). IAHS Publ. no. 223, 1994. 29 Radiative effects of clouds, ice sheet and sea
Atmospheric Dynamics of Venus and Earth. Institute of Geophysics and Planetary Physics UCLA 2 Lawrence Livermore National Laboratory
 Atmospheric Dynamics of Venus and Earth G. Schubert 1 and C. Covey 2 1 Department of Earth and Space Sciences Institute of Geophysics and Planetary Physics UCLA 2 Lawrence Livermore National Laboratory
The Earth System. The geosphere is the solid Earth that includes the continental and oceanic crust as well as the various layers of Earth s interior.
 The Earth System The atmosphere is the gaseous envelope that surrounds Earth. It consists of a mixture of gases composed primarily of nitrogen, oxygen, carbon dioxide, and water vapor. The atmosphere and