Time Series Analysis AMS 316
|
|
|
- Moris McBride
- 10 years ago
- Views:
Transcription
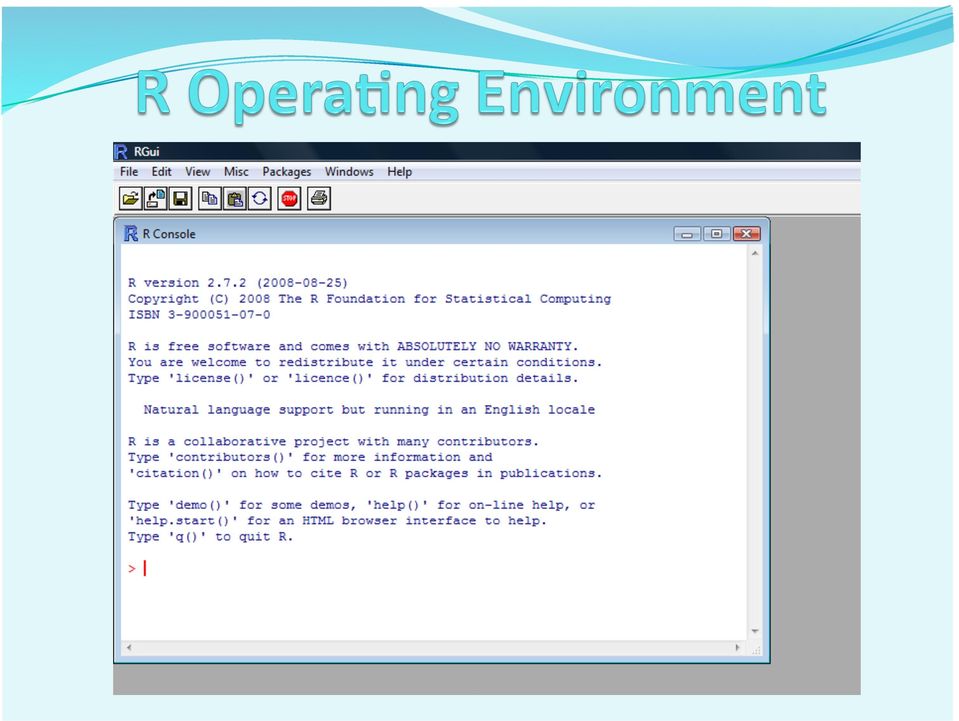
1 Time Series Analysis AMS 316

2 Programming language and software environment for data manipulation, calculation and graphical display. Originally created by Ross Ihaka and Robert Gentleman at University of Auckland, and now developed by the R Development Core Team.

3 IT IS FREE Pre-compiled binary versions are provided for Microsoft Windows, Mac OS X, and several other Linux/Unix-like operating systems Open source code available freely available on GNU General Public License For computationally-intensive tasks, C, C++ and Fortran code can be linked and called at run time An effective data handling and storage facility A suite of operators for calculations on arrays, in particular matrices A large, coherent, integrated collection of intermediate tools for data analysis Graphical facilities for data analysis and display either directly at the computer or on hardcopy

4
5

6 >help.start()
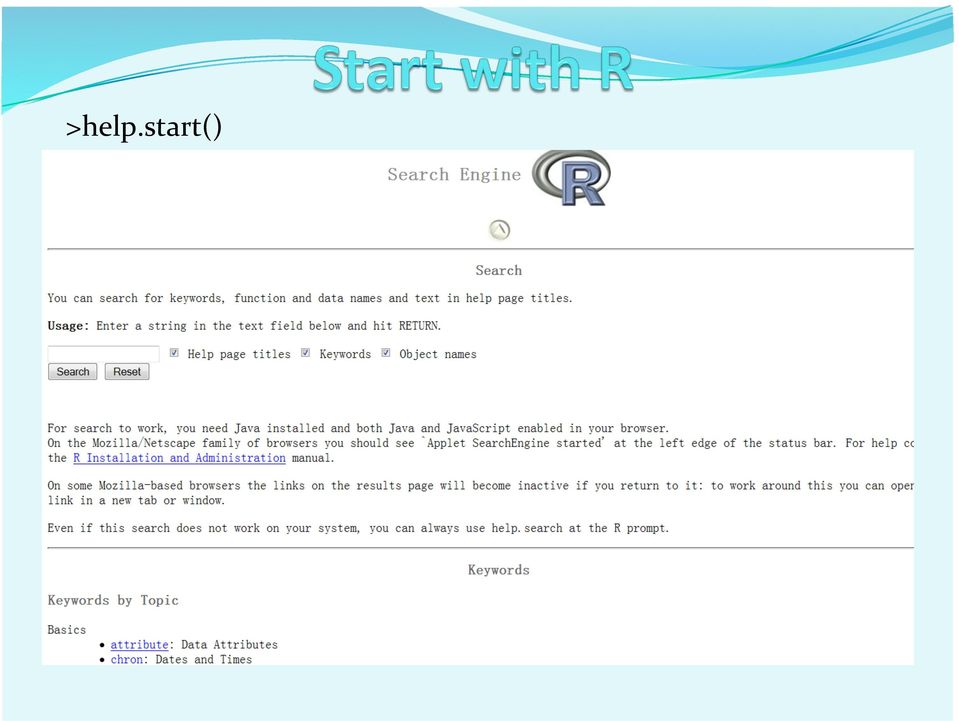
7 > help(solve) // get more information on solve >?solve > help( [[ ) // help for special characters and if, for > help.start() // launch a Web browser

8 1. R is case sensitive. 2. Commands can be executed by calling an external file. > source( commands.r ) 3. The following functions can be used to display the names of (most of) the objects which are currently stored within R. > objects() > ls() 4. Objects can be removed by the following function. > rm(x, y, z)
 the")
9 1. Vectors and asignments > x<- c(10.4, 5.6, 4.1) > assign( x, c(10.4, 5.6, 4.1) ) > y <- c(x, 0, 1/x) 2. Vector arithmetic > v<-2*x + y +1 > sum( (x-mean(x))^2/length(x)-1) > sort(x) // returns a vector of the same size as x // with the elements arranged in increasing order. > max(x) > min(x) 3. Sequence generation > z <- seq(-5, 5, by=0.2) > z <- rep(x, times=5)
 > min(x) 3. Sequence generation > z <- seq(-5, 5, by=0.2) > z <- rep(x, times=5)")
10

11 File types that can be imported into R:.data,.txt,.xls,.xlsx,.html,.xml, etc. Example of importing text files into R: data<-read.table( C:/ /data.txt, header=true, sep= \t ) Other data import commands: scan() For data import/export:
 Other data import commands: scan() For")
12

13

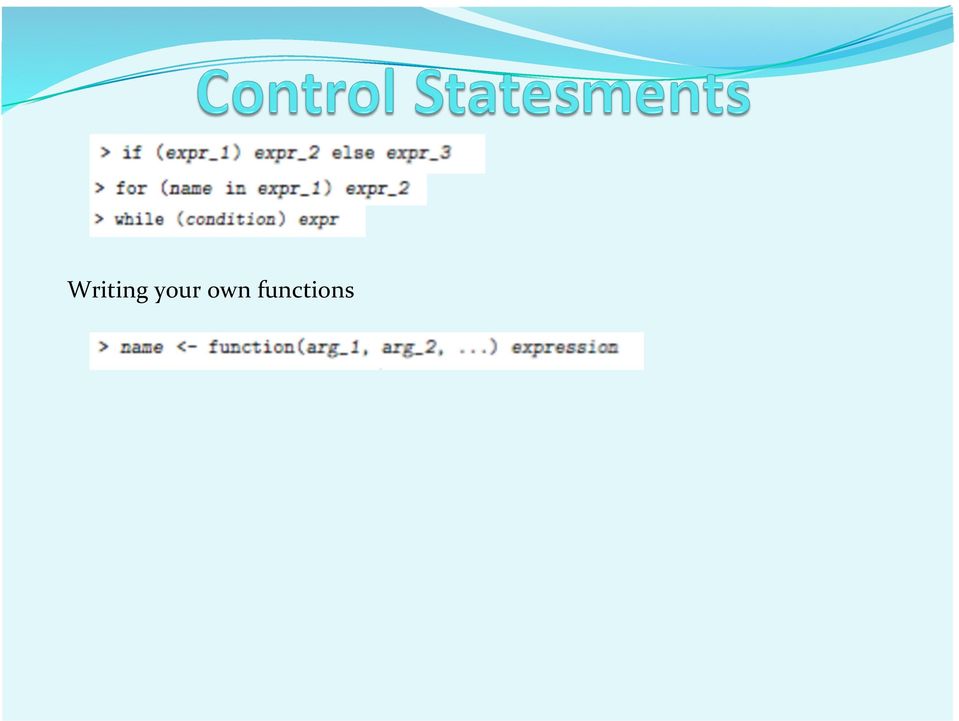
14 Writing your own functions
15

16

17 attach(dummy) //Make the columns in the data frame visible as variables// lrf <- lowess(x, y) //Make a nonparametric local regression function// plot(x, y) //Standard point plot// lines(x, lrf$y) //Add in the local regression// abline(0, 1, lty=3) //The true regression line: (intercept 0, slope 1)// abline(coef(fm)) //Unweighted regression line// abline(coef(fm1), col = "red") //Weighted regression line// detach() //Remove data frame from the search path// plot(fitted(fm), resid(fm), xlab="fitted values", ylab="residuals", main="residuals vs Fitted") /*A standard regression diagnostic plot to check for qqnorm(resid(fm), main="residuals Rankit Plot") /*A normal scores plot to check for skewness, kurtosis and rm(fm, fm1, lrf, x, dummy) //Clean up again//
, main=\"residuals Rankit Plot\") /*A normal scores plot to check for skewness, kurtosis and rm(fm, fm1, lrf, x, dummy) //Clean up")
18

19

20 Plot Types: Line Charts, Bar Charts, Histograms, Pie Charts, Dot Charts, etc. Format: >PLOT-TYPE(PLOT-DATA, DETAILS) PLOT-TYPE: plot, plot.xy, barplot, pie, dotchart, etc. PLOT-DATA: Data, Data$XXX, as.matrix(data), etc. Details: axes, col, pch, lty, ylim, type, xlab, ylab, etc. For graphics plot:

21 A comparison of GM monthly returns & SP500 monthly returns. GM and SP500 monthly return data during the period of Jan to Jun are taken. Plotted in R, they will be analyzed and compared. Data from: statfinbook/data.html
22 GM<-read.table("C:/R Data/GM.txt", header=true, sep= ") SP<-read.table("C:/R Data/SP.txt", header=true, sep="") plot(gm) lines(gm$logret, lty=1) lines(sp$logret, type="o", lty=1, pch="+", col="red") x<-1:66 GML<-lm(GM$logret~x) SPL<-lm(SP$logret~x) abline(coef(gml), type="h", lwd=3) abline(coef(spl), col="red", type="h", lwd=3)
23
24 Introduction to packages All R functions and datasets are stored in packages. Only when a package is loaded are its contents available. This is down both for efficiency, and to aid package developers. To see which packages are installed at your site, issue the command >library(boot) Users connected to the Internet can use install.packages() and update.packages() to install and update packages. To see packages currently loaded, use search().
25 An easier way: use TS functions to plot time series. US unemployment rate from 1987 to 2007 are taken as a time series for analysis. Data from
26 2004~ ~2007
27 An easier way: use TS functions to plot time series. US unemployment rate from 1987 to 2007 are taken as a time series for analysis. Data from
Viewing Ecological data using R graphics
 Biostatistics Illustrations in Viewing Ecological data using R graphics A.B. Dufour & N. Pettorelli April 9, 2009 Presentation of the principal graphics dealing with discrete or continuous variables. Course
Time Series Analysis with R - Part I. Walter Zucchini, Oleg Nenadić
 Time Series Analysis with R - Part I Walter Zucchini, Oleg Nenadić Contents 1 Getting started 2 1.1 Downloading and Installing R.................... 2 1.2 Data Preparation and Import in R.................
How To Use R On A Pc Or Mac Or Macbook Or Macintosh (Windows) With A Microsoft Macbook (Windows Or Mac) With An Ipa (Windows/Apple) With R (Windows 2) With The Powerup)
 With A Microsoft Macbook (Windows Or Mac) With An Ipa (Windows/Apple) With R (Windows 2) With The Powerup)") Appendix A: A sample session 76 Appendix A A sample session The following session is intended to introduce to you some features of the R environment by using them. Many features of the system will be unfamiliar
Appendix A: A sample session 76 Appendix A A sample session The following session is intended to introduce to you some features of the R environment by using them. Many features of the system will be unfamiliar
Tutorial 3: Graphics and Exploratory Data Analysis in R Jason Pienaar and Tom Miller
 Tutorial 3: Graphics and Exploratory Data Analysis in R Jason Pienaar and Tom Miller Getting to know the data An important first step before performing any kind of statistical analysis is to familiarize
Graphics in R. Biostatistics 615/815
 Graphics in R Biostatistics 615/815 Last Lecture Introduction to R Programming Controlling Loops Defining your own functions Today Introduction to Graphics in R Examples of commonly used graphics functions
Each function call carries out a single task associated with drawing the graph.
 Chapter 3 Graphics with R 3.1 Low-Level Graphics R has extensive facilities for producing graphs. There are both low- and high-level graphics facilities. The low-level graphics facilities provide basic
5 Correlation and Data Exploration
 5 Correlation and Data Exploration Correlation In Unit 3, we did some correlation analyses of data from studies related to the acquisition order and acquisition difficulty of English morphemes by both
R Language Fundamentals
 R Language Fundamentals Data Types and Basic Maniuplation Steven Buechler Department of Mathematics 276B Hurley Hall; 1-6233 Fall, 2007 Outline Where did R come from? Overview Atomic Vectors Subsetting
GETTING STARTED WITH R AND DATA ANALYSIS
 GETTING STARTED WITH R AND DATA ANALYSIS [Learn R for effective data analysis] LEARN PRACTICAL SKILLS REQUIRED FOR VISUALIZING, TRANSFORMING, AND ANALYZING DATA IN R One day course for people who are just
# load in the files containing the methyaltion data and the source # code containing the SSRPMM functions
 ################ EXAMPLE ANALYSES TO ILLUSTRATE SS-RPMM ######################## # load in the files containing the methyaltion data and the source # code containing the SSRPMM functions # Note, the SSRPMM
Lecture 2: Exploratory Data Analysis with R
 Lecture 2: Exploratory Data Analysis with R Last Time: 1. Introduction: Why use R? / Syllabus 2. R as calculator 3. Import/Export of datasets 4. Data structures 5. Getting help, adding packages 6. Homework
Introduction to R and UNIX Working with microarray data in a multi-user environment
 Microarray Data Analysis Workshop MedVetNet Workshop, DTU 2008 Introduction to R and UNIX Working with microarray data in a multi-user environment Carsten Friis Media glna tnra GlnA TnrA C2 glnr C3 C5
Introduction to R software for statistical computing
 to R software for statistical computing JoAnn Rudd Alvarez, MA [email protected] biostat.mc.vanderbilt.edu/joannalvarez Department of Biostatistics Division of Cancer Biostatistics Center for
Getting started with qplot
 Chapter 2 Getting started with qplot 2.1 Introduction In this chapter, you will learn to make a wide variety of plots with your first ggplot2 function, qplot(), short for quick plot. qplot makes it easy
Visualizing Data. Contents. 1 Visualizing Data. Anthony Tanbakuchi Department of Mathematics Pima Community College. Introductory Statistics Lectures
 Introductory Statistics Lectures Visualizing Data Descriptive Statistics I Department of Mathematics Pima Community College Redistribution of this material is prohibited without written permission of the
Package survpresmooth
 Package survpresmooth February 20, 2015 Type Package Title Presmoothed Estimation in Survival Analysis Version 1.1-8 Date 2013-08-30 Author Ignacio Lopez de Ullibarri and Maria Amalia Jacome Maintainer
Statistical Models in R
 Statistical Models in R Some Examples Steven Buechler Department of Mathematics 276B Hurley Hall; 1-6233 Fall, 2007 Outline Statistical Models Linear Models in R Regression Regression analysis is the appropriate
Importing Data into R
 1 R is an open source programming language focused on statistical computing. R supports many types of files as input and the following tutorial will cover some of the most popular. Importing from text
Lecture 5 : The Poisson Distribution
 Lecture 5 : The Poisson Distribution Jonathan Marchini November 10, 2008 1 Introduction Many experimental situations occur in which we observe the counts of events within a set unit of time, area, volume,
4 Other useful features on the course web page. 5 Accessing SAS
 1 Using SAS outside of ITCs Statistical Methods and Computing, 22S:30/105 Instructor: Cowles Lab 1 Jan 31, 2014 You can access SAS from off campus by using the ITC Virtual Desktop Go to https://virtualdesktopuiowaedu
sample median Sample quartiles sample deciles sample quantiles sample percentiles Exercise 1 five number summary # Create and view a sorted
 Sample uartiles We have seen that the sample median of a data set {x 1, x, x,, x n }, sorted in increasing order, is a value that divides it in such a way, that exactly half (i.e., 50%) of the sample observations
R Graphics II: Graphics for Exploratory Data Analysis
 UCLA Department of Statistics Statistical Consulting Center Irina Kukuyeva [email protected] April 26, 2010 Outline 1 Summary Plots 2 Time Series Plots 3 Geographical Plots 4 3D Plots 5 Simulation
business statistics using Excel OXFORD UNIVERSITY PRESS Glyn Davis & Branko Pecar
 business statistics using Excel Glyn Davis & Branko Pecar OXFORD UNIVERSITY PRESS Detailed contents Introduction to Microsoft Excel 2003 Overview Learning Objectives 1.1 Introduction to Microsoft Excel
Cluster Analysis using R
 Cluster analysis or clustering is the task of assigning a set of objects into groups (called clusters) so that the objects in the same cluster are more similar (in some sense or another) to each other
Lab 13: Logistic Regression
 Lab 13: Logistic Regression Spam Emails Today we will be working with a corpus of emails received by a single gmail account over the first three months of 2012. Just like any other email address this account
OVERVIEW OF R SOFTWARE AND PRACTICAL EXERCISE
 OVERVIEW OF R SOFTWARE AND PRACTICAL EXERCISE Hukum Chandra Indian Agricultural Statistics Research Institute, New Delhi-110012 1. INTRODUCTION R is a free software environment for statistical computing
Introduction to R and Exploratory data analysis
 Introduction to R and Exploratory data analysis Gavin Simpson November 2006 Summary In this practical class we will introduce you to working with R. You will complete an introductory session with R and
Data Visualization with R Language
 1 Data Visualization with R Language DENG, Xiaodong ([email protected] ) Research Assistant Saw Swee Hock School of Public Health, National University of Singapore Why Visualize Data? For better
R Graphics Cookbook. Chang O'REILLY. Winston. Tokyo. Beijing Cambridge. Farnham Koln Sebastopol
 R Graphics Cookbook Winston Chang Beijing Cambridge Farnham Koln Sebastopol O'REILLY Tokyo Table of Contents Preface ix 1. R Basics 1 1.1. Installing a Package 1 1.2. Loading a Package 2 1.3. Loading a
Data exploration with Microsoft Excel: univariate analysis
 Data exploration with Microsoft Excel: univariate analysis Contents 1 Introduction... 1 2 Exploring a variable s frequency distribution... 2 3 Calculating measures of central tendency... 16 4 Calculating
Diagrams and Graphs of Statistical Data
 Diagrams and Graphs of Statistical Data One of the most effective and interesting alternative way in which a statistical data may be presented is through diagrams and graphs. There are several ways in
Business Statistics. Successful completion of Introductory and/or Intermediate Algebra courses is recommended before taking Business Statistics.
 Business Course Text Bowerman, Bruce L., Richard T. O'Connell, J. B. Orris, and Dawn C. Porter. Essentials of Business, 2nd edition, McGraw-Hill/Irwin, 2008, ISBN: 978-0-07-331988-9. Required Computing
Computational Assignment 4: Discriminant Analysis
 Computational Assignment 4: Discriminant Analysis -Written by James Wilson -Edited by Andrew Nobel In this assignment, we will investigate running Fisher s Discriminant analysis in R. This is a powerful
SECTION 2-1: OVERVIEW SECTION 2-2: FREQUENCY DISTRIBUTIONS
 SECTION 2-1: OVERVIEW Chapter 2 Describing, Exploring and Comparing Data 19 In this chapter, we will use the capabilities of Excel to help us look more carefully at sets of data. We can do this by re-organizing
KSTAT MINI-MANUAL. Decision Sciences 434 Kellogg Graduate School of Management
 KSTAT MINI-MANUAL Decision Sciences 434 Kellogg Graduate School of Management Kstat is a set of macros added to Excel and it will enable you to do the statistics required for this course very easily. To
Microsoft Excel. Qi Wei
 Microsoft Excel Qi Wei Excel (Microsoft Office Excel) is a spreadsheet application written and distributed by Microsoft for Microsoft Windows and Mac OS X. It features calculation, graphing tools, pivot
Week 5: Multiple Linear Regression
 BUS41100 Applied Regression Analysis Week 5: Multiple Linear Regression Parameter estimation and inference, forecasting, diagnostics, dummy variables Robert B. Gramacy The University of Chicago Booth School
A short course in Longitudinal Data Analysis ESRC Research Methods and Short Course Material for Practicals with the joiner package.
 A short course in Longitudinal Data Analysis ESRC Research Methods and Short Course Material for Practicals with the joiner package. Lab 2 - June, 2008 1 jointdata objects To analyse longitudinal data
An introduction to using Microsoft Excel for quantitative data analysis
 Contents An introduction to using Microsoft Excel for quantitative data analysis 1 Introduction... 1 2 Why use Excel?... 2 3 Quantitative data analysis tools in Excel... 3 4 Entering your data... 6 5 Preparing
Getting started manual
 Getting started manual XLSTAT Getting started manual Addinsoft 1 Table of Contents Install XLSTAT and register a license key... 4 Install XLSTAT on Windows... 4 Verify that your Microsoft Excel is up-to-date...
Using R for Windows and Macintosh
 2010 Using R for Windows and Macintosh R is the most commonly used statistical package among researchers in Statistics. It is freely distributed open source software. For detailed information about downloading
Financial Econometrics MFE MATLAB Introduction. Kevin Sheppard University of Oxford
 Financial Econometrics MFE MATLAB Introduction Kevin Sheppard University of Oxford October 21, 2013 2007-2013 Kevin Sheppard 2 Contents Introduction i 1 Getting Started 1 2 Basic Input and Operators 5
Data analysis and regression in Stata
 Data analysis and regression in Stata This handout shows how the weekly beer sales series might be analyzed with Stata (the software package now used for teaching stats at Kellogg), for purposes of comparing
Module 3: Correlation and Covariance
 Using Statistical Data to Make Decisions Module 3: Correlation and Covariance Tom Ilvento Dr. Mugdim Pašiƒ University of Delaware Sarajevo Graduate School of Business O ften our interest in data analysis
An Introduction to R. W. N. Venables, D. M. Smith and the R Core Team
 An Introduction to R Notes on R: A Programming Environment for Data Analysis and Graphics Version 3.2.2 (2015-08-14) W. N. Venables, D. M. Smith and the R Core Team This manual is for R, version 3.2.2
Lecture 2: Descriptive Statistics and Exploratory Data Analysis
 Lecture 2: Descriptive Statistics and Exploratory Data Analysis Further Thoughts on Experimental Design 16 Individuals (8 each from two populations) with replicates Pop 1 Pop 2 Randomly sample 4 individuals
Psychology 205: Research Methods in Psychology
 Psychology 205: Research Methods in Psychology Using R to analyze the data for study 2 Department of Psychology Northwestern University Evanston, Illinois USA November, 2012 1 / 38 Outline 1 Getting ready
A Handbook of Statistical Analyses Using R. Brian S. Everitt and Torsten Hothorn
 A Handbook of Statistical Analyses Using R Brian S. Everitt and Torsten Hothorn CHAPTER 6 Logistic Regression and Generalised Linear Models: Blood Screening, Women s Role in Society, and Colonic Polyps
Bowerman, O'Connell, Aitken Schermer, & Adcock, Business Statistics in Practice, Canadian edition
 Bowerman, O'Connell, Aitken Schermer, & Adcock, Business Statistics in Practice, Canadian edition Online Learning Centre Technology Step-by-Step - Excel Microsoft Excel is a spreadsheet software application
Course Text. Required Computing Software. Course Description. Course Objectives. StraighterLine. Business Statistics
 Course Text Business Statistics Lind, Douglas A., Marchal, William A. and Samuel A. Wathen. Basic Statistics for Business and Economics, 7th edition, McGraw-Hill/Irwin, 2010, ISBN: 9780077384470 [This
Directions for using SPSS
 Directions for using SPSS Table of Contents Connecting and Working with Files 1. Accessing SPSS... 2 2. Transferring Files to N:\drive or your computer... 3 3. Importing Data from Another File Format...
Financial Risk Models in R: Factor Models for Asset Returns. Workshop Overview
 Financial Risk Models in R: Factor Models for Asset Returns and Interest Rate Models Scottish Financial Risk Academy, March 15, 2011 Eric Zivot Robert Richards Chaired Professor of Economics Adjunct Professor,
SPSS 12 Data Analysis Basics Linda E. Lucek, Ed.D. [email protected] 815-753-9516
 SPSS 12 Data Analysis Basics Linda E. Lucek, Ed.D. [email protected] 815-753-9516 Technical Advisory Group Customer Support Services Northern Illinois University 120 Swen Parson Hall DeKalb, IL 60115 SPSS
Chapter 1. Return Calculations. 1.1 The Time Value of Money. 1.1.1 Future value, present value and simple interest.
 Chapter 1 Return Calculations Updated: June 24, 2014 In this Chapter we cover asset return calculations with an emphasis on equity returns. Section 1.1 covers basic time value of money calculations. Section
Exercise 1.12 (Pg. 22-23)
") Individuals: The objects that are described by a set of data. They may be people, animals, things, etc. (Also referred to as Cases or Records) Variables: The characteristics recorded about each individual.
Individuals: The objects that are described by a set of data. They may be people, animals, things, etc. (Also referred to as Cases or Records) Variables: The characteristics recorded about each individual.
Step 3: Go to Column C. Use the function AVERAGE to calculate the mean values of n = 5. Column C is the column of the means.
 EXAMPLES - SAMPLING DISTRIBUTION EXCEL INSTRUCTIONS This exercise illustrates the process of the sampling distribution as stated in the Central Limit Theorem. Enter the actual data in Column A in MICROSOFT
Package smoothhr. November 9, 2015
 Encoding UTF-8 Type Package Depends R (>= 2.12.0),survival,splines Package smoothhr November 9, 2015 Title Smooth Hazard Ratio Curves Taking a Reference Value Version 1.0.2 Date 2015-10-29 Author Artur
Engineering Problem Solving and Excel. EGN 1006 Introduction to Engineering
 Engineering Problem Solving and Excel EGN 1006 Introduction to Engineering Mathematical Solution Procedures Commonly Used in Engineering Analysis Data Analysis Techniques (Statistics) Curve Fitting techniques
Module 2 Basic Data Management, Graphs, and Log-Files
 AGRODEP Stata Training April 2013 Module 2 Basic Data Management, Graphs, and Log-Files Manuel Barron 1 and Pia Basurto 2 1 University of California, Berkeley, Department of Agricultural and Resource Economics
Package polynom. R topics documented: June 24, 2015. Version 1.3-8
 Version 1.3-8 Package polynom June 24, 2015 Title A Collection of Functions to Implement a Class for Univariate Polynomial Manipulations A collection of functions to implement a class for univariate polynomial
Data analysis process
 Data analysis process Data collection and preparation Collect data Prepare codebook Set up structure of data Enter data Screen data for errors Exploration of data Descriptive Statistics Graphs Analysis
Based on Chapter 11, Excel 2007 Dashboards & Reports (Alexander) and Create Dynamic Charts in Microsoft Office Excel 2007 and Beyond (Scheck)
 and Create Dynamic Charts in Microsoft Office Excel 2007 and Beyond (Scheck)") Reporting Results: Part 2 Based on Chapter 11, Excel 2007 Dashboards & Reports (Alexander) and Create Dynamic Charts in Microsoft Office Excel 2007 and Beyond (Scheck) Bullet Graph (pp. 200 205, Alexander,
Reporting Results: Part 2 Based on Chapter 11, Excel 2007 Dashboards & Reports (Alexander) and Create Dynamic Charts in Microsoft Office Excel 2007 and Beyond (Scheck) Bullet Graph (pp. 200 205, Alexander,
Forecasting in STATA: Tools and Tricks
 Forecasting in STATA: Tools and Tricks Introduction This manual is intended to be a reference guide for time series forecasting in STATA. It will be updated periodically during the semester, and will be
An Introduction to R. W. N. Venables, D. M. Smith and the R Core Team
 An Introduction to R Notes on R: A Programming Environment for Data Analysis and Graphics Version 3.1.1 (2014-07-10) W. N. Venables, D. M. Smith and the R Core Team This manual is for R, version 3.1.1
Introduction to Microsoft Excel 2007/2010
 to Microsoft Excel 2007/2010 Abstract: Microsoft Excel is one of the most powerful and widely used spreadsheet applications available today. Excel's functionality and popularity have made it an essential
A Handbook of Statistical Analyses Using R. Brian S. Everitt and Torsten Hothorn
 A Handbook of Statistical Analyses Using R Brian S. Everitt and Torsten Hothorn CHAPTER 1 An Introduction to R 1.1 What is R? The R system for statistical computing is an environment for data analysis
A Short Guide to R with RStudio
 Short Guides to Microeconometrics Fall 2013 Prof. Dr. Kurt Schmidheiny Universität Basel A Short Guide to R with RStudio 1 Introduction 2 2 Installing R and RStudio 2 3 The RStudio Environment 2 4 Additions
Regression and Programming in R. Anja Bråthen Kristoffersen Biomedical Research Group
 Regression and Programming in R Anja Bråthen Kristoffersen Biomedical Research Group R Reference Card http://cran.r-project.org/doc/contrib/short-refcard.pdf Simple linear regression Describes the relationship
How long is the vector? >> length(x) >> d=size(x) % What are the entries in the matrix d?
 >> d=size(x) % What are the entries in the matrix d?") MATLAB : A TUTORIAL 1. Creating vectors..................................... 2 2. Evaluating functions y = f(x), manipulating vectors. 4 3. Plotting............................................ 5 4. Miscellaneous
MATLAB : A TUTORIAL 1. Creating vectors..................................... 2 2. Evaluating functions y = f(x), manipulating vectors. 4 3. Plotting............................................ 5 4. Miscellaneous
Statistical Analysis with R
 Statistical Analysis with R - a quick start - OLEG NENADIĆ, WALTER ZUCCHINI September 2004 Contents 1 An Introduction to R 3 1.1 Downloading and Installing R..................... 3 1.2 Getting Started..............................
2015 Workshops for Professors
 SAS Education Grow with us Offered by the SAS Global Academic Program Supporting teaching, learning and research in higher education 2015 Workshops for Professors 1 Workshops for Professors As the market
Prof. Nicolai Meinshausen Regression FS 2014. R Exercises
 Prof. Nicolai Meinshausen Regression FS 2014 R Exercises 1. The goal of this exercise is to get acquainted with different abilities of the R statistical software. It is recommended to use the distributed
STATISTICAL ANALYSIS WITH EXCEL COURSE OUTLINE
 STATISTICAL ANALYSIS WITH EXCEL COURSE OUTLINE Perhaps Microsoft has taken pains to hide some of the most powerful tools in Excel. These add-ins tools work on top of Excel, extending its power and abilities
Exploratory Data Analysis
 Goals of EDA Relationship between mean response and covariates (including time). Variance, correlation structure, individual-level heterogeneity. Guidelines for graphical displays of longitudinal data
Data Mining with R: learning by case studies
 Data Mining with R: learning by case studies Luis Torgo LIACC-FEP, University of Porto R. Campo Alegre, 823-4150 Porto, Portugal email: [email protected] http://www.liacc.up.pt/ ltorgo May 22, 2003 Preface
Bill Burton Albert Einstein College of Medicine [email protected] April 28, 2014 EERS: Managing the Tension Between Rigor and Resources 1
 Bill Burton Albert Einstein College of Medicine [email protected] April 28, 2014 EERS: Managing the Tension Between Rigor and Resources 1 Calculate counts, means, and standard deviations Produce
FORECASTING. Operations Management
 2013 FORECASTING Brad Fink CIT 492 Operations Management Executive Summary Woodlawn hospital needs to forecast type A blood so there is no shortage for the week of 12 October, to correctly forecast, a
Why Taking This Course? Course Introduction, Descriptive Statistics and Data Visualization. Learning Goals. GENOME 560, Spring 2012
 Why Taking This Course? Course Introduction, Descriptive Statistics and Data Visualization GENOME 560, Spring 2012 Data are interesting because they help us understand the world Genomics: Massive Amounts
WESTMORELAND COUNTY PUBLIC SCHOOLS 2011 2012 Integrated Instructional Pacing Guide and Checklist Computer Math
 Textbook Correlation WESTMORELAND COUNTY PUBLIC SCHOOLS 2011 2012 Integrated Instructional Pacing Guide and Checklist Computer Math Following Directions Unit FIRST QUARTER AND SECOND QUARTER Logic Unit
INSTRUCTOR HELP & WALKTHROUGH
 INSTRUCTOR HELP & WALKTHROUGH 2015 Jones & Bartlett Learning, LLC, An Ascend Learning Company Contents What are the system requirements for Navigate 2 TestPrep? 3 How do I review my students performance?
Big Data and Scripting. Plotting in R
 1, Big Data and Scripting Plotting in R 2, the art of plotting: first steps fundament of plotting in R: plot(x,y) plot some random values: plot(runif(10)) values are interpreted as y-values, x-values filled
Table of Useful R commands
 Table of Useful R commands Command Purpose help() Obtain documentation for a given R command example() c(), scan() seq() rep() data() View() str() read.csv(), read.table() library(), require() dim() length()
The R Environment. A high-level overview. Deepayan Sarkar. 22 July 2013. Indian Statistical Institute, Delhi
 The R Environment A high-level overview Deepayan Sarkar Indian Statistical Institute, Delhi 22 July 2013 The R language ˆ Tutorials in the Astrostatistics workshop will use R ˆ...in the form of silent
What is R? R s Advantages R s Disadvantages Installing and Maintaining R Ways of Running R An Example Program Where to Learn More
 Bob Muenchen, Author R for SAS and SPSS Users, Co-Author R for Stata Users [email protected], http://r4stats.com What is R? R s Advantages R s Disadvantages Installing and Maintaining R Ways of Running
An Introduction to the Use of R for Clinical Research
 An Introduction to the Use of R for Clinical Research Dimitris Rizopoulos Department of Biostatistics, Erasmus Medical Center [email protected] PSDM Event: Open Source Software in Clinical Research
"Excel with Excel 2013: Pivoting with Pivot Tables" by Venu Gopalakrishna Remani. October 28, 2014
 Teaching Excellence and Innovation 1 Pivot table Pivot table does calculations with criteria Data should be arranged as : Field names in the first rows, records in rows No blank rows or blank columns should
An introduction to the analysis of extreme values using R and extremes
 An introduction to the analysis of extreme values using R and extremes Eric Gilleland, National Center for Atmospheric Research, Boulder, Colorado, U.S.A. http://www.ral.ucar.edu/staff/ericg Graybill VIII
Kaspersky Security Center Web-Console
 Kaspersky Security Center Web-Console User Guide CONTENTS ABOUT THIS GUIDE... 5 In this document... 5 Document conventions... 7 KASPERSKY SECURITY CENTER WEB-CONSOLE... 8 SOFTWARE REQUIREMENTS... 10 APPLICATION
Descriptive statistics parameters: Measures of centrality
 Descriptive statistics parameters: Measures of centrality Contents Definitions... 3 Classification of descriptive statistics parameters... 4 More about central tendency estimators... 5 Relationship between
Quickstart for Desktop Version
 Quickstart for Desktop Version What is GeoGebra? Dynamic Mathematics Software in one easy-to-use package For learning and teaching at all levels of education Joins interactive 2D and 3D geometry, algebra,
9th Russian Summer School in Information Retrieval Big Data Analytics with R
 9th Russian Summer School in Information Retrieval Big Data Analytics with R Introduction to Time Series with R A. Karakitsiou A. Migdalas Industrial Logistics, ETS Institute Luleå University of Technology