Statistical Tune-Up of the Peer Review Engine to Reduce Escapes
|
|
|
- Blake Watts
- 10 years ago
- Views:
Transcription
1 Statistical Tune-Up of the Peer Review Engine to Reduce Escapes Tom Lienhard, Raytheon Missile Systems Abstract. Peer reviews are a cornerstone to the product development process. They are performed to discover defects early in the lifecycle when they are less costly to fix. The theory is to detect the defects as close to the injection point as possible reducing the cost and schedule impact. Like most, if not all companies, peer reviews were performed and data collected allowing characterization of those reviews. Data collected across the organization showed that more than 0% of the engineering effort was consumed by reworking products already deemed fit for purpose. That meant for every three engineers a fourth was hired just to rework the defects. This was unacceptable! The major contributor to this rework was defects that escaped or leaked from one development phase to a later phase. In other words, the peer reviews were not detecting defects in the phase during which they were injected. Defect leakage is calculated as a percentage, by summing the defects attributable to a development phase that are detected in later phases divided by the total number of defects attributable to that phase. Defect leakage leads to cost and budget over-runs due to excessive Figure rework. For some development phases, defect leakage was as high as 75%. By investigating the types of defects that go undetected during the various development phases, corrections can be introduced into the processes to help minimize defect leakage and improve cost and schedule performance. An organizational goal was then set at no more than 0% defect leakage. To perform this investigation and propose improvements, a suite of Six Sigma tools were used to statistically tune-up the peer review process. These tools included Thought Process map, Process Map, Failure Mode and Effect Analysis, Product Scorecard, Statistical Characterization of Data, and a Design of Experiments. Having been an engineer and process professional for more than 0 years, I knew (or thought I knew) what influenced the peer review process and what needed to be changed in the process. But when we began the process, I kept an open mind and used Six Sigma tools to characterize and optimize the peer review process. The Thought Process Map was needed to scope the project, keep the project on track, identify barriers, and document results. It was useful to organize progress and eliminate scope-creep. Design new process Out Of Scope My GreenBelt Other BlackBelts Minimize Defects from entering into the SW development process Figure Reduce SW Defect Leakage How? What is a defect? What is leakage? (Use definitions from Scorecard) Redesign existing process Improve the inphase defect detection process Is there one? SW405760, Rev C How well is it working now? What is the process? What is the current leakage? How Determine? How do we measure the process? Gather data Involve multiple projects Multiple disciplines What are the possible weaknesses? Look for different requirements Different customers Multiple perspective How FMEA/CE tell? Postmortems The Process Map was used to walk the process as it is implemented not as it was defined in the command media. Inputs, outputs, and resources were identified. Resources were categorized as critical, noise, standard operating procedure and controllable. The Process Map was extremely useful because it quickly highlighted duplicate activities, where implementation deviated from the documented process, and was used as an input to the Failure Mode and Effect Analysis (FMEA) and Design of Experiments (DOE). The FMEA leveraged the process steps from the Process Map to identify potential failure modes with each process step, the effect of the failure, the cause of the failure, and any current detection mechanism. A numerical value was placed on each of these attributes and a cumulative Risk Priority Number (RPN) was assigned to each potential failure. The highest RPNs were the potential failures that needed to be mitigated or eliminated first and would eventually become the factors for the DOE. The Product Scorecard contained all of the quantifiable data relating to the peer reviews. It showed the number of defects introduced and detected by phase, both in raw numbers, percentage, and by effort. Using Pareto Charts, it was easy to determine where defects entered the process, where defects were found by the process, and even which phases had the most impact (rework) to the bottom line. Surprisingly, 58% of the total detects were found in test, well after the product is deemed done. Additionally, three phases accounted for greater than 9% of rework due to defects. What are x's, y's? What data? Lack of data? What about older projects? No, data not available Use Industry Numbers What data? unless using SSDP Rev C for effort by phase What want to know? (Bob Rova - Motorola, Estimate rework Effort associated for Data for Data from What is data TI, Hughes) by phase each cell of worksheet Organize data to FMEA Program Tracking showing us? effectively analyze (Industry Costs.xls) Use modified S/W Workshhet System Defect #s, Types, Lack of data? Want more than just overall Phase intro/detected Refine estimate as site data percentage leaked Defined in SSDP Rev C % Leakage by Phase/Total becomes available (Scorecard.xls) Severity, Occurrence, Detection # by Phase/Tota Highest RPN effort by Phase/Tota What's important to "customer" $ by Phase/Tota What have we learned? Where introduced Roles& Respons upfront Where found Identify and (Org/RJ/NGC Scorecard.xls) Standard checklists Remove Special Validate Measurement Not Update process to Better data collection system MSE(KAPPA/ICC Causes Is the data any System Adequate ensure data has Concentrate upfront or Nested Design) Improve the definition/ good? higher confidence Resonable product size ICC.88 classification of defects rate/ train Right moderator Train reviewers No Appropriate team C Chart for process How good classification? Adequate checklists C Chart for phases Stable process How good categorize? Adequate Process knowledge Common checklists (FMEA.xls) SQA Process Evals. Characterize Training Updated training Determine action Did change cause Set up control Yes Optimize Experience Req't people Drill down into the DOE Based on data Make and improvement? plan and Use Process No Criteria Roles/respons. Control Charts to data/nem/control communicate Charts Time? Monitor Remove Common cause What are improvements Newsletters Training? Projects not Effectiveness of important factors? People's time Liaison Meetings Eval criteria? required to follow? Improvements X Bar R Chart shows prediction range by phase Process? Shows variation within/between phases Attendees? Pareto charts show defect types, where intro, found Updated training, Common checklists, # of people, Moderator (X Bar Range and Pareto.xls) Choice of factors Green - Update Red - Question or expected result Blue - Answer or actual result Underlined - Barrier Process Map current process People's time People's time CrossTalk January/February 0

2 Phase Introduced Planning Rqmts. Planning Rqmts. Analysis Phase Detected Design Implement a8on Formal Before TOTAL Leaked Analysis Design Implement a8on Formal Before TOTAL Figure An improvement goal was set by the organization. The immediate goal was set around finding the defects earlier in the lifecycle rather than trying to reduce the number of defects. If the process could be improved to find the defects just one phase earlier in the lifecycle, the result would be many hundreds of thousands of dollars to the bottom line! Going into this project, my belief was that a program could be identified that was conducting peer reviews effectively across the entire lifecycle and that program s process could be replicated across the organization. The Control Chart showed something quite different. All the programs were conducting peer reviews consistently, but the variation between lifecycle phases ranged widely. When the data was rationally subgrouped by phase, the data became stable (predictable) within the subgroups, but there was extensive variation between the subgroups. This meant the variation came from the lifecycle phases not the programs. It would not be as simple as finding the program that conducted effective peer reviews and replicating its process across the organization SL=0.598 $400, $50,000 $00,000 Baseline defect cost profile IMPACT ON BOTTOM LINE P=0.00 Cumulative Costs $50,000 $00,000 $50,000 $00,000 Goal defect cost profile Existing Detection Improved Detection SL= $50,000 $0 Figure 4 Phase Detected Same number of total defects introduced in the same phases The data from the Product Scorecard was plotted to create a distributional characteristic of the process capability. Visually, this highlighted the lifecycle phases that were well below our goal of finding 80% of defects in phase, as seen in the figure below SL=.000 P= SL=0.949 Percent Defects Found In Phase Planning Cust. Plan Req ts Design Implem. These phases account for > 9% of rework Formal Goal SL=.000 P= SL=0.00E+00 Figure 5 Figure 6 4 CrossTalk January/February 0

3 The Analysis of Variation confirmed that 7% of the process variation was between the subgroups (lifecycle phases) and only 8% was within the subgroup (programs). Since the data was only a sample of the population, Confidence Intervals were conducted to find out the true range of the population. This quickly showed that for the Requirements Phase, the best the process was capable of achieving was detecting 7% of defects in phase. In fact, if no action was taken it was 95% certain that the Requirements Phase will find between % - 7% of defects in phase, the Design Phase will find between 4% - 88% of defects in phase, the Implementation Phase will find 59% - 78% of defects in phase. This helped focus where to concentrate the improvement resources. Graphical analysis included a normal probability plot and a Pareto chart of the main effects, two-way and three-way effects. This clearly showed that training, criteria, and experience were the influential factors. Figure 7 Remember the high RPNs from the FMEA? These were used as the factors in a DOE. There were four factors (experience, training, review criteria, and number of reviewers). The response variable for the DOE was the percentage of defects found in a peer review. There were 6 runs, which made it a half-factorial DOE. There were some limitations with this DOE. The products reviewed were different for each run; there were restrictions on randomization; and by the latter runs it was hard to find a peer review team that fulfilled the factor levels. For example, once somebody was trained they could not be untrained. When analyzing data, always think golf (PGA = practical, graphical, and analytical). Practical analysis looked at the result of each for anything of interest. It was not until then the runs were sorted by response did any trends appear. The highest five runs all had no criteria, the lowest four consisted of inexperienced team members and six of the top seven were trained teams. Figure 9 Analytical analysis not only showed the same influential factors but also quantified the effect and indicated whether to set the factor high or low. Training was the most influential, followed closely by experience. The process was relatively robust with respect to the language and number of people. If peer reviews are just as effective with half the people, this alone could have a big savings to the bottom line. The eye-opener here was that the peer review process was more effective without criteria. This went against intuition, but was based on data. Figure 8 Figure 0 CrossTalk January/February 0 5

4 Figure Figure 6 CrossTalk January/February 0
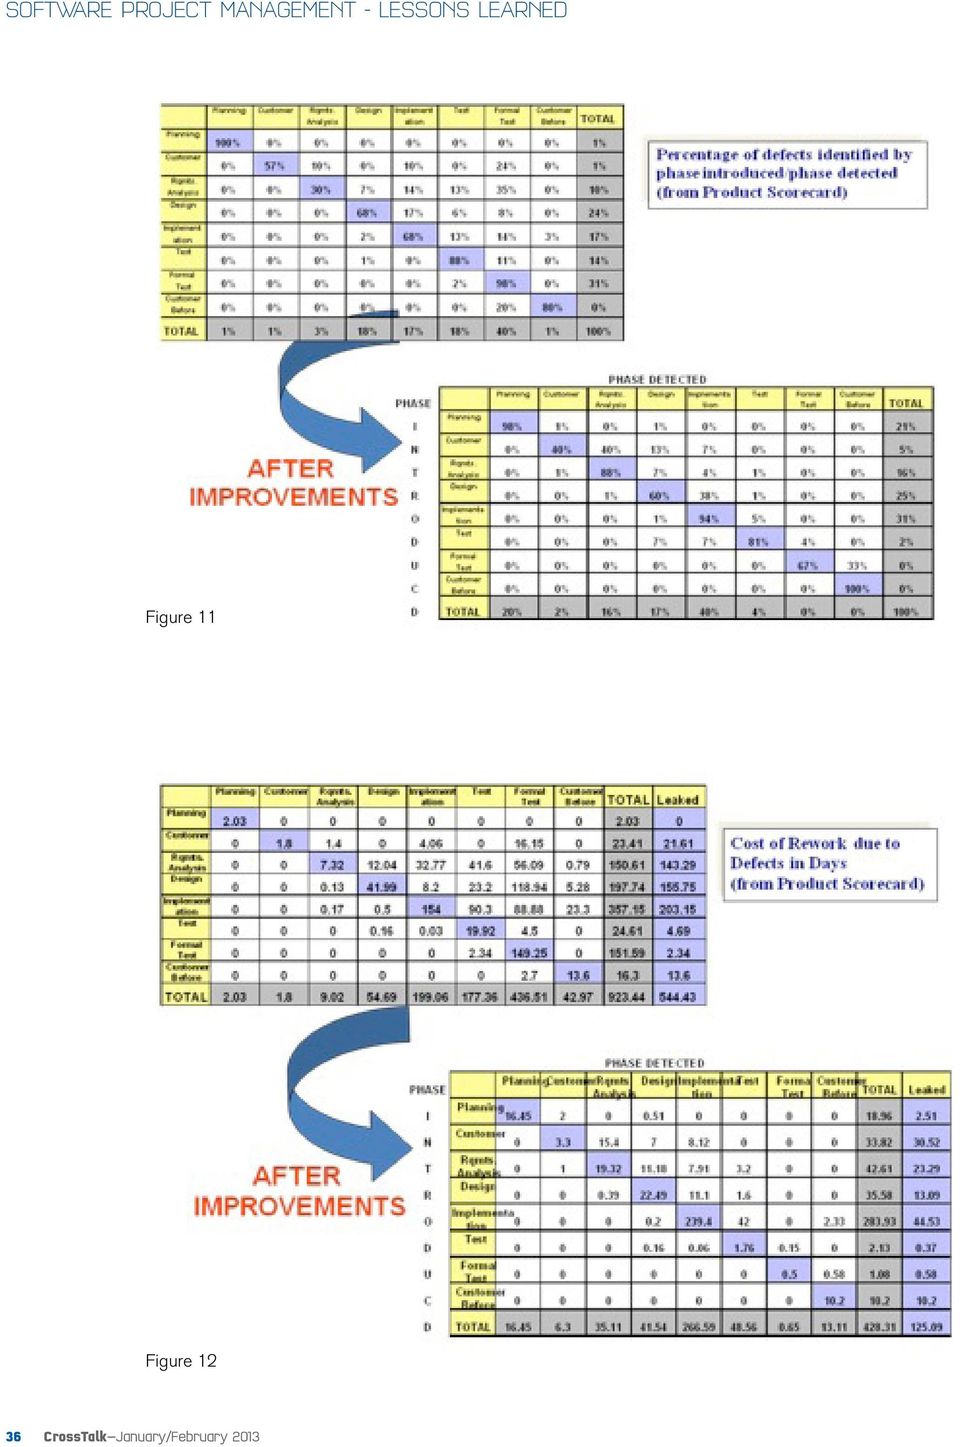
5 Further investigation revealed that the use of criteria was restricting what the reviewers were looking for in the peer reviews. Training was developed to educate the reviewers on how to use the criteria. The criteria became a living document and as defects were found the checklist were updated. The results showed remarkable improvements. The number of defects introduced before and after improvements were in the same order of magnitude (947 vs. 66) so that comparisons could be made between the before and after states. If you only look at the percentage of defects found in phase, as a lot of organizations do, the results can be misleading. It shows that five of eight phases actually found fewer defects in phase. Analyzing the data this way assumes all defects are created equal (it takes the same amount of effort to fix the defect) and does not take into effect the number of phases the defect leaked. If the defects are transformed into the amount of rework, a completely different profile is observed. In those five phases that found a smaller percent of defects in phase the amount of rework decreased by 75%. Looking at the three phases that accounted for 9% of the rework, the improvements are dramatic. It can be confidently stated that two of the three phases will exceed the goal of finding 80% of defects in phase. The third phase only allowed % of the defects to make it to test, whereas before the improvements, 4% made it to test. This reduced the rework from 56 days to a mere. Remember, measure what are you trying to improve is it number of defects or rework? The bottom line savings exceeded the goal by more than 0%. There was a nominal increase in cost in the early stage but, as can be seen by the graph, the cost of rework leveled off after the implementation phase. This means almost no defects leaked into the testing phase or beyond. Imagine your organization having no defects leak beyond the implementation phase. It can be done! ABOUT THE AUTHOR Tom Lienhard is a Sr. Principal Engineer at Raytheon Missile System s Tucson facility and a Six Sigma BlackBelt. Tom has participated in more than 50 CMM and CMMI appraisals both in DoD and Commercial environments across North America and Europe and was a member of Raytheon s CMMI Expert Team. He has taught Six Sigma across the globe, and helped various organizations climb the CMM and CMMI maturity levels, including Raytheon Missile System s achievement of CMMI Level 5. He has received the AlliedSignal Quest for Excellence Award, the Raytheon Technology Award and the Raytheon Excellence in Operations and Quality Award. Tom has a BS in computer science and has worked for Hughes, Raytheon, AlliedSignal, Honeywell and as a consultant for Managed Process Gains. Disclaimer: CMMI and CMM are registered in the U.S. Patent and Trademark Office by Carnegie Mellon University. Figure CrossTalk January/February 0 7
 so that comparisons could be made between the before and after states. If you only look at the percentage of defects found in phase, as a lot of organizations do, the results can be misleading.")
Quantitative Project Management Framework via Integrating
 Quantitative Project Management Framework via Integrating Six Sigma and PSP/TSP Sejun Kim, BISTel Okjoo Choi, Jongmoon Baik, Abstract: Process technologies such as Personal Software Process SM (PSP) and
QUANTIFIED THE IMPACT OF AGILE. Double your productivity. Improve Quality by 250% Balance your team performance. Cut Time to Market in half
 THE IMPACT OF AGILE QUANTIFIED SWAPPING INTUITION FOR INSIGHT KEY FIndings TO IMPROVE YOUR SOFTWARE DELIVERY Extracted by looking at real, non-attributable data from 9,629 teams using the Rally platform
Measurement and Metrics Fundamentals. SE 350 Software Process & Product Quality
 Measurement and Metrics Fundamentals Lecture Objectives Provide some basic concepts of metrics Quality attribute metrics and measurements Reliability, validity, error Correlation and causation Discuss
Why Would You Want to Use a Capability Maturity Model?
 Why Would You Want to Use a Capability Maturity Model? S E C A T Capability Maturity Model and CMM are Service Marks of Carnegie Mellon University HK- 6 Capability Maturity Models Are Based on 1 Primary
Simulation and Lean Six Sigma
 Hilary Emmett, 22 August 2007 Improve the quality of your critical business decisions Agenda Simulation and Lean Six Sigma What is Monte Carlo Simulation? Loan Process Example Inventory Optimization Example
Capability Maturity Model Integration (CMMI ) Overview
 Overview") Pittsburgh, PA 15213-3890 Capability Maturity Model Integration ( ) Overview SM CMM Integration, SCAMPI, SCAMPI Lead Appraiser, and SEI are service marks of Carnegie Mellon University., Capability Maturity
Pittsburgh, PA 15213-3890 Capability Maturity Model Integration ( ) Overview SM CMM Integration, SCAMPI, SCAMPI Lead Appraiser, and SEI are service marks of Carnegie Mellon University., Capability Maturity
Integrating CMMI, TSP and Change Management Principles to Accelerate Process Improvement
 R Integrating CMMI, TSP and Change Management Principles to Accelerate Process Improvement SM Julie Switzer, P-3 Process Improvement Lead, NAVAIR Orville Starnes, TSP Launch Coach, NAVAIR R CMM, CMMI and
Fundamentals of Measurements
 Objective Software Project Measurements Slide 1 Fundamentals of Measurements Educational Objective: To review the fundamentals of software measurement, to illustrate that measurement plays a central role
The Power of Two: Combining Lean Six Sigma and BPM
 : Combining Lean Six Sigma and BPM Lance Gibbs and Tom Shea Lean Six Sigma (LSS) and Business Process Management (BPM) have much to contribute to each other. Unfortunately, most companies have not integrated
Advancing Defect Containment to Quantitative Defect Management
 Advancing Defect Containment to Quantitative Defect Management Alison A. Frost and Michael J. Campo The defect containment measure is traditionally used to provide insight into project success (or lack
Use of Metrics in High Maturity Organizations
 Use of Metrics in High Maturity Organizations Pankaj Jalote Department of Computer Science and Engineering Indian Institute of Technology Kanpur Kanpur, India 208016 [email protected] Summary A high maturity
Software Engineering CSCI 4490. Class 50 Software Process Improvement. December 1, 2014
 Class 50 Software Process Improvement December 1, 2014 ~Improving the Process of Software Development Our Focus: The role of the Capability Maturity Model Integration (CMMI) in improving the software development
Using the Agile Methodology to Mitigate the Risks of Highly Adaptive Projects
 Transdyne Corporation CMMI Implementations in Small & Medium Organizations Using the Agile Methodology to Mitigate the Risks of Highly Adaptive Projects Dana Roberson Quality Software Engineer NNSA Service
Body of Knowledge for Six Sigma Green Belt
 Body of Knowledge for Six Sigma Green Belt What to Prepare For: The following is the Six Sigma Green Belt Certification Body of Knowledge that the exam will cover. We strongly encourage you to study and
Case Study of CMMI implementation at Bank of Montreal (BMO) Financial Group
 Financial Group") Case Study of CMMI implementation at Bank of Montreal (BMO) Financial Group Background Started in 1817, Bank of Montreal - BMO Financial Group (NYSE, TSX: BMO) is a highly diversified financial services
Case Study of CMMI implementation at Bank of Montreal (BMO) Financial Group Background Started in 1817, Bank of Montreal - BMO Financial Group (NYSE, TSX: BMO) is a highly diversified financial services
What humans had to do: Challenges: 2nd Generation SPC What humans had to know: What humans had to do: Challenges:
 Moving to a fourth generation: SPC that lets you do your work by Steve Daum Software Development Manager PQ Systems, Inc. Abstract: This paper reviews the ways in which process control technology has moved
TEST METRICS AND KPI S
 WHITE PAPER TEST METRICS AND KPI S Abstract This document serves as a guideline for understanding metrics and the Key performance indicators for a testing project. Metrics are parameters or measures of
Implementing the CMMI within an Information Technology (IT) Organization. March 2005
 Organization. March 2005") Implementing the CMMI within an Information Technology (IT) Organization March 2005 AGENDA Organization Overview Information Technology (IT) Diversity SEI CMMI IT Sponsorship Information Technology Process
Implementing the CMMI within an Information Technology (IT) Organization March 2005 AGENDA Organization Overview Information Technology (IT) Diversity SEI CMMI IT Sponsorship Information Technology Process
Benchmarking Software Quality With Applied Cost of Quality
 Benchmarking Software Quality With Applied Cost of Quality Cost of Quality has remained theoretical in many treatments despite its powerful relevance in software quality. A survey-based approach makes
Process Quality. BIZ2121-04 Production & Operations Management. Sung Joo Bae, Assistant Professor. Yonsei University School of Business
 BIZ2121-04 Production & Operations Management Process Quality Sung Joo Bae, Assistant Professor Yonsei University School of Business Disclaimer: Many slides in this presentation file are from the copyrighted
Unit 1: Introduction to Quality Management
 Unit 1: Introduction to Quality Management Definition & Dimensions of Quality Quality Control vs Quality Assurance Small-Q vs Big-Q & Evolution of Quality Movement Total Quality Management (TQM) & its
ORACLE NAIO Excellence combined with Quality A CMMI Case study
 CASE STUDY ORACLE NAIO Excellence combined with Quality A CMMI Case study softwaredi xide com www.qaiasia.com THE CLIENT Process and Quality are important for measuring improvement. Improvement means different
Learning from Our Mistakes with Defect Causal Analysis. April 2001. Copyright 2001, Software Productivity Consortium NFP, Inc. All rights reserved.
 Learning from Our Mistakes with Defect Causal Analysis April 2001 David N. Card Based on the article in IEEE Software, January 1998 1 Agenda What is Defect Causal Analysis? Defect Prevention Key Process
MKS Integrity & CMMI. July, 2007
 & CMMI July, 2007 Why the drive for CMMI? Missed commitments Spiralling costs Late delivery to the market Last minute crunches Inadequate management visibility Too many surprises Quality problems Customer
Process Failure Modes and Effects Analysis PFMEA for Suppliers
 Process Failure Modes and Effects Analysis PFMEA for Suppliers Copyright 2003-2007 Raytheon Company. All rights reserved. R6σ is a Raytheon trademark registered in the United States and Europe. Raytheon
Capability Maturity Model Integration (CMMI ) Version 1.2 Overview
 Version 1.2 Overview") Capability Maturity Model Integration (CMMI ) Version 1.2 Overview SM CMM Integration, IDEAL, Personal Software Process, PSP, SCAMPI, SCAMPI Lead Appraiser, Team Software Process, and TSP are service marks
Capability Maturity Model Integration (CMMI ) Version 1.2 Overview SM CMM Integration, IDEAL, Personal Software Process, PSP, SCAMPI, SCAMPI Lead Appraiser, Team Software Process, and TSP are service marks
The normal approximation to the binomial
 The normal approximation to the binomial The binomial probability function is not useful for calculating probabilities when the number of trials n is large, as it involves multiplying a potentially very
Design of Experiments (DOE) Tutorial
 Tutorial") Design of Experiments (DOE) Tutorial Design of Experiments (DOE) techniques enables designers to determine simultaneously the individual and interactive effects of many factors that could affect the output
Design of Experiments (DOE) Tutorial Design of Experiments (DOE) techniques enables designers to determine simultaneously the individual and interactive effects of many factors that could affect the output
Lessons Learned in Security Measurement. Nadya Bartol & Brian Bates Booz Allen Hamilton
 Lessons Learned in Security Measurement Nadya Bartol & Brian Bates Booz Allen Hamilton Contents Overview Lessons Learned Case Studies Summary Reasons Behind Security Metrics Information security measurement
Pristine s Day Trading Journal...with Strategy Tester and Curve Generator
 Pristine s Day Trading Journal...with Strategy Tester and Curve Generator User Guide Important Note: Pristine s Day Trading Journal uses macros in an excel file. Macros are an embedded computer code within
Since 1985, the Test Program Set (TPS) development
 development") Applying Management Reserve to Software Project Management Walter H. Lipke Oklahoma City Air Logistics Center, Directorate of Aircraft Maintenance, Software Division Today s standard of practice for managing
Applying Management Reserve to Software Project Management Walter H. Lipke Oklahoma City Air Logistics Center, Directorate of Aircraft Maintenance, Software Division Today s standard of practice for managing
Practical Metrics and Models for Return on Investment by David F. Rico
 Practical Metrics and Models for Return on Investment by David F. Rico Abstract Return on investment or ROI is a widely used approach for measuring the value of a new and improved process or product technology.
Measurement Strategies in the CMMI
 Measurement Strategies in the CMMI International Software Measurement & Analysis Conference 9-14 September 2007 Rick Hefner, Ph.D. Director, Process Management Northrop Grumman Corporation One Space Park,
pm4dev, 2008 management for development series Project Quality Management PROJECT MANAGEMENT FOR DEVELOPMENT ORGANIZATIONS
 pm4dev, 2008 management for development series Project Quality Management PROJECT MANAGEMENT FOR DEVELOPMENT ORGANIZATIONS PROJECT MANAGEMENT FOR DEVELOPMENT ORGANIZATIONS A methodology to manage development
An Introduction to. Metrics. used during. Software Development
 An Introduction to Metrics used during Software Development Life Cycle www.softwaretestinggenius.com Page 1 of 10 Define the Metric Objectives You can t control what you can t measure. This is a quote
Certified Software Quality Assurance Professional VS-1085
 Certified Software Quality Assurance Professional VS-1085 Certified Software Quality Assurance Professional Certified Software Quality Assurance Professional Certification Code VS-1085 Vskills certification
Noorul Islam College of Engineering M. Sc. Software Engineering (5 yrs) IX Semester XCS592- Software Project Management
 IX Semester XCS592- Software Project Management") Noorul Islam College of Engineering M. Sc. Software Engineering (5 yrs) IX Semester XCS592- Software Project Management 8. What is the principle of prototype model? A prototype is built to quickly demonstrate
Noorul Islam College of Engineering M. Sc. Software Engineering (5 yrs) IX Semester XCS592- Software Project Management 8. What is the principle of prototype model? A prototype is built to quickly demonstrate
Project Management Challenges in Software Development
 Abstract Research Journal of Management Sciences ISSN 2319 1171 Project Management Challenges in Software Development Uma Sankar S.S. 1 and R. Jubi 2 1 Research and Development Centre, Bharathiar University,
PROJECT QUALITY MANAGEMENT
 8 PROJECT QUALITY MANAGEMENT Project Quality Management includes the processes required to ensure that the project will satisfy the needs for which it was undertaken. It includes all activities of the
The normal approximation to the binomial
 The normal approximation to the binomial In order for a continuous distribution (like the normal) to be used to approximate a discrete one (like the binomial), a continuity correction should be used. There
Using Rational Software Solutions to Achieve CMMI Level 2
 Copyright Rational Software 2003 http://www.therationaledge.com/content/jan_03/f_cmmi_rr.jsp Using Rational Software Solutions to Achieve CMMI Level 2 by Rolf W. Reitzig Founder, Cognence, Inc. Over the
CSU, Fresno - Institutional Research, Assessment and Planning - Dmitri Rogulkin
 My presentation is about data visualization. How to use visual graphs and charts in order to explore data, discover meaning and report findings. The goal is to show that visual displays can be very effective
Justifying Simulation. Why use simulation? Accurate Depiction of Reality. Insightful system evaluations
 Why use simulation? Accurate Depiction of Reality Anyone can perform a simple analysis manually. However, as the complexity of the analysis increases, so does the need to employ computer-based tools. While
SOFTWARE QUALITY & SYSTEMS ENGINEERING PROGRAM. Quality Assurance Checklist
 SOFTWARE QUALITY & SYSTEMS ENGINEERING PROGRAM Quality Assurance Checklist The following checklist is intended to provide system owners, project managers, and other information systems development and
Instruction Manual for SPC for MS Excel V3.0
 Frequency Business Process Improvement 281-304-9504 20314 Lakeland Falls www.spcforexcel.com Cypress, TX 77433 Instruction Manual for SPC for MS Excel V3.0 35 30 25 LSL=60 Nominal=70 Capability Analysis
Six Sigma. Breakthrough Strategy or Your Worse Nightmare? Jeffrey T. Gotro, Ph.D. Director of Research & Development Ablestik Laboratories
 Six Sigma Breakthrough Strategy or Your Worse Nightmare? Jeffrey T. Gotro, Ph.D. Director of Research & Development Ablestik Laboratories Agenda What is Six Sigma? What are the challenges? What are the
Reliability Analysis A Tool Set for. Aron Brall
 Reliability Analysis A Tool Set for Improving Business Processes Aron Brall ManTech International 1 Introduction Outline Defining Business Process Reliability Quantifying Business Process Reliability Business
Learning Objectives. Understand how to select the correct control chart for an application. Know how to fill out and maintain a control chart.
 CONTROL CHARTS Learning Objectives Understand how to select the correct control chart for an application. Know how to fill out and maintain a control chart. Know how to interpret a control chart to determine
Data Classification Technical Assessment
 Data Classification Update: February 13th, 2015 Statement of Confidentiality This Confidential Information is being provided to Customer ABC as a deliverable of this consulting engagement. The sole purpose
Role of Design for Six Sigma in Total Product Development
 Role of Design for Six Sigma in Total Product Development Presentation Outline Introduction to Six Sigma DMAIC Approach Benefits and Limitations of DMAIC Introduction to Design For Six Sigma (DFSS) DMAIC
(Refer Slide Time: 01:52)
") Software Engineering Prof. N. L. Sarda Computer Science & Engineering Indian Institute of Technology, Bombay Lecture - 2 Introduction to Software Engineering Challenges, Process Models etc (Part 2) This
Software Engineering Prof. N. L. Sarda Computer Science & Engineering Indian Institute of Technology, Bombay Lecture - 2 Introduction to Software Engineering Challenges, Process Models etc (Part 2) This
Data exploration with Microsoft Excel: univariate analysis
 Data exploration with Microsoft Excel: univariate analysis Contents 1 Introduction... 1 2 Exploring a variable s frequency distribution... 2 3 Calculating measures of central tendency... 16 4 Calculating
Corrective and Preventive Action Background & Examples Presented by:
 Corrective and Preventive Action Background & Examples Presented by: Kimberly Lewandowski-Walker Food and Drug Administration Division of Domestic Field Investigations Office of Regulatory Affairs Overview
Data Analysis, Statistics, and Probability
 Chapter 6 Data Analysis, Statistics, and Probability Content Strand Description Questions in this content strand assessed students skills in collecting, organizing, reading, representing, and interpreting
Lean Six Sigma Black Belt Body of Knowledge
 General Lean Six Sigma Defined UN Describe Nature and purpose of Lean Six Sigma Integration of Lean and Six Sigma UN Compare and contrast focus and approaches (Process Velocity and Quality) Y=f(X) Input
Fairfield Public Schools
 Mathematics Fairfield Public Schools AP Statistics AP Statistics BOE Approved 04/08/2014 1 AP STATISTICS Critical Areas of Focus AP Statistics is a rigorous course that offers advanced students an opportunity
Risk Management Framework
 Risk Management Framework Christopher J. Alberts Audrey J. Dorofee August 2010 TECHNICAL REPORT CMU/SEI-2010-TR-017 ESC-TR-2010-017 Acquisition Support Program Unlimited distribution subject to the copyright.
The CAM-I Performance Management Framework
 The CAM-I Performance Framework HOW TO EVALUATE AND IMPROVE ORGANIZATIONAL PERFORMANCE EXECUTIVE OVERVIEW The CAM-I Performance Framework HOW TO EVALUATE AND IMPROVE ORGANIZATIONAL PERFORMANCE EXECUTIVE
International Association of Scientific Innovation and Research (IASIR) (An Association Unifying the Sciences, Engineering, and Applied Research)
 (An Association Unifying the Sciences, Engineering, and Applied Research)") International Association of Scientific Innovation and Research (IASIR) (An Association Unifying the Sciences, Engineering, and Applied Research) International Journal of Engineering, Business and Enterprise
International Association of Scientific Innovation and Research (IASIR) (An Association Unifying the Sciences, Engineering, and Applied Research) International Journal of Engineering, Business and Enterprise
Software Quality Management
 Software Lecture 9 Software Engineering CUGS Spring 2011 Kristian Sandahl Department of Computer and Information Science Linköping University, Sweden A Software Life-cycle Model Which part will we talk
IBM SPSS Statistics 20 Part 4: Chi-Square and ANOVA
 CALIFORNIA STATE UNIVERSITY, LOS ANGELES INFORMATION TECHNOLOGY SERVICES IBM SPSS Statistics 20 Part 4: Chi-Square and ANOVA Summer 2013, Version 2.0 Table of Contents Introduction...2 Downloading the
Common Tools for Displaying and Communicating Data for Process Improvement
 Common Tools for Displaying and Communicating Data for Process Improvement Packet includes: Tool Use Page # Box and Whisker Plot Check Sheet Control Chart Histogram Pareto Diagram Run Chart Scatter Plot
HOW TO IMPROVE QUALITY AND EFFICIENCY USING TEST DATA ANALYTICS
 HOW TO IMPROVE QUALITY AND EFFICIENCY USING TEST DATA ANALYTICS Discover 8 ways in our guide for advanced manufacturers Do you perform advanced manufacturing in an industry such as aerospace, automotive,
Lean Six Sigma Black Belt-EngineRoom
 Lean Six Sigma Black Belt-EngineRoom Course Content and Outline Total Estimated Hours: 140.65 *Course includes choice of software: EngineRoom (included for free), Minitab (must purchase separately) or
Risk Repository. Prepare for Risk Management (SG 1) Mitigate Risks (SG 3) Identify and Analyze Risks (SG 2)
 Mitigate Risks (SG 3) Identify and Analyze Risks (SG 2)") Identify potential problems before they occur, so that riskhandling activities may be planned and invoked as needed across the life of the product or project to mitigate adverse impacts on achieving objectives.
Identify potential problems before they occur, so that riskhandling activities may be planned and invoked as needed across the life of the product or project to mitigate adverse impacts on achieving objectives.
Testing Metrics. Introduction
 Introduction Why Measure? What to Measure? It is often said that if something cannot be measured, it cannot be managed or improved. There is immense value in measurement, but you should always make sure
Software Process Improvement CMM
 Software Process Improvement CMM Marcello Visconti Departamento de Informática Universidad Técnica Federico Santa María Valparaíso, Chile Software Engineering Institute Founded by the Department of Defense
Continuous Risk Management at NASA
 Continuous Risk Management at NASA Ted Hammer GSFC NASA 301-286-7123 [email protected] Control Identify Track Dr. Linda Rosenberg SATC NASA 301-286-0087 [email protected] Communicate
Reaching CMM Levels 2 and 3 with the Rational Unified Process
 Reaching CMM Levels 2 and 3 with the Rational Unified Process Rational Software White Paper TP174 Table of Contents INTRODUCTION... 1 LEVEL-2, REPEATABLE... 3 Requirements Management... 3 Software Project
Course Overview Lean Six Sigma Green Belt
 Course Overview Lean Six Sigma Green Belt Summary and Objectives This Six Sigma Green Belt course is comprised of 11 separate sessions. Each session is a collection of related lessons and includes an interactive
American Society for Quality (ASQ) CERTIFIED SIX SIGMA GREEN BELT (CSSGB) BODY OF KNOWLEDGE 2014
 CERTIFIED SIX SIGMA GREEN BELT (CSSGB) BODY OF KNOWLEDGE 2014") American Society for Quality (ASQ) CERTIFIED SIX SIGMA GREEN BELT (CSSGB) BODY OF KNOWLEDGE 2014 Included in this body of knowledge (BOK) are explanations (subtext) and cognitive levels for each topic
American Society for Quality (ASQ) CERTIFIED SIX SIGMA GREEN BELT (CSSGB) BODY OF KNOWLEDGE 2014 Included in this body of knowledge (BOK) are explanations (subtext) and cognitive levels for each topic
Extending CMMI Level 4/5 Organizational Metrics Beyond Software Development
 Extending CMMI Level 4/5 Organizational Metrics Beyond Software Development CMMI Technology Conference and User Group Denver, Colorado 14-17 November 2005 Linda Brooks Northrop Grumman Corporation Topics
Exploratory Spatial Data Analysis
 Exploratory Spatial Data Analysis Part II Dynamically Linked Views 1 Contents Introduction: why to use non-cartographic data displays Display linking by object highlighting Dynamic Query Object classification
20 Points for Quality and Process Improvement
 20 Points for Quality and Process Improvement SEPG 2007 Conference March 2007 Austin, Texas Tim Kasse Kasse Initiatives LLC +1 972-987 - 7706 USA +49 (0) 7721-407 - 851 Europe +65 6430 6769 Singapore Welcome
How To Understand And Understand The Cmm
 W H I T E P A P E R SEI's Capability Maturity Model Integrated (CMMI) Relative to ICM's CMII (Rev B) SUMMARY CMMI is built on a set of integrated processes and includes CM as a supporting process. The
CREATING LEARNING OUTCOMES
 CREATING LEARNING OUTCOMES What Are Student Learning Outcomes? Learning outcomes are statements of the knowledge, skills and abilities individual students should possess and can demonstrate upon completion
Copyright 2010-2012 PEOPLECERT Int. Ltd and IASSC
 PEOPLECERT - Personnel Certification Body 3 Korai st., 105 64 Athens, Greece, Tel.: +30 210 372 9100, Fax: +30 210 372 9101, e-mail: [email protected], www.peoplecert.org Copyright 2010-2012 PEOPLECERT
Visualization Quick Guide
 Visualization Quick Guide A best practice guide to help you find the right visualization for your data WHAT IS DOMO? Domo is a new form of business intelligence (BI) unlike anything before an executive
Fault Slip Through Measurement in Software Development Process
 Fault Slip Through Measurement in Software Development Process Denis Duka, Lovre Hribar Research and Development Center Ericsson Nikola Tesla Split, Croatia [email protected]; [email protected]
Your Software Quality is Our Business. INDEPENDENT VERIFICATION AND VALIDATION (IV&V) WHITE PAPER Prepared by Adnet, Inc.
 WHITE PAPER Prepared by Adnet, Inc.") INDEPENDENT VERIFICATION AND VALIDATION (IV&V) WHITE PAPER Prepared by Adnet, Inc. February 2013 1 Executive Summary Adnet is pleased to provide this white paper, describing our approach to performing
INDEPENDENT VERIFICATION AND VALIDATION (IV&V) WHITE PAPER Prepared by Adnet, Inc. February 2013 1 Executive Summary Adnet is pleased to provide this white paper, describing our approach to performing
Data Mining. for Process Improvement DATA MINING. Paul Below, Quantitative Software Management, Inc. (QSM)
") Data mining techniques can be used to help thin out the forest so that we can examine the important trees. Hopefully, this article will encourage you to learn more about data mining, try some of the techniques
Data mining techniques can be used to help thin out the forest so that we can examine the important trees. Hopefully, this article will encourage you to learn more about data mining, try some of the techniques
P6 Analytics Reference Manual
 P6 Analytics Reference Manual Release 3.2 October 2013 Contents Getting Started... 7 About P6 Analytics... 7 Prerequisites to Use Analytics... 8 About Analyses... 9 About... 9 About Dashboards... 10 Logging
Camber Quality Assurance (QA) Approach
 Approach") Camber Quality Assurance (QA) Approach Camber s QA approach brings a tested, systematic methodology, ensuring that our customers receive the highest quality products and services, delivered via efficient
Camber Quality Assurance (QA) Approach Camber s QA approach brings a tested, systematic methodology, ensuring that our customers receive the highest quality products and services, delivered via efficient
Processing of Insurance Returns. An EMC Lean Six Sigma Project. Author: Aidan Trindle. Editor: Mohan Mahadevan
 Processing of Insurance Returns An EMC Lean Six Sigma Project Author: Aidan Trindle Editor: Mohan Mahadevan EMC Corporation is the world leader in systems, software, services, and solutions for building
Quantitative Displays for Combining Time-Series and Part-to-Whole Relationships
 Quantitative Displays for Combining Time-Series and Part-to-Whole Relationships Stephen Few, Perceptual Edge Visual Business Intelligence Newsletter January, February, and March 211 Graphical displays
Six Sigma DMAIC Model and its Synergy with ITIL and CMMI
 Six Sigma DMAIC Model and its Synergy with ITIL and CMMI Muhammad Noman Butt and M. Anwar SZABIST, Karachi. Abstract: Considering the rapid growth of the emerging trends and technologies as well as the
How To Measure Quality
 Introduction Metrics for Software Testing: Managing with Facts Part 4: Product Metrics In the previous article in this series, we moved from a discussion of process metrics to a discussion of how metrics
Four Key Elements of an Effective Continuous Process Advantage Series White Paper By Jeff Gotro, Ph.D., CMC
 Four Key Elements of an Effective Continuous Process Advantage Series White Paper By Jeff Gotro, Ph.D., CMC Introduction Tough times call for bold actions. The manufacturing sector is going through a challenging
IBM SPSS Direct Marketing 22
 IBM SPSS Direct Marketing 22 Note Before using this information and the product it supports, read the information in Notices on page 25. Product Information This edition applies to version 22, release
Six Sigma in Project Management for Software Companies
 Six Sigma in Project Management for Software Companies Yogesh Chauhan Total Quality Engineering & Management PEC University of Technology, Chandigarh, India Dr. R M Belokar PEC University of Technology,