Information Technology Services will be updating the mark sense test scoring hardware and software on Monday, May 18, We will continue to score
|
|
|
- Dustin Goodman
- 10 years ago
- Views:
Transcription
1 Information Technology Services will be updating the mark sense test scoring hardware and software on Monday, May 18, We will continue to score all Spring term exams utilizing the current hardware and software. This upgrade must be done to bring both the hardware and software up to current technology standards. The upgrade can not be delayed beyond May 18th. What has changed? New reports have different names, look slightly different with all information showing on different reports. The following 13 slides are examples of the current and new version of each report. Test scoring procedures (turning in of exams, scanning of exams, sending of results, and pick-up procedures remain unchanged). The only change is that the reports look different (feedback thus far is very favorable). Questions Contact the I.T.S. Help Desk at or

2 Current Report # 1
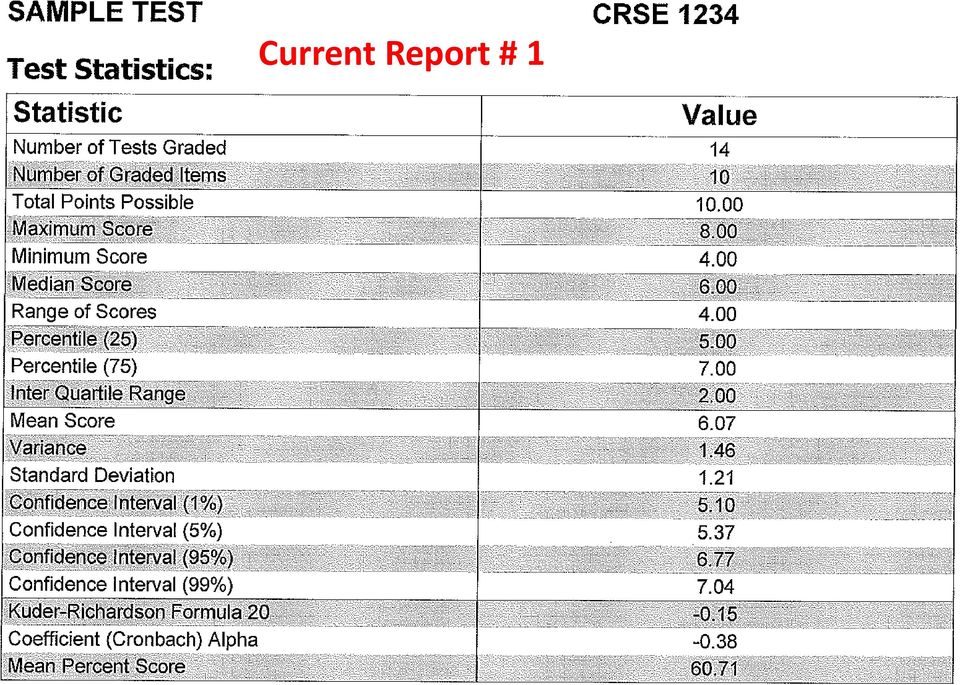
3 New Report # 1 Differences: Information is presented in a different order Report doesn t list number of tests graded (information found on New Report # 7) Calculations for Standard Deviation, Variance, Confidence Intervals, Kudor- Richardson Formula 20, and the Coefficient (Cronbach) Alpha are slightly different - new software expands on the number of decimal places used.
 Alpha are slightly different - new software expands on the number of decimal")
4 Current Report # 2
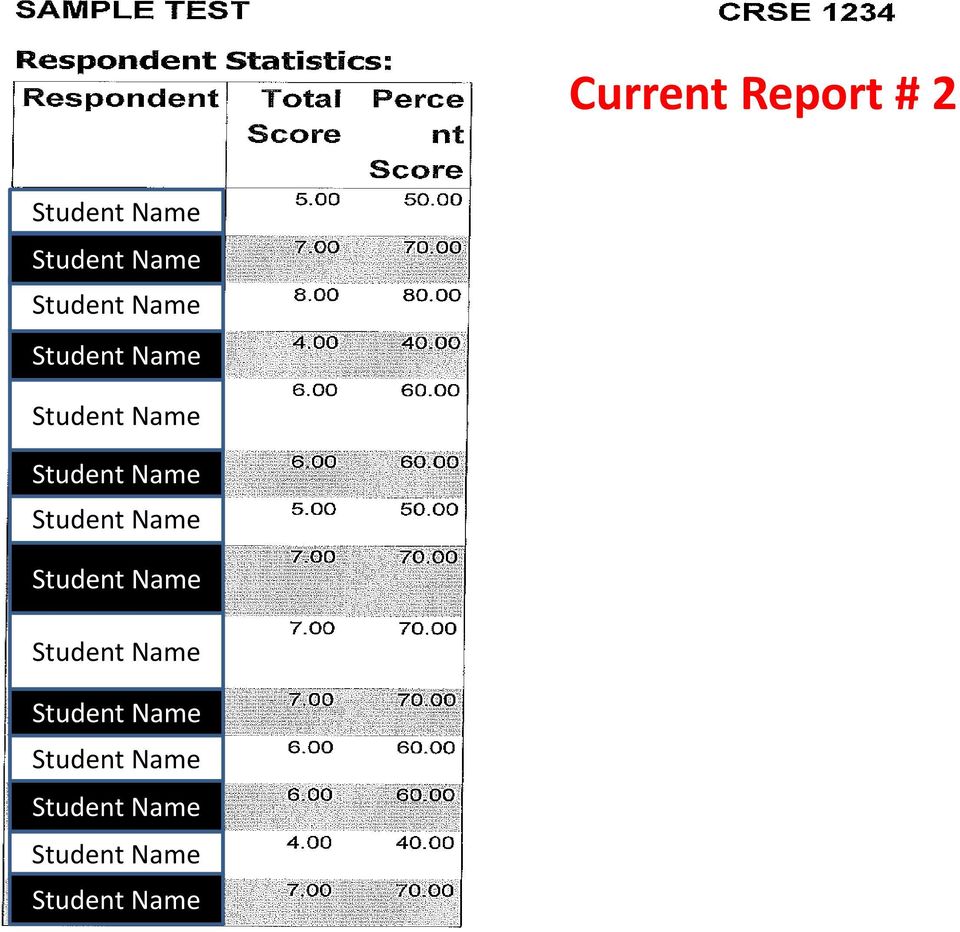

5 New Report # 2 Added Features: Total column also shows number of questions on exam (still includes number of the correct answers by the student) Percent column shows a bar scale of student percentile Mean value of correctly answered questions with percentage This is where the names of the Students whose exams were scanned and graded can be found

6 Current Report # 3

7 New Report # 3 Added Features: Mean score percentage with bar chart Raw score of exam Percent of students within a 10 percent bracket Bar chart reflecting distribution of exams

8 Current Report # 4
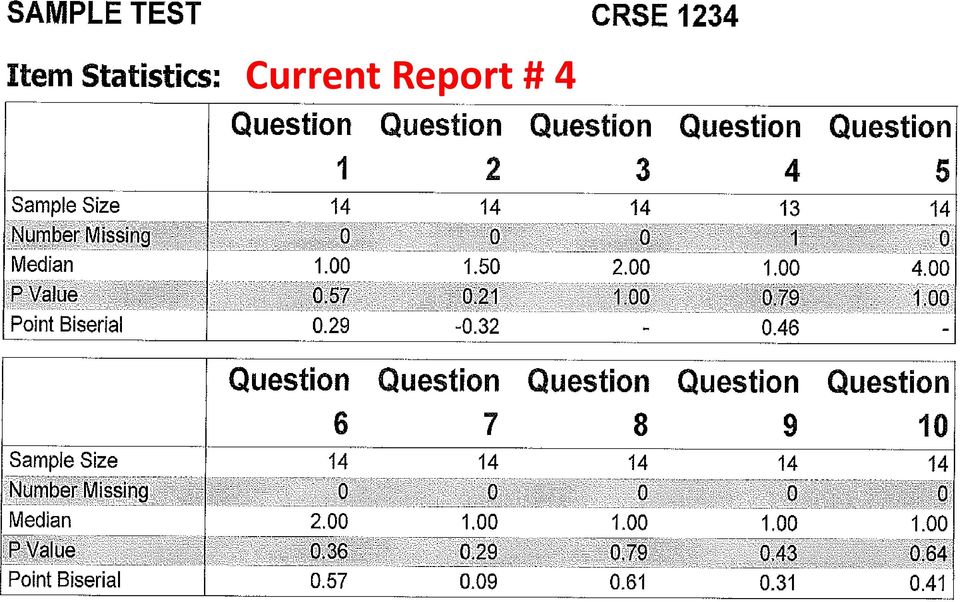
 Added Features: Point value per question (new) Correct answers per question (new) Incorrect")
9 New Report # 4 Differences: Questions listed vertically, not horizontally Old report Sample Size is Graded on new report Old report Number Missing is No Response on new report Old report P-Value is Percent Correct with bar chart on new report Does not report Median value (reported on New Report # 7) Added Features: Point value per question (new) Correct answers per question (new) Incorrect answers per question (new)
 Correct answers per question (new) Incorrect answers per")
10 Current Report # 5 Note: The data for the remaining questions was not included in this presentation but an entire report would reflect information appropriate for every question graded

11 New Report # 5 Added Features: Data for each question is laid out better for readability Point Biserial calculation for each question

12 Current Report # 6
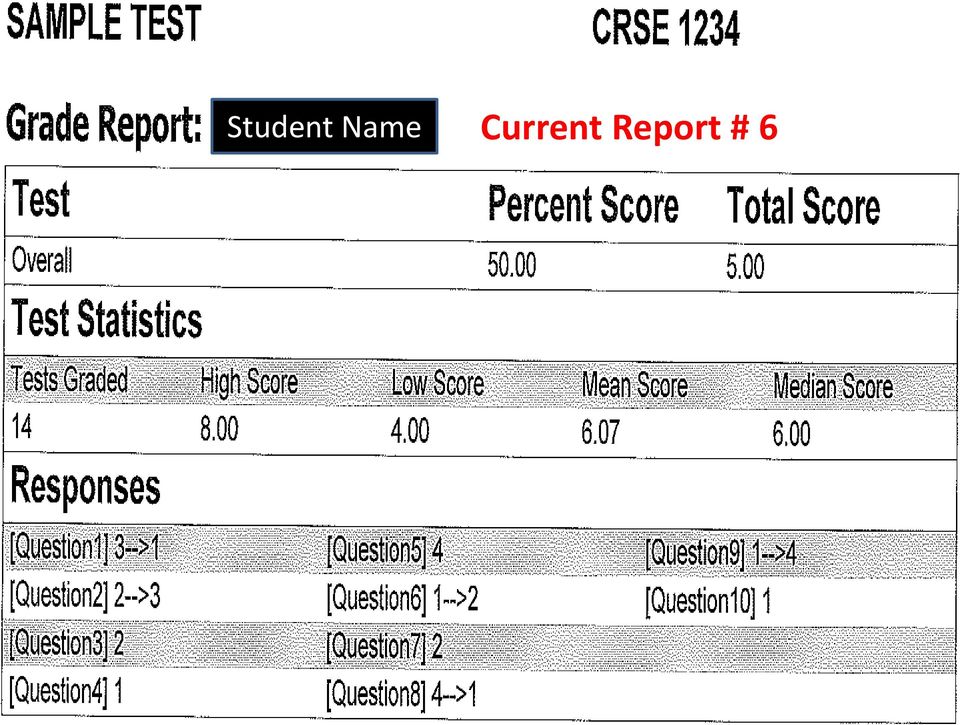
13 New Report # 6 Differences: Does not provide # of exams graded to student (on New Report # 7) Total Score shows number correct over number of questions scored Does not provide High or Low score on exam to student (on New Report # 7) Does not provide Mean score of exams graded to student (on New Report # 7) Does not provide Median score of exams graded to student (on New Report # 7) Added Features: Percent Score (%) gives numeric and also a bar graph of score Question/Response/Correct answer provides clearer information
 gives numeric and also a bar graph of score Question/Response/Correct answer provides clearer")
, Max and Min score (High & Low score), Mean & Median Score Previously included on Item Statistics (Old Report # 4): Median Score Clearly shows correct answer for each question New is")
14 Report # 7 Completely NEW Report Information provided not on previous six reports: Previously included on Student Grade (Old Report # 6): Total possible points (questions scored), Total Students (Tests graded), Max and Min score (High & Low score), Mean & Median Score Previously included on Item Statistics (Old Report # 4): Median Score Clearly shows correct answer for each question New is Standard Deviation, Reliability Coefficient and Range of Scores New is Response Frequency, Non-Distractor, Correct Group response & Point Biserial for each question

Grading and Survey Solution
 WHITE PAPER Grading and Survey Solution Introduction With the advent of the No Child Left Behind Act (NCLB), schools around the nation are required to track and report the effectiveness of their curriculum
Statistics I for QBIC. Contents and Objectives. Chapters 1 7. Revised: August 2013
 Statistics I for QBIC Text Book: Biostatistics, 10 th edition, by Daniel & Cross Contents and Objectives Chapters 1 7 Revised: August 2013 Chapter 1: Nature of Statistics (sections 1.1-1.6) Objectives
STA-201-TE. 5. Measures of relationship: correlation (5%) Correlation coefficient; Pearson r; correlation and causation; proportion of common variance
 Correlation coefficient; Pearson r; correlation and causation; proportion of common variance") Principles of Statistics STA-201-TE This TECEP is an introduction to descriptive and inferential statistics. Topics include: measures of central tendency, variability, correlation, regression, hypothesis
Principles of Statistics STA-201-TE This TECEP is an introduction to descriptive and inferential statistics. Topics include: measures of central tendency, variability, correlation, regression, hypothesis
Scatter Plots with Error Bars
 Chapter 165 Scatter Plots with Error Bars Introduction The procedure extends the capability of the basic scatter plot by allowing you to plot the variability in Y and X corresponding to each point. Each
Using MS Excel to Analyze Data: A Tutorial
 Using MS Excel to Analyze Data: A Tutorial Various data analysis tools are available and some of them are free. Because using data to improve assessment and instruction primarily involves descriptive and
Foundation of Quantitative Data Analysis
 Foundation of Quantitative Data Analysis Part 1: Data manipulation and descriptive statistics with SPSS/Excel HSRS #10 - October 17, 2013 Reference : A. Aczel, Complete Business Statistics. Chapters 1
Descriptive statistics Statistical inference statistical inference, statistical induction and inferential statistics
 Descriptive statistics is the discipline of quantitatively describing the main features of a collection of data. Descriptive statistics are distinguished from inferential statistics (or inductive statistics),
Data Mining Techniques Chapter 5: The Lure of Statistics: Data Mining Using Familiar Tools
 Data Mining Techniques Chapter 5: The Lure of Statistics: Data Mining Using Familiar Tools Occam s razor.......................................................... 2 A look at data I.........................................................
Statistics Revision Sheet Question 6 of Paper 2
 Statistics Revision Sheet Question 6 of Paper The Statistics question is concerned mainly with the following terms. The Mean and the Median and are two ways of measuring the average. sumof values no. of
Using SPSS, Chapter 2: Descriptive Statistics
 1 Using SPSS, Chapter 2: Descriptive Statistics Chapters 2.1 & 2.2 Descriptive Statistics 2 Mean, Standard Deviation, Variance, Range, Minimum, Maximum 2 Mean, Median, Mode, Standard Deviation, Variance,
Dealing with Data in Excel 2010
 Dealing with Data in Excel 2010 Excel provides the ability to do computations and graphing of data. Here we provide the basics and some advanced capabilities available in Excel that are useful for dealing
TIPS FOR DOING STATISTICS IN EXCEL
 TIPS FOR DOING STATISTICS IN EXCEL Before you begin, make sure that you have the DATA ANALYSIS pack running on your machine. It comes with Excel. Here s how to check if you have it, and what to do if you
MASTER COURSE SYLLABUS-PROTOTYPE PSYCHOLOGY 2317 STATISTICAL METHODS FOR THE BEHAVIORAL SCIENCES
 MASTER COURSE SYLLABUS-PROTOTYPE THE PSYCHOLOGY DEPARTMENT VALUES ACADEMIC FREEDOM AND THUS OFFERS THIS MASTER SYLLABUS-PROTOTYPE ONLY AS A GUIDE. THE INSTRUCTORS ARE FREE TO ADAPT THEIR COURSE SYLLABI
Descriptive Statistics
 Descriptive Statistics Primer Descriptive statistics Central tendency Variation Relative position Relationships Calculating descriptive statistics Descriptive Statistics Purpose to describe or summarize
Exercise 1.12 (Pg. 22-23)
") Individuals: The objects that are described by a set of data. They may be people, animals, things, etc. (Also referred to as Cases or Records) Variables: The characteristics recorded about each individual.
Individuals: The objects that are described by a set of data. They may be people, animals, things, etc. (Also referred to as Cases or Records) Variables: The characteristics recorded about each individual.
MULTIPLE CHOICE. Choose the one alternative that best completes the statement or answers the question.
 Final Exam Review MULTIPLE CHOICE. Choose the one alternative that best completes the statement or answers the question. 1) A researcher for an airline interviews all of the passengers on five randomly
Test Scoring And Course Evaluation Service
 Test Scoring And Course Evaluation Service TABLE OF CONTENTS Introduction... 3 Section 1: Preparing a Test or Questionnaire... 4 Obtaining the Answer Forms... 4 Planning the Test or Course evaluation...
INTRODUCTION TO EXCEL
 INTRODUCTION TO EXCEL 1 INTRODUCTION Anyone who has used a computer for more than just playing games will be aware of spreadsheets A spreadsheet is a versatile computer program (package) that enables you
Below is a very brief tutorial on the basic capabilities of Excel. Refer to the Excel help files for more information.
 Excel Tutorial Below is a very brief tutorial on the basic capabilities of Excel. Refer to the Excel help files for more information. Working with Data Entering and Formatting Data Before entering data
Engineering Problem Solving and Excel. EGN 1006 Introduction to Engineering
 Engineering Problem Solving and Excel EGN 1006 Introduction to Engineering Mathematical Solution Procedures Commonly Used in Engineering Analysis Data Analysis Techniques (Statistics) Curve Fitting techniques
Using Excel for descriptive statistics
 FACT SHEET Using Excel for descriptive statistics Introduction Biologists no longer routinely plot graphs by hand or rely on calculators to carry out difficult and tedious statistical calculations. These
Business Statistics. Successful completion of Introductory and/or Intermediate Algebra courses is recommended before taking Business Statistics.
 Business Course Text Bowerman, Bruce L., Richard T. O'Connell, J. B. Orris, and Dawn C. Porter. Essentials of Business, 2nd edition, McGraw-Hill/Irwin, 2008, ISBN: 978-0-07-331988-9. Required Computing
Activity 3.7 Statistical Analysis with Excel
 Activity 3.7 Statistical Analysis with Excel Introduction Engineers use various tools to make their jobs easier. Spreadsheets can greatly improve the accuracy and efficiency of repetitive and common calculations;
Calculation example mean, median, midrange, mode, variance, and standard deviation for raw and grouped data
 Calculation example mean, median, midrange, mode, variance, and standard deviation for raw and grouped data Raw data: 7, 8, 6, 3, 5, 5, 1, 6, 4, 10 Sorted data: 1, 3, 4, 5, 5, 6, 6, 7, 8, 10 Number of
A Matched Study of Washington State 10th Grade Assessment Scores of Students in Schools Using The Core-Plus Mathematics Program
 A ed Study of Washington State 10th Grade Assessment Scores of Students in Schools Using The Core-Plus Mathematics Program By Reggie Nelson Mathematics Department Chair Burlington-Edison School District
Bowerman, O'Connell, Aitken Schermer, & Adcock, Business Statistics in Practice, Canadian edition
 Bowerman, O'Connell, Aitken Schermer, & Adcock, Business Statistics in Practice, Canadian edition Online Learning Centre Technology Step-by-Step - Excel Microsoft Excel is a spreadsheet software application
Exploratory data analysis (Chapter 2) Fall 2011
 Fall 2011") Exploratory data analysis (Chapter 2) Fall 2011 Data Examples Example 1: Survey Data 1 Data collected from a Stat 371 class in Fall 2005 2 They answered questions about their: gender, major, year in school,
Exploratory data analysis (Chapter 2) Fall 2011 Data Examples Example 1: Survey Data 1 Data collected from a Stat 371 class in Fall 2005 2 They answered questions about their: gender, major, year in school,
Descriptive Statistics
 Y520 Robert S Michael Goal: Learn to calculate indicators and construct graphs that summarize and describe a large quantity of values. Using the textbook readings and other resources listed on the web
03 The full syllabus. 03 The full syllabus continued. For more information visit www.cimaglobal.com PAPER C03 FUNDAMENTALS OF BUSINESS MATHEMATICS
 0 The full syllabus 0 The full syllabus continued PAPER C0 FUNDAMENTALS OF BUSINESS MATHEMATICS Syllabus overview This paper primarily deals with the tools and techniques to understand the mathematics
COMPARISON MEASURES OF CENTRAL TENDENCY & VARIABILITY EXERCISE 8/5/2013. MEASURE OF CENTRAL TENDENCY: MODE (Mo) MEASURE OF CENTRAL TENDENCY: MODE (Mo)
 MEASURE OF CENTRAL TENDENCY: MODE (Mo)") COMPARISON MEASURES OF CENTRAL TENDENCY & VARIABILITY Prepared by: Jess Roel Q. Pesole CENTRAL TENDENCY -what is average or typical in a distribution Commonly Measures: 1. Mode. Median 3. Mean quantified
COMPARISON MEASURES OF CENTRAL TENDENCY & VARIABILITY Prepared by: Jess Roel Q. Pesole CENTRAL TENDENCY -what is average or typical in a distribution Commonly Measures: 1. Mode. Median 3. Mean quantified
Course Text. Required Computing Software. Course Description. Course Objectives. StraighterLine. Business Statistics
 Course Text Business Statistics Lind, Douglas A., Marchal, William A. and Samuel A. Wathen. Basic Statistics for Business and Economics, 7th edition, McGraw-Hill/Irwin, 2010, ISBN: 9780077384470 [This
Data exploration with Microsoft Excel: analysing more than one variable
 Data exploration with Microsoft Excel: analysing more than one variable Contents 1 Introduction... 1 2 Comparing different groups or different variables... 2 3 Exploring the association between categorical
Data exploration with Microsoft Excel: univariate analysis
 Data exploration with Microsoft Excel: univariate analysis Contents 1 Introduction... 1 2 Exploring a variable s frequency distribution... 2 3 Calculating measures of central tendency... 16 4 Calculating
Final Exam Practice Problem Answers
 Final Exam Practice Problem Answers The following data set consists of data gathered from 77 popular breakfast cereals. The variables in the data set are as follows: Brand: The brand name of the cereal
consider the number of math classes taken by math 150 students. how can we represent the results in one number?
 ch 3: numerically summarizing data - center, spread, shape 3.1 measure of central tendency or, give me one number that represents all the data consider the number of math classes taken by math 150 students.
3.2 Measures of Spread
 3.2 Measures of Spread In some data sets the observations are close together, while in others they are more spread out. In addition to measures of the center, it's often important to measure the spread
2. Filling Data Gaps, Data validation & Descriptive Statistics
 2. Filling Data Gaps, Data validation & Descriptive Statistics Dr. Prasad Modak Background Data collected from field may suffer from these problems Data may contain gaps ( = no readings during this period)
Implications of Big Data for Statistics Instruction 17 Nov 2013
 Implications of Big Data for Statistics Instruction 17 Nov 2013 Implications of Big Data for Statistics Instruction Mark L. Berenson Montclair State University MSMESB Mini Conference DSI Baltimore November
Using Excel for Analyzing Survey Questionnaires Jennifer Leahy
 University of Wisconsin-Extension Cooperative Extension Madison, Wisconsin PD &E Program Development & Evaluation Using Excel for Analyzing Survey Questionnaires Jennifer Leahy G3658-14 Introduction You
EXAM #1 (Example) Instructor: Ela Jackiewicz. Relax and good luck!
 Instructor: Ela Jackiewicz. Relax and good luck!") STP 231 EXAM #1 (Example) Instructor: Ela Jackiewicz Honor Statement: I have neither given nor received information regarding this exam, and I will not do so until all exams have been graded and returned.
STP 231 EXAM #1 (Example) Instructor: Ela Jackiewicz Honor Statement: I have neither given nor received information regarding this exam, and I will not do so until all exams have been graded and returned.
Representing Data Using Frequency Graphs
 Lesson 25 Mathematics Assessment Project Formative Assessment Lesson Materials Representing Data Using Graphs MARS Shell Center University of Nottingham & UC Berkeley Alpha Version If you encounter errors
z-scores AND THE NORMAL CURVE MODEL
 z-scores AND THE NORMAL CURVE MODEL 1 Understanding z-scores 2 z-scores A z-score is a location on the distribution. A z- score also automatically communicates the raw score s distance from the mean A
Updates to Graphing with Excel
 Updates to Graphing with Excel NCC has recently upgraded to a new version of the Microsoft Office suite of programs. As such, many of the directions in the Biology Student Handbook for how to graph with
Chapter 1: Exploring Data
 Chapter 1: Exploring Data Chapter 1 Review 1. As part of survey of college students a researcher is interested in the variable class standing. She records a 1 if the student is a freshman, a 2 if the student
Section Format Day Begin End Building Rm# Instructor. 001 Lecture Tue 6:45 PM 8:40 PM Silver 401 Ballerini
 NEW YORK UNIVERSITY ROBERT F. WAGNER GRADUATE SCHOOL OF PUBLIC SERVICE Course Syllabus Spring 2016 Statistical Methods for Public, Nonprofit, and Health Management Section Format Day Begin End Building
Descriptive Analysis
 Research Methods William G. Zikmund Basic Data Analysis: Descriptive Statistics Descriptive Analysis The transformation of raw data into a form that will make them easy to understand and interpret; rearranging,
Consolidation of Grade 3 EQAO Questions Data Management & Probability
 Consolidation of Grade 3 EQAO Questions Data Management & Probability Compiled by Devika William-Yu (SE2 Math Coach) GRADE THREE EQAO QUESTIONS: Data Management and Probability Overall Expectations DV1
STAT 360 Probability and Statistics. Fall 2012
 STAT 360 Probability and Statistics Fall 2012 1) General information: Crosslisted course offered as STAT 360, MATH 360 Semester: Fall 2012, Aug 20--Dec 07 Course name: Probability and Statistics Number
STUDENT PLACEMENT GUIDE: DETERMINING PLACEMENT WITH GRADE LEVEL PROFICIENCIES
 STUDENT PLACEMENT GUIDE: DETERMINING PLACEMENT WITH LEVEL PROFICIENCIES BACKGROUND AND RESEARCH FOR PROFICIENCY LEVELS WORKING WITH METAMETRICS, INC., SCHOLASTIC HAS DEVISED PROFICIENCY LEVEL STANDARDS
MATH 103/GRACEY PRACTICE EXAM/CHAPTERS 2-3. MULTIPLE CHOICE. Choose the one alternative that best completes the statement or answers the question.
 MATH 3/GRACEY PRACTICE EXAM/CHAPTERS 2-3 Name MULTIPLE CHOICE. Choose the one alternative that best completes the statement or answers the question. Provide an appropriate response. 1) The frequency distribution
2013 MBA Jump Start Program. Statistics Module Part 3
 2013 MBA Jump Start Program Module 1: Statistics Thomas Gilbert Part 3 Statistics Module Part 3 Hypothesis Testing (Inference) Regressions 2 1 Making an Investment Decision A researcher in your firm just
Chapter 7 Section 1 Homework Set A
 Chapter 7 Section 1 Homework Set A 7.15 Finding the critical value t *. What critical value t * from Table D (use software, go to the web and type t distribution applet) should be used to calculate the
Paper No 19. FINALTERM EXAMINATION Fall 2009 MTH302- Business Mathematics & Statistics (Session - 2) Ref No: Time: 120 min Marks: 80
 Ref No: Time: 120 min Marks: 80") Paper No 19 FINALTERM EXAMINATION Fall 2009 MTH302- Business Mathematics & Statistics (Session - 2) Ref No: Time: 120 min Marks: 80 Question No: 1 ( Marks: 1 ) - Please choose one Scatterplots are used
Paper No 19 FINALTERM EXAMINATION Fall 2009 MTH302- Business Mathematics & Statistics (Session - 2) Ref No: Time: 120 min Marks: 80 Question No: 1 ( Marks: 1 ) - Please choose one Scatterplots are used
Math 201: Statistics November 30, 2006
 Math 201: Statistics November 30, 2006 Fall 2006 MidTerm #2 Closed book & notes; only an A4-size formula sheet and a calculator allowed; 90 mins. No questions accepted! Instructions: There are eleven pages
Chicago Booth BUSINESS STATISTICS 41000 Final Exam Fall 2011
 Chicago Booth BUSINESS STATISTICS 41000 Final Exam Fall 2011 Name: Section: I pledge my honor that I have not violated the Honor Code Signature: This exam has 34 pages. You have 3 hours to complete this
Can Confidence Assessment Enhance Traditional Multiple-Choice Testing?
 Can Confidence Assessment Enhance Traditional Multiple-Choice Testing? Josef Kolbitsch 1, Martin Ebner 1, Walther Nagler 1, Nicolai Scerbakov 2 1 Computing and Information Services, Graz University of
STT315 Chapter 4 Random Variables & Probability Distributions KM. Chapter 4.5, 6, 8 Probability Distributions for Continuous Random Variables
 Chapter 4.5, 6, 8 Probability Distributions for Continuous Random Variables Discrete vs. continuous random variables Examples of continuous distributions o Uniform o Exponential o Normal Recall: A random
Univariate Regression
 Univariate Regression Correlation and Regression The regression line summarizes the linear relationship between 2 variables Correlation coefficient, r, measures strength of relationship: the closer r is
The University of the State of New York REGENTS HIGH SCHOOL EXAMINATION INTEGRATED ALGEBRA. Tuesday, January 22, 2013 9:15 a.m. SAMPLE RESPONSE SET
 The University of the State of New York REGENTS HIGH SCHOOL EXAMINATION INTEGRATED ALGEBRA Tuesday, January 22, 2013 9:15 a.m. SAMPLE RESPONSE SET Table of Contents Practice Papers Question 31.......................
UNIT 1: COLLECTING DATA
 Core Probability and Statistics Probability and Statistics provides a curriculum focused on understanding key data analysis and probabilistic concepts, calculations, and relevance to real-world applications.
STATS8: Introduction to Biostatistics. Data Exploration. Babak Shahbaba Department of Statistics, UCI
 STATS8: Introduction to Biostatistics Data Exploration Babak Shahbaba Department of Statistics, UCI Introduction After clearly defining the scientific problem, selecting a set of representative members
A Picture Really Is Worth a Thousand Words
 4 A Picture Really Is Worth a Thousand Words Difficulty Scale (pretty easy, but not a cinch) What you ll learn about in this chapter Why a picture is really worth a thousand words How to create a histogram
DESCRIPTIVE STATISTICS. The purpose of statistics is to condense raw data to make it easier to answer specific questions; test hypotheses.
 DESCRIPTIVE STATISTICS The purpose of statistics is to condense raw data to make it easier to answer specific questions; test hypotheses. DESCRIPTIVE VS. INFERENTIAL STATISTICS Descriptive To organize,
UNIVERSITY of MASSACHUSETTS DARTMOUTH Charlton College of Business Decision and Information Sciences Fall 2010
 UNIVERSITY of MASSACHUSETTS DARTMOUTH Charlton College of Business Decision and Information Sciences Fall 2010 COURSE: POM 500 Statistical Analysis, ONLINE EDITION, Fall 2010 Prerequisite: Finite Math
A Basic Guide to Analyzing Individual Scores Data with SPSS
 A Basic Guide to Analyzing Individual Scores Data with SPSS Step 1. Clean the data file Open the Excel file with your data. You may get the following message: If you get this message, click yes. Delete
Break-even analysis. On page 256 of It s the Business textbook, the authors refer to an alternative approach to drawing a break-even chart.
 Break-even analysis On page 256 of It s the Business textbook, the authors refer to an alternative approach to drawing a break-even chart. In order to survive businesses must at least break even, which
MAP Reports. Teacher Report (by Goal Descriptors) Displays teachers class data for current testing term sorted by RIT score.
 Displays teachers class data for current testing term sorted by RIT score.") Goal Performance: These columns summarize the students performance in the goal strands tested in this subject. Data will display in these columns only if a student took a Survey w/ Goals test. Goal performance
Goal Performance: These columns summarize the students performance in the goal strands tested in this subject. Data will display in these columns only if a student took a Survey w/ Goals test. Goal performance
Curriculum Map Statistics and Probability Honors (348) Saugus High School Saugus Public Schools 2009-2010
 Saugus High School Saugus Public Schools 2009-2010") Curriculum Map Statistics and Probability Honors (348) Saugus High School Saugus Public Schools 2009-2010 Week 1 Week 2 14.0 Students organize and describe distributions of data by using a number of different
Curriculum Map Statistics and Probability Honors (348) Saugus High School Saugus Public Schools 2009-2010 Week 1 Week 2 14.0 Students organize and describe distributions of data by using a number of different
Statistical Data analysis With Excel For HSMG.632 students
 1 Statistical Data analysis With Excel For HSMG.632 students Dialog Boxes Descriptive Statistics with Excel To find a single descriptive value of a data set such as mean, median, mode or the standard deviation,
Hands-On Data Analysis
 THE 2012 ROSENTHAL PRIZE for Innovation in Math Teaching Hands-On Data Analysis Lesson Plan GRADE 6 Table of Contents Overview... 3 Prerequisite Knowledge... 3 Lesson Goals.....3 Assessment.... 3 Common
First Midterm Exam (MATH1070 Spring 2012)
") First Midterm Exam (MATH1070 Spring 2012) Instructions: This is a one hour exam. You can use a notecard. Calculators are allowed, but other electronics are prohibited. 1. [40pts] Multiple Choice Problems
First Midterm Exam (MATH1070 Spring 2012) Instructions: This is a one hour exam. You can use a notecard. Calculators are allowed, but other electronics are prohibited. 1. [40pts] Multiple Choice Problems
1 J (Gr 6): Summarize and describe distributions.
: Summarize and describe distributions.") MAT.07.PT.4.TRVLT.A.299 Sample Item ID: MAT.07.PT.4.TRVLT.A.299 Title: Travel Time to Work (TRVLT) Grade: 07 Primary Claim: Claim 4: Modeling and Data Analysis Students can analyze complex, real-world
MAT.07.PT.4.TRVLT.A.299 Sample Item ID: MAT.07.PT.4.TRVLT.A.299 Title: Travel Time to Work (TRVLT) Grade: 07 Primary Claim: Claim 4: Modeling and Data Analysis Students can analyze complex, real-world
DesCartes (Combined) Subject: Mathematics 2-5 Goal: Data Analysis, Statistics, and Probability
 Subject: Mathematics 2-5 Goal: Data Analysis, Statistics, and Probability") DesCartes (Combined) Subject: Mathematics 2-5 Goal: Data Analysis, Statistics, and Probability RIT Score Range: Below 171 Below 171 Data Analysis and Statistics Solves simple problems based on data from
DesCartes (Combined) Subject: Mathematics 2-5 Goal: Data Analysis, Statistics, and Probability RIT Score Range: Below 171 Below 171 Data Analysis and Statistics Solves simple problems based on data from
Spreadsheets Hop-around Cards
 Spreadsheets Hop-around Cards Visit us online at HOP-AROUND CARDS Preparation Print the cards out using a high quality colour printer Laminate each sheet and then cut out the individual cards to make a
Exchange Rate Regime Analysis for the Chinese Yuan
 Exchange Rate Regime Analysis for the Chinese Yuan Achim Zeileis Ajay Shah Ila Patnaik Abstract We investigate the Chinese exchange rate regime after China gave up on a fixed exchange rate to the US dollar
The test uses age norms (national) and grade norms (national) to calculate scores and compare students of the same age or grade.
 and grade norms (national) to calculate scores and compare students of the same age or grade.") Reading the CogAT Report for Parents The CogAT Test measures the level and pattern of cognitive development of a student compared to age mates and grade mates. These general reasoning abilities, which
Reading the CogAT Report for Parents The CogAT Test measures the level and pattern of cognitive development of a student compared to age mates and grade mates. These general reasoning abilities, which
Simple Linear Regression
 STAT 101 Dr. Kari Lock Morgan Simple Linear Regression SECTIONS 9.3 Confidence and prediction intervals (9.3) Conditions for inference (9.1) Want More Stats??? If you have enjoyed learning how to analyze
An introduction to using Microsoft Excel for quantitative data analysis
 Contents An introduction to using Microsoft Excel for quantitative data analysis 1 Introduction... 1 2 Why use Excel?... 2 3 Quantitative data analysis tools in Excel... 3 4 Entering your data... 6 5 Preparing
3.4 Statistical inference for 2 populations based on two samples
 3.4 Statistical inference for 2 populations based on two samples Tests for a difference between two population means The first sample will be denoted as X 1, X 2,..., X m. The second sample will be denoted
HISTOGRAMS, CUMULATIVE FREQUENCY AND BOX PLOTS
 Mathematics Revision Guides Histograms, Cumulative Frequency and Box Plots Page 1 of 25 M.K. HOME TUITION Mathematics Revision Guides Level: GCSE Higher Tier HISTOGRAMS, CUMULATIVE FREQUENCY AND BOX PLOTS
business statistics using Excel OXFORD UNIVERSITY PRESS Glyn Davis & Branko Pecar
 business statistics using Excel Glyn Davis & Branko Pecar OXFORD UNIVERSITY PRESS Detailed contents Introduction to Microsoft Excel 2003 Overview Learning Objectives 1.1 Introduction to Microsoft Excel
INDIVIDUAL MASTERY for: St#: 1153366 Test: CH 9 Acceleration Test on 29/07/2015 Grade: B Score: 85.37 % (35.00 of 41.00)
") INDIVIDUAL MASTERY for: St#: 1153366 Grade: B Score: 85.37 % (35.00 of 41.00) INDIVIDUAL MASTERY for: St#: 1346350 Grade: I Score: 21.95 % (9.00 of 41.00) INDIVIDUAL MASTERY for: St#: 1350672 Grade: A
INDIVIDUAL MASTERY for: St#: 1153366 Grade: B Score: 85.37 % (35.00 of 41.00) INDIVIDUAL MASTERY for: St#: 1346350 Grade: I Score: 21.95 % (9.00 of 41.00) INDIVIDUAL MASTERY for: St#: 1350672 Grade: A
INDIVIDUAL MASTERY for: St#: 1141027 Test: CH 9 Acceleration Test on 09/06/2015 Grade: A Score: 92.68 % (38.00 of 41.00)
") INDIVIDUAL MASTERY for: St#: 1141027 Grade: A Score: 92.68 % (38.00 of 41.00) INDIVIDUAL MASTERY for: St#: 1172998 Grade: B Score: 85.37 % (35.00 of 41.00) INDIVIDUAL MASTERY for: St#: 1232138 Grade: B
INDIVIDUAL MASTERY for: St#: 1141027 Grade: A Score: 92.68 % (38.00 of 41.00) INDIVIDUAL MASTERY for: St#: 1172998 Grade: B Score: 85.37 % (35.00 of 41.00) INDIVIDUAL MASTERY for: St#: 1232138 Grade: B
Iris Sample Data Set. Basic Visualization Techniques: Charts, Graphs and Maps. Summary Statistics. Frequency and Mode
 Iris Sample Data Set Basic Visualization Techniques: Charts, Graphs and Maps CS598 Information Visualization Spring 2010 Many of the exploratory data techniques are illustrated with the Iris Plant data
How To Check For Differences In The One Way Anova
 MINITAB ASSISTANT WHITE PAPER This paper explains the research conducted by Minitab statisticians to develop the methods and data checks used in the Assistant in Minitab 17 Statistical Software. One-Way
Bill Burton Albert Einstein College of Medicine [email protected] April 28, 2014 EERS: Managing the Tension Between Rigor and Resources 1
 Bill Burton Albert Einstein College of Medicine [email protected] April 28, 2014 EERS: Managing the Tension Between Rigor and Resources 1 Calculate counts, means, and standard deviations Produce
Creating Graphs. Learning Objective-To create graphs that show data.
 Creating Graphs Summary- Key Words- Students will be able to identify graphs, components of graphs, interpret graphs, and construct various types of graphs. Pictograph Bar Graph Circle Graph Background
FOR TEACHERS ONLY. The University of the State of New York REGENTS HIGH SCHOOL EXAMINATION PHYSICAL SETTING/PHYSICS
 FOR TEACHERS ONLY PS P The University of the State of New York REGENTS HIGH SCHOOL EXAMINATION PHYSICAL SETTING/PHYSICS Thursday, June 3, 203 :5 to 4:5 p.m., only SCORING KEY AND RATING GUIDE Directions
1) Write the following as an algebraic expression using x as the variable: Triple a number subtracted from the number
 Write the following as an algebraic expression using x as the variable: Triple a number subtracted from the number") 1) Write the following as an algebraic expression using x as the variable: Triple a number subtracted from the number A. 3(x - x) B. x 3 x C. 3x - x D. x - 3x 2) Write the following as an algebraic expression
1) Write the following as an algebraic expression using x as the variable: Triple a number subtracted from the number A. 3(x - x) B. x 3 x C. 3x - x D. x - 3x 2) Write the following as an algebraic expression
An Introduction to Statistics Course (ECOE 1302) Spring Semester 2011 Chapter 10- TWO-SAMPLE TESTS
 Spring Semester 2011 Chapter 10- TWO-SAMPLE TESTS") The Islamic University of Gaza Faculty of Commerce Department of Economics and Political Sciences An Introduction to Statistics Course (ECOE 130) Spring Semester 011 Chapter 10- TWO-SAMPLE TESTS Practice
The Islamic University of Gaza Faculty of Commerce Department of Economics and Political Sciences An Introduction to Statistics Course (ECOE 130) Spring Semester 011 Chapter 10- TWO-SAMPLE TESTS Practice
UNIVERSITY OF TORONTO SCARBOROUGH Department of Computer and Mathematical Sciences Midterm Test March 2014
 UNIVERSITY OF TORONTO SCARBOROUGH Department of Computer and Mathematical Sciences Midterm Test March 2014 STAB22H3 Statistics I Duration: 1 hour and 45 minutes Last Name: First Name: Student number: Aids
Moraine Valley Community College Course Syllabus
 Moraine Valley Community College Course Syllabus Course Title: Business Statistics Course Number: MTH 212 Semester: Fall 2006 I Faculty Information A. Instructor: Kevin M. Riordan, M.A. B. Office Hours:
The Dummy s Guide to Data Analysis Using SPSS
 The Dummy s Guide to Data Analysis Using SPSS Mathematics 57 Scripps College Amy Gamble April, 2001 Amy Gamble 4/30/01 All Rights Rerserved TABLE OF CONTENTS PAGE Helpful Hints for All Tests...1 Tests
2. Here is a small part of a data set that describes the fuel economy (in miles per gallon) of 2006 model motor vehicles.
 of 2006 model motor vehicles.") Math 1530-017 Exam 1 February 19, 2009 Name Student Number E There are five possible responses to each of the following multiple choice questions. There is only on BEST answer. Be sure to read all possible
Math 1530-017 Exam 1 February 19, 2009 Name Student Number E There are five possible responses to each of the following multiple choice questions. There is only on BEST answer. Be sure to read all possible