EXAM #1 (Example) Instructor: Ela Jackiewicz. Relax and good luck!
|
|
|
- Brook Blake
- 7 years ago
- Views:
Transcription
1 STP 231 EXAM #1 (Example) Instructor: Ela Jackiewicz Honor Statement: I have neither given nor received information regarding this exam, and I will not do so until all exams have been graded and returned. PRINTED NAME: Signed Date: DIRECTIONS: This is a closed book examination. You may use a graphing calculator and one 8x11 page with hand written notes, no completely solved problems are allowed. Turn in the notes with your exam. Formulas and tables are provided on the back of the test. There are 16 questions. For Questions#1 #6 provide complete and well organized answers showing all your work! Answers without supporting work will get no credit. Questions#7 #15 are multiple choice. Select appropriate letter answer (A to E as appropriate) and place your answer in the table provided below. Last problem is for Extra Credit, select True or False for each of 5 parts. Relax and good luck! Use table below to write letter answers (A E as appropriate) to questions 7 15, and circle True or False for Extra Credit Questions A E Question#7 Question#8 Question#9 Question#10 Question#11 Question#12 C C D C B B Question#13 Question#14 Question#15 A C E Extra Credit Questions: A) False B) True C) True D) False E) True

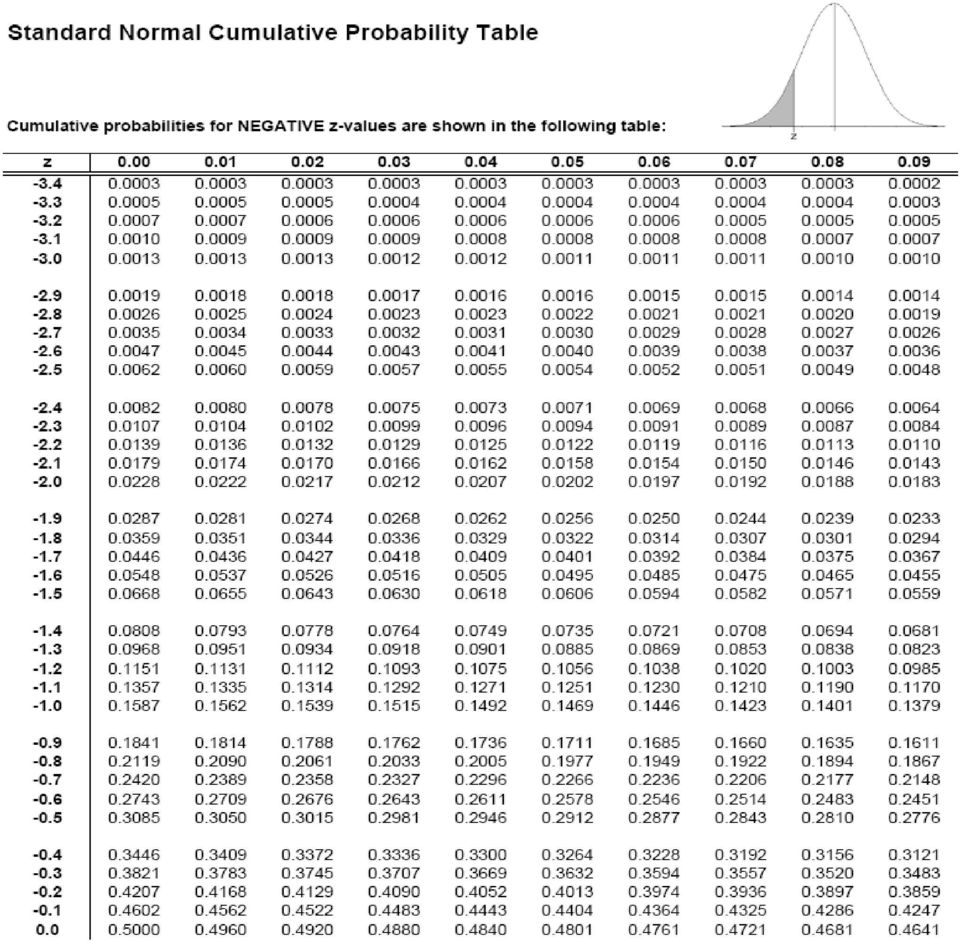
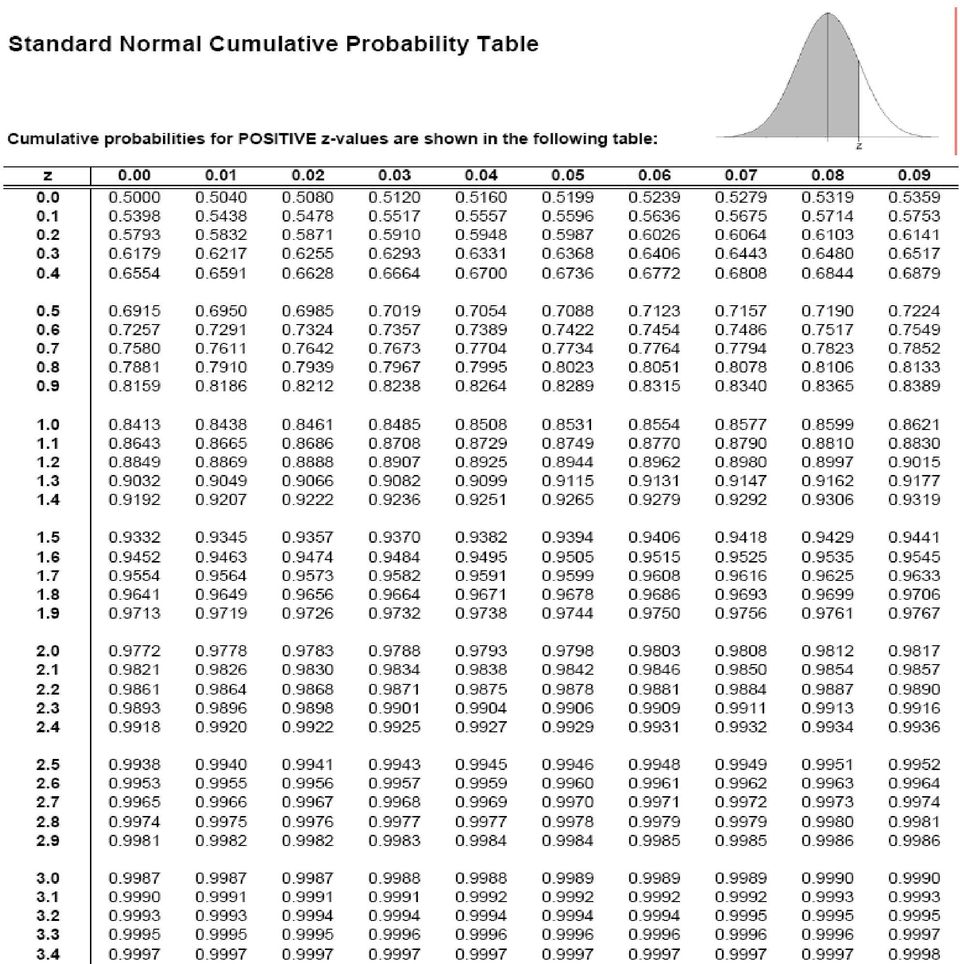
2 Use following information for questions #1 and #2 The IQ test scores for a random sample of 10 fifth grade students are: 96,, 118, 120, 122, 125, 126, 130, 135, 138 Question #1 ( 8 points) Give the 5 number summary of the data (MIN, MAX, Median, Q1 and Q3) and make a box plot. Use a line below to mark a proper scale. MIN= 96 Q1= 118 Median= Q3= 130 MAX= Question #2 (8 points) Check if there are any outliers in the data, by using IQR. List potential outliers, if there are no outliers, state it. Show all work, clearly justify your answer! IQR=12 1.5(12)=18 Lower Fence= =100 Upper fence=130+18= is below lower fence=potential outlier Question #3 (8 points) Use tables to compute 90 th percentile of N(5,2) curve. Clearly show work, include appropriate sketch. Sketch should represent a normal curve centered at 5, y=marked point above 5, You should show that area shaded left of y=90% (0.9) SKETCH: ANSWER: z=1.28, y=5+1.28(2)=7.56

3 Use following information in Questions #4 and #5 The distribution of scores for persons over 16 years of age on the Wechsler Adult Intelligence Scale (WAIS) is approximately normal with mean 100 and standard deviation 19. The WAIS is one of the most common IQ tests for adults. Question#4(8 points)what percentage of the persons over 16 have a WAIS score between 60 and 120? Include appropriate sketch illustrating your answer. Sketch should represent a normal curve centered at 100, y1=60 and y2=120 =marked points below and above 100. You should show that your answer=area shaded between 60 and 120 z1= 2.11 z2= = SKETCH: ANSWER: 83.57% Question#5(8 points) Suppose Y is a WAIS score of a randomly chosen individual over 16, what is the probability P(Y>130)? Include appropriate sketch illustration your answer. Sketch should represent a normal curve centered at 100, y=130 =marked point above 100. You should show that your answer=area shaded above 130. z=1.58 area= SKETCH: ANSWER: Question#6 (6 points)based on a large sample, Average North American newborn is on average 20 inches long with standard deviation of 1.12 inch and has average weight of 7.5 pounds with standard deviation 1.25 pounds. Compute Coefficient of Variation for each measure and use it to answer the following question: Which of the two measures (length or weight) has greater variability? Coefficients of variation: Length 5.6% Weight: 16.7% Weight has greater variability

4 Questions #7 #15, 6 points each, are multiple choice, select a correct response and mark a letter of that response in the table given on the front page. Use the same table to mark T or F responses for Extra Credit Problem #16 Question#7 (6 points) The National Cancer Institute estimates that 3.65% of women in their 60 s get breast cancer. A mammogram can correctly identify 85% of cancer cases (positive test) and 95% of cases without cancer (negative test), which means we get false negative 15% of the time and false positive 5% of the time. Compute probability that randomly selected women in her 60 s will have a positive test for a breast cancer. Round to 2 decimal places A) 0.90 B) 0.85 C) 0.08 D) 0.03 E) none of these Use following information for questions #8 and #9 The probability model for response Y = In the past seven days, how many times did you go to a fitness center to work out? Y=Days Probability Question#8 ( 6 points) Compute the probability P(Y < 3 or Y > 5) A) 0.93 B) 0.96 C) 0.85 D) 0.15 E) none of these Question#9 ( 6 points) Compute mean (expected value ) of a random variable Y, round answer to 2 decimal places A)0.14 B) 1.68 C) 0.21 D) 1.12 E) none of these Use following data for questions #10 and #11 Consider the following stem & leaf diagram of the data it represents. There are 41 observations Data : Mercury Content (in the hair) of Seychelles Fishermen Stems: tens leaves: ones Question#10 ( 6 points) Which of the following best describes the shape of the distribution? Select one. A) Bell shape B) Uniform C) Right skewed D) Bimodal E) Symmetric Question#11 ( 6 points) Compute the median of this data. A) 5 B) 25 C) D) 21 E) none of these
 0.90 B) 0.85 C) 0.08 D) 0.")
5 Use table below for questions #12 #13 The following table summarizes blood types and Rh types for typical people. Suppose one person is randomly selected. Compute following probabilities, round answers to 4 decimal places. Blood Type O A B AB total Rh positive Rh negative total Question #12 ( 6 points) Compute probability that this person does not have blood type B A) 13 B) 97 C) 90 D) none of these Question #13 ( 6 points) Compute probability that that this person has blood type AB or is Rh positive. A) 93 B) 98 C) 5 D) none of these Use following information for questions #14, and #15 9% of men cannot distinguish between the colors red and green. If 8 men are randomly selected for a study of traffic signal perception, compute the following probabilities, round answers to 4 decimal places, if needed. Question #14 ( 6 points) Compute probability that exactly three of the men cannot distinguish between the colors red and green A) 0.09 B) 0.27 C) D) E) Question #15 ( 6 points) Compute probability that at least two of the men cannot distinguish between the colors red and green A) 0.18 B) C) D) E) Extra Credit Questions (5 points) Decide if statements below are true or false A) Sample standard deviation and sample mean are robust measures; they are resistant to outliers. B) Suppose test scores in a large sample of Mat 117 students have nearly bell shaped distribution with mean of 70 points and standard deviation of 10 points. According to Empirical Rule we can expect about 95% of all test scores to be between 50 and 90 points C) If we compare two histograms representing distribution of the same variable in the same scale, wider histogram will indicate higher variability. D) We do not expect any error when we estimate a population parameter from a sample statistics E)It is possible that median of a data set is not an actual observation.
 none of these Question #13 ( 6 points) Compute probability that that this person has blood type AB or is Rh positive.")
6 n y i FORMULAS Sample statistics Sample mean:, Sample standard deviation (definition) y = n Sample variance= s 2 Range=Max Min s = n (y i y ) 2 n 1 Interquartile Range IQR= Q 3 Q 1, Lower Fence =Q1 1.5(IQR), Upper Fence=Q3+1.5(IQR) Coefficient of variation= s y 100% Population parameters: N Population mean: y i μ= N Standard score or z score z = y μ σ Population standard deviation: σ = N ( y i μ) 2 N Random Variables n μ Y = y i P (Y =y i )= y i p i μ Y =np for Binomial Y Probability 0 P E 1 P E c =1 P E P E 1 or E 2 =P E 1 P E 2 P E 1 and E 2 P E 1 and E 2 =P E 1 P E 2 Conditional probability P E 2 / E 1 = P E 1 and E 2 P E 1 for independent events only Binomial Distribution Formula n! P Y =k =C n,k p k 1 p n k, nck=c n,k = n k!k!
= y i p i μ Y =np for Binomial Y Probability 0 P E 1 P E c =1 P E P E 1 or E 2 =P E 1 P E 2 P E 1 and E 2 P E 1 and E 2 =P E 1 P E 2 Conditional")
7
8
Density Curve. A density curve is the graph of a continuous probability distribution. It must satisfy the following properties:
 Density Curve A density curve is the graph of a continuous probability distribution. It must satisfy the following properties: 1. The total area under the curve must equal 1. 2. Every point on the curve
The Normal Distribution
 Chapter 6 The Normal Distribution 6.1 The Normal Distribution 1 6.1.1 Student Learning Objectives By the end of this chapter, the student should be able to: Recognize the normal probability distribution
Exploratory data analysis (Chapter 2) Fall 2011
 Fall 2011") Exploratory data analysis (Chapter 2) Fall 2011 Data Examples Example 1: Survey Data 1 Data collected from a Stat 371 class in Fall 2005 2 They answered questions about their: gender, major, year in school,
Exploratory data analysis (Chapter 2) Fall 2011 Data Examples Example 1: Survey Data 1 Data collected from a Stat 371 class in Fall 2005 2 They answered questions about their: gender, major, year in school,
Descriptive statistics Statistical inference statistical inference, statistical induction and inferential statistics
 Descriptive statistics is the discipline of quantitatively describing the main features of a collection of data. Descriptive statistics are distinguished from inferential statistics (or inductive statistics),
Chapter 1: Looking at Data Section 1.1: Displaying Distributions with Graphs
 Types of Variables Chapter 1: Looking at Data Section 1.1: Displaying Distributions with Graphs Quantitative (numerical)variables: take numerical values for which arithmetic operations make sense (addition/averaging)
Section 1.3 Exercises (Solutions)
") Section 1.3 Exercises (s) 1.109, 1.110, 1.111, 1.114*, 1.115, 1.119*, 1.122, 1.125, 1.127*, 1.128*, 1.131*, 1.133*, 1.135*, 1.137*, 1.139*, 1.145*, 1.146-148. 1.109 Sketch some normal curves. (a) Sketch
Section 1.3 Exercises (s) 1.109, 1.110, 1.111, 1.114*, 1.115, 1.119*, 1.122, 1.125, 1.127*, 1.128*, 1.131*, 1.133*, 1.135*, 1.137*, 1.139*, 1.145*, 1.146-148. 1.109 Sketch some normal curves. (a) Sketch
AP Statistics Solutions to Packet 2
 AP Statistics Solutions to Packet 2 The Normal Distributions Density Curves and the Normal Distribution Standard Normal Calculations HW #9 1, 2, 4, 6-8 2.1 DENSITY CURVES (a) Sketch a density curve that
5/31/2013. 6.1 Normal Distributions. Normal Distributions. Chapter 6. Distribution. The Normal Distribution. Outline. Objectives.
 The Normal Distribution C H 6A P T E R The Normal Distribution Outline 6 1 6 2 Applications of the Normal Distribution 6 3 The Central Limit Theorem 6 4 The Normal Approximation to the Binomial Distribution
MULTIPLE CHOICE. Choose the one alternative that best completes the statement or answers the question.
 STATISTICS/GRACEY PRACTICE TEST/EXAM 2 MULTIPLE CHOICE. Choose the one alternative that best completes the statement or answers the question. Identify the given random variable as being discrete or continuous.
Lecture 1: Review and Exploratory Data Analysis (EDA)
") Lecture 1: Review and Exploratory Data Analysis (EDA) Sandy Eckel seckel@jhsph.edu Department of Biostatistics, The Johns Hopkins University, Baltimore USA 21 April 2008 1 / 40 Course Information I Course
Lecture 1: Review and Exploratory Data Analysis (EDA) Sandy Eckel seckel@jhsph.edu Department of Biostatistics, The Johns Hopkins University, Baltimore USA 21 April 2008 1 / 40 Course Information I Course
consider the number of math classes taken by math 150 students. how can we represent the results in one number?
 ch 3: numerically summarizing data - center, spread, shape 3.1 measure of central tendency or, give me one number that represents all the data consider the number of math classes taken by math 150 students.
4. Continuous Random Variables, the Pareto and Normal Distributions
 4. Continuous Random Variables, the Pareto and Normal Distributions A continuous random variable X can take any value in a given range (e.g. height, weight, age). The distribution of a continuous random
3.2 Measures of Spread
 3.2 Measures of Spread In some data sets the observations are close together, while in others they are more spread out. In addition to measures of the center, it's often important to measure the spread
Descriptive Statistics
 Y520 Robert S Michael Goal: Learn to calculate indicators and construct graphs that summarize and describe a large quantity of values. Using the textbook readings and other resources listed on the web
AP * Statistics Review. Descriptive Statistics
 AP * Statistics Review Descriptive Statistics Teacher Packet Advanced Placement and AP are registered trademark of the College Entrance Examination Board. The College Board was not involved in the production
Exploratory Data Analysis
 Exploratory Data Analysis Johannes Schauer johannes.schauer@tugraz.at Institute of Statistics Graz University of Technology Steyrergasse 17/IV, 8010 Graz www.statistics.tugraz.at February 12, 2008 Introduction
Ch. 3.1 # 3, 4, 7, 30, 31, 32
 Math Elementary Statistics: A Brief Version, 5/e Bluman Ch. 3. # 3, 4,, 30, 3, 3 Find (a) the mean, (b) the median, (c) the mode, and (d) the midrange. 3) High Temperatures The reported high temperatures
MEASURES OF VARIATION
 NORMAL DISTRIBTIONS MEASURES OF VARIATION In statistics, it is important to measure the spread of data. A simple way to measure spread is to find the range. But statisticians want to know if the data are
Probability Distributions
 Learning Objectives Probability Distributions Section 1: How Can We Summarize Possible Outcomes and Their Probabilities? 1. Random variable 2. Probability distributions for discrete random variables 3.
Mind on Statistics. Chapter 2
 Mind on Statistics Chapter 2 Sections 2.1 2.3 1. Tallies and cross-tabulations are used to summarize which of these variable types? A. Quantitative B. Mathematical C. Continuous D. Categorical 2. The table
Key Concept. Density Curve
 MAT 155 Statistical Analysis Dr. Claude Moore Cape Fear Community College Chapter 6 Normal Probability Distributions 6 1 Review and Preview 6 2 The Standard Normal Distribution 6 3 Applications of Normal
Descriptive Statistics. Purpose of descriptive statistics Frequency distributions Measures of central tendency Measures of dispersion
 Descriptive Statistics Purpose of descriptive statistics Frequency distributions Measures of central tendency Measures of dispersion Statistics as a Tool for LIS Research Importance of statistics in research
Topic 9 ~ Measures of Spread
 AP Statistics Topic 9 ~ Measures of Spread Activity 9 : Baseball Lineups The table to the right contains data on the ages of the two teams involved in game of the 200 National League Division Series. Is
c. Construct a boxplot for the data. Write a one sentence interpretation of your graph.
 MBA/MIB 5315 Sample Test Problems Page 1 of 1 1. An English survey of 3000 medical records showed that smokers are more inclined to get depressed than non-smokers. Does this imply that smoking causes depression?
Variables. Exploratory Data Analysis
 Exploratory Data Analysis Exploratory Data Analysis involves both graphical displays of data and numerical summaries of data. A common situation is for a data set to be represented as a matrix. There is
Summary of Formulas and Concepts. Descriptive Statistics (Ch. 1-4)
") Summary of Formulas and Concepts Descriptive Statistics (Ch. 1-4) Definitions Population: The complete set of numerical information on a particular quantity in which an investigator is interested. We assume
Summary of Formulas and Concepts Descriptive Statistics (Ch. 1-4) Definitions Population: The complete set of numerical information on a particular quantity in which an investigator is interested. We assume
Statistics E100 Fall 2013 Practice Midterm I - A Solutions
 STATISTICS E100 FALL 2013 PRACTICE MIDTERM I - A SOLUTIONS PAGE 1 OF 5 Statistics E100 Fall 2013 Practice Midterm I - A Solutions 1. (16 points total) Below is the histogram for the number of medals won
The right edge of the box is the third quartile, Q 3, which is the median of the data values above the median. Maximum Median
 CONDENSED LESSON 2.1 Box Plots In this lesson you will create and interpret box plots for sets of data use the interquartile range (IQR) to identify potential outliers and graph them on a modified box
2. Here is a small part of a data set that describes the fuel economy (in miles per gallon) of 2006 model motor vehicles.
 of 2006 model motor vehicles.") Math 1530-017 Exam 1 February 19, 2009 Name Student Number E There are five possible responses to each of the following multiple choice questions. There is only on BEST answer. Be sure to read all possible
Math 1530-017 Exam 1 February 19, 2009 Name Student Number E There are five possible responses to each of the following multiple choice questions. There is only on BEST answer. Be sure to read all possible
Introduction to Environmental Statistics. The Big Picture. Populations and Samples. Sample Data. Examples of sample data
 A Few Sources for Data Examples Used Introduction to Environmental Statistics Professor Jessica Utts University of California, Irvine jutts@uci.edu 1. Statistical Methods in Water Resources by D.R. Helsel
THE BINOMIAL DISTRIBUTION & PROBABILITY
 REVISION SHEET STATISTICS 1 (MEI) THE BINOMIAL DISTRIBUTION & PROBABILITY The main ideas in this chapter are Probabilities based on selecting or arranging objects Probabilities based on the binomial distribution
First Midterm Exam (MATH1070 Spring 2012)
") First Midterm Exam (MATH1070 Spring 2012) Instructions: This is a one hour exam. You can use a notecard. Calculators are allowed, but other electronics are prohibited. 1. [40pts] Multiple Choice Problems
First Midterm Exam (MATH1070 Spring 2012) Instructions: This is a one hour exam. You can use a notecard. Calculators are allowed, but other electronics are prohibited. 1. [40pts] Multiple Choice Problems
Classify the data as either discrete or continuous. 2) An athlete runs 100 meters in 10.5 seconds. 2) A) Discrete B) Continuous
 An athlete runs 100 meters in 10.5 seconds. 2) A) Discrete B) Continuous") Chapter 2 Overview Name MULTIPLE CHOICE. Choose the one alternative that best completes the statement or answers the question. Classify as categorical or qualitative data. 1) A survey of autos parked in
Chapter 2 Overview Name MULTIPLE CHOICE. Choose the one alternative that best completes the statement or answers the question. Classify as categorical or qualitative data. 1) A survey of autos parked in
AP STATISTICS REVIEW (YMS Chapters 1-8)
") AP STATISTICS REVIEW (YMS Chapters 1-8) Exploring Data (Chapter 1) Categorical Data nominal scale, names e.g. male/female or eye color or breeds of dogs Quantitative Data rational scale (can +,,, with
AP STATISTICS REVIEW (YMS Chapters 1-8) Exploring Data (Chapter 1) Categorical Data nominal scale, names e.g. male/female or eye color or breeds of dogs Quantitative Data rational scale (can +,,, with
Chapter 3. The Normal Distribution
 Chapter 3. The Normal Distribution Topics covered in this chapter: Z-scores Normal Probabilities Normal Percentiles Z-scores Example 3.6: The standard normal table The Problem: What proportion of observations
Center: Finding the Median. Median. Spread: Home on the Range. Center: Finding the Median (cont.)
") Center: Finding the Median When we think of a typical value, we usually look for the center of the distribution. For a unimodal, symmetric distribution, it s easy to find the center it s just the center
Center: Finding the Median When we think of a typical value, we usually look for the center of the distribution. For a unimodal, symmetric distribution, it s easy to find the center it s just the center
MATH 103/GRACEY PRACTICE EXAM/CHAPTERS 2-3. MULTIPLE CHOICE. Choose the one alternative that best completes the statement or answers the question.
 MATH 3/GRACEY PRACTICE EXAM/CHAPTERS 2-3 Name MULTIPLE CHOICE. Choose the one alternative that best completes the statement or answers the question. Provide an appropriate response. 1) The frequency distribution
MULTIPLE CHOICE. Choose the one alternative that best completes the statement or answers the question.
 Final Exam Review MULTIPLE CHOICE. Choose the one alternative that best completes the statement or answers the question. 1) A researcher for an airline interviews all of the passengers on five randomly
6.4 Normal Distribution
 Contents 6.4 Normal Distribution....................... 381 6.4.1 Characteristics of the Normal Distribution....... 381 6.4.2 The Standardized Normal Distribution......... 385 6.4.3 Meaning of Areas under
Normal Distribution. Definition A continuous random variable has a normal distribution if its probability density. f ( y ) = 1.
 = 1.") Normal Distribution Definition A continuous random variable has a normal distribution if its probability density e -(y -µ Y ) 2 2 / 2 σ function can be written as for < y < as Y f ( y ) = 1 σ Y 2 π Notation:
Normal Distribution Definition A continuous random variable has a normal distribution if its probability density e -(y -µ Y ) 2 2 / 2 σ function can be written as for < y < as Y f ( y ) = 1 σ Y 2 π Notation:
Descriptive Statistics
 Descriptive Statistics Suppose following data have been collected (heights of 99 five-year-old boys) 117.9 11.2 112.9 115.9 18. 14.6 17.1 117.9 111.8 16.3 111. 1.4 112.1 19.2 11. 15.4 99.4 11.1 13.3 16.9
MULTIPLE CHOICE. Choose the one alternative that best completes the statement or answers the question. A) 0.4987 B) 0.9987 C) 0.0010 D) 0.
 0.4987 B) 0.9987 C) 0.0010 D) 0.") Ch. 5 Normal Probability Distributions 5.1 Introduction to Normal Distributions and the Standard Normal Distribution 1 Find Areas Under the Standard Normal Curve 1) Find the area under the standard normal
Ch. 5 Normal Probability Distributions 5.1 Introduction to Normal Distributions and the Standard Normal Distribution 1 Find Areas Under the Standard Normal Curve 1) Find the area under the standard normal
6.2 Normal distribution. Standard Normal Distribution:
 6.2 Normal distribution Slide Heights of Adult Men and Women Slide 2 Area= Mean = µ Standard Deviation = σ Donation: X ~ N(µ,σ 2 ) Standard Normal Distribution: Slide 3 Slide 4 a normal probability distribution
Means, standard deviations and. and standard errors
 CHAPTER 4 Means, standard deviations and standard errors 4.1 Introduction Change of units 4.2 Mean, median and mode Coefficient of variation 4.3 Measures of variation 4.4 Calculating the mean and standard
1.3 Measuring Center & Spread, The Five Number Summary & Boxplots. Describing Quantitative Data with Numbers
 1.3 Measuring Center & Spread, The Five Number Summary & Boxplots Describing Quantitative Data with Numbers 1.3 I can n Calculate and interpret measures of center (mean, median) in context. n Calculate
3: Summary Statistics
 3: Summary Statistics Notation Let s start by introducing some notation. Consider the following small data set: 4 5 30 50 8 7 4 5 The symbol n represents the sample size (n = 0). The capital letter X denotes
STT315 Chapter 4 Random Variables & Probability Distributions KM. Chapter 4.5, 6, 8 Probability Distributions for Continuous Random Variables
 Chapter 4.5, 6, 8 Probability Distributions for Continuous Random Variables Discrete vs. continuous random variables Examples of continuous distributions o Uniform o Exponential o Normal Recall: A random
Statistics 100 Sample Final Questions (Note: These are mostly multiple choice, for extra practice. Your Final Exam will NOT have any multiple choice!
 Statistics 100 Sample Final Questions (Note: These are mostly multiple choice, for extra practice. Your Final Exam will NOT have any multiple choice!) Part A - Multiple Choice Indicate the best choice
SOLUTIONS: 4.1 Probability Distributions and 4.2 Binomial Distributions
 SOLUTIONS: 4.1 Probability Distributions and 4.2 Binomial Distributions 1. The following table contains a probability distribution for a random variable X. a. Find the expected value (mean) of X. x 1 2
Def: The standard normal distribution is a normal probability distribution that has a mean of 0 and a standard deviation of 1.
 Lecture 6: Chapter 6: Normal Probability Distributions A normal distribution is a continuous probability distribution for a random variable x. The graph of a normal distribution is called the normal curve.
Exercise 1.12 (Pg. 22-23)
") Individuals: The objects that are described by a set of data. They may be people, animals, things, etc. (Also referred to as Cases or Records) Variables: The characteristics recorded about each individual.
Individuals: The objects that are described by a set of data. They may be people, animals, things, etc. (Also referred to as Cases or Records) Variables: The characteristics recorded about each individual.
Introduction to Statistics for Psychology. Quantitative Methods for Human Sciences
 Introduction to Statistics for Psychology and Quantitative Methods for Human Sciences Jonathan Marchini Course Information There is website devoted to the course at http://www.stats.ox.ac.uk/ marchini/phs.html
8. THE NORMAL DISTRIBUTION
 8. THE NORMAL DISTRIBUTION The normal distribution with mean μ and variance σ 2 has the following density function: The normal distribution is sometimes called a Gaussian Distribution, after its inventor,
STATS8: Introduction to Biostatistics. Data Exploration. Babak Shahbaba Department of Statistics, UCI
 STATS8: Introduction to Biostatistics Data Exploration Babak Shahbaba Department of Statistics, UCI Introduction After clearly defining the scientific problem, selecting a set of representative members
You flip a fair coin four times, what is the probability that you obtain three heads.
 Handout 4: Binomial Distribution Reading Assignment: Chapter 5 In the previous handout, we looked at continuous random variables and calculating probabilities and percentiles for those type of variables.
MAT 155. Key Concept. September 27, 2010. 155S5.5_3 Poisson Probability Distributions. Chapter 5 Probability Distributions
 MAT 155 Dr. Claude Moore Cape Fear Community College Chapter 5 Probability Distributions 5 1 Review and Preview 5 2 Random Variables 5 3 Binomial Probability Distributions 5 4 Mean, Variance and Standard
Foundation of Quantitative Data Analysis
 Foundation of Quantitative Data Analysis Part 1: Data manipulation and descriptive statistics with SPSS/Excel HSRS #10 - October 17, 2013 Reference : A. Aczel, Complete Business Statistics. Chapters 1
Sample Term Test 2A. 1. A variable X has a distribution which is described by the density curve shown below:
 Sample Term Test 2A 1. A variable X has a distribution which is described by the density curve shown below: What proportion of values of X fall between 1 and 6? (A) 0.550 (B) 0.575 (C) 0.600 (D) 0.625
AP STATISTICS 2010 SCORING GUIDELINES
 2010 SCORING GUIDELINES Question 4 Intent of Question The primary goals of this question were to (1) assess students ability to calculate an expected value and a standard deviation; (2) recognize the applicability
table to see that the probability is 0.8413. (b) What is the probability that x is between 16 and 60? The z-scores for 16 and 60 are: 60 38 = 1.
 What is the probability that x is between 16 and 60? The z-scores for 16 and 60 are: 60 38 = 1.") Review Problems for Exam 3 Math 1040 1 1. Find the probability that a standard normal random variable is less than 2.37. Looking up 2.37 on the normal table, we see that the probability is 0.9911. 2. Find
Review Problems for Exam 3 Math 1040 1 1. Find the probability that a standard normal random variable is less than 2.37. Looking up 2.37 on the normal table, we see that the probability is 0.9911. 2. Find
MULTIPLE CHOICE. Choose the one alternative that best completes the statement or answers the question. A) ±1.88 B) ±1.645 C) ±1.96 D) ±2.
 ±1.88 B) ±1.645 C) ±1.96 D) ±2.") Ch. 6 Confidence Intervals 6.1 Confidence Intervals for the Mean (Large Samples) 1 Find a Critical Value 1) Find the critical value zc that corresponds to a 94% confidence level. A) ±1.88 B) ±1.645 C)
Ch. 6 Confidence Intervals 6.1 Confidence Intervals for the Mean (Large Samples) 1 Find a Critical Value 1) Find the critical value zc that corresponds to a 94% confidence level. A) ±1.88 B) ±1.645 C)
MULTIPLE CHOICE. Choose the one alternative that best completes the statement or answers the question. C) (a) 2. (b) 1.5. (c) 0.5-2.
 (a) 2. (b) 1.5. (c) 0.5-2.") Stats: Test 1 Review Name MULTIPLE CHOICE. Choose the one alternative that best completes the statement or answers the question. Use the given frequency distribution to find the (a) class width. (b) class
Stats: Test 1 Review Name MULTIPLE CHOICE. Choose the one alternative that best completes the statement or answers the question. Use the given frequency distribution to find the (a) class width. (b) class
Biostatistics: DESCRIPTIVE STATISTICS: 2, VARIABILITY
 Biostatistics: DESCRIPTIVE STATISTICS: 2, VARIABILITY 1. Introduction Besides arriving at an appropriate expression of an average or consensus value for observations of a population, it is important to
Mathematics (Project Maths Phase 1)
") 2012. M128 S Coimisiún na Scrúduithe Stáit State Examinations Commission Leaving Certificate Examination, 2012 Sample Paper Mathematics (Project Maths Phase 1) Paper 2 Ordinary Level Time: 2 hours, 30
2012. M128 S Coimisiún na Scrúduithe Stáit State Examinations Commission Leaving Certificate Examination, 2012 Sample Paper Mathematics (Project Maths Phase 1) Paper 2 Ordinary Level Time: 2 hours, 30
Lesson 20. Probability and Cumulative Distribution Functions
 Lesson 20 Probability and Cumulative Distribution Functions Recall If p(x) is a density function for some characteristic of a population, then Recall If p(x) is a density function for some characteristic
Name Please Print MULTIPLE CHOICE. Choose the one alternative that best completes the statement or answers the question.
 Review Problems for Mid-Term 1, Fall 2012 (STA-120 Cal.Poly. Pomona) Name Please Print MULTIPLE CHOICE. Choose the one alternative that best completes the statement or answers the question. Determine whether
Midterm Review Problems
 Midterm Review Problems October 19, 2013 1. Consider the following research title: Cooperation among nursery school children under two types of instruction. In this study, what is the independent variable?
Statistics 2014 Scoring Guidelines
 AP Statistics 2014 Scoring Guidelines College Board, Advanced Placement Program, AP, AP Central, and the acorn logo are registered trademarks of the College Board. AP Central is the official online home
Lecture 2. Summarizing the Sample
 Lecture 2 Summarizing the Sample WARNING: Today s lecture may bore some of you It s (sort of) not my fault I m required to teach you about what we re going to cover today. I ll try to make it as exciting
Normal and Binomial. Distributions
 Normal and Binomial Distributions Library, Teaching and Learning 14 By now, you know about averages means in particular and are familiar with words like data, standard deviation, variance, probability,
The Normal Distribution
 The Normal Distribution Continuous Distributions A continuous random variable is a variable whose possible values form some interval of numbers. Typically, a continuous variable involves a measurement
6 3 The Standard Normal Distribution
 290 Chapter 6 The Normal Distribution Figure 6 5 Areas Under a Normal Distribution Curve 34.13% 34.13% 2.28% 13.59% 13.59% 2.28% 3 2 1 + 1 + 2 + 3 About 68% About 95% About 99.7% 6 3 The Distribution Since
STAT 350 Practice Final Exam Solution (Spring 2015)
") PART 1: Multiple Choice Questions: 1) A study was conducted to compare five different training programs for improving endurance. Forty subjects were randomly divided into five groups of eight subjects
PART 1: Multiple Choice Questions: 1) A study was conducted to compare five different training programs for improving endurance. Forty subjects were randomly divided into five groups of eight subjects
Describing, Exploring, and Comparing Data
 24 Chapter 2. Describing, Exploring, and Comparing Data Chapter 2. Describing, Exploring, and Comparing Data There are many tools used in Statistics to visualize, summarize, and describe data. This chapter
Practice#1(chapter1,2) Name
 Name") Practice#1(chapter1,2) Name Solve the problem. 1) The average age of the students in a statistics class is 22 years. Does this statement describe descriptive or inferential statistics? A) inferential statistics
Practice#1(chapter1,2) Name Solve the problem. 1) The average age of the students in a statistics class is 22 years. Does this statement describe descriptive or inferential statistics? A) inferential statistics
Sta 309 (Statistics And Probability for Engineers)
") Instructor: Prof. Mike Nasab Sta 309 (Statistics And Probability for Engineers) Chapter 2 Organizing and Summarizing Data Raw Data: When data are collected in original form, they are called raw data. The
Instructor: Prof. Mike Nasab Sta 309 (Statistics And Probability for Engineers) Chapter 2 Organizing and Summarizing Data Raw Data: When data are collected in original form, they are called raw data. The
STAT 200 QUIZ 2 Solutions Section 6380 Fall 2013
 STAT 200 QUIZ 2 Solutions Section 6380 Fall 2013 The quiz covers Chapters 4, 5 and 6. 1. (8 points) If the IQ scores are normally distributed with a mean of 100 and a standard deviation of 15. (a) (3 pts)
a. mean b. interquartile range c. range d. median
 3. Since 4. The HOMEWORK 3 Due: Feb.3 1. A set of data are put in numerical order, and a statistic is calculated that divides the data set into two equal parts with one part below it and the other part
Week 3&4: Z tables and the Sampling Distribution of X
 Week 3&4: Z tables and the Sampling Distribution of X 2 / 36 The Standard Normal Distribution, or Z Distribution, is the distribution of a random variable, Z N(0, 1 2 ). The distribution of any other normal
Solutions to Homework 6 Statistics 302 Professor Larget
 s to Homework 6 Statistics 302 Professor Larget Textbook Exercises 5.29 (Graded for Completeness) What Proportion Have College Degrees? According to the US Census Bureau, about 27.5% of US adults over
Business Statistics. Successful completion of Introductory and/or Intermediate Algebra courses is recommended before taking Business Statistics.
 Business Course Text Bowerman, Bruce L., Richard T. O'Connell, J. B. Orris, and Dawn C. Porter. Essentials of Business, 2nd edition, McGraw-Hill/Irwin, 2008, ISBN: 978-0-07-331988-9. Required Computing
Correlation Coefficient The correlation coefficient is a summary statistic that describes the linear relationship between two numerical variables 2
 Lesson 4 Part 1 Relationships between two numerical variables 1 Correlation Coefficient The correlation coefficient is a summary statistic that describes the linear relationship between two numerical variables
Statistics. Measurement. Scales of Measurement 7/18/2012
 Statistics Measurement Measurement is defined as a set of rules for assigning numbers to represent objects, traits, attributes, or behaviors A variableis something that varies (eye color), a constant does
Mathematics (Project Maths)
") 2010. M130 S Coimisiún na Scrúduithe Stáit State Examinations Commission Leaving Certificate Examination Sample Paper Mathematics (Project Maths) Paper 2 Higher Level Time: 2 hours, 30 minutes 300 marks
2010. M130 S Coimisiún na Scrúduithe Stáit State Examinations Commission Leaving Certificate Examination Sample Paper Mathematics (Project Maths) Paper 2 Higher Level Time: 2 hours, 30 minutes 300 marks
UNIVERSITY OF TORONTO SCARBOROUGH Department of Computer and Mathematical Sciences Midterm Test March 2014
 UNIVERSITY OF TORONTO SCARBOROUGH Department of Computer and Mathematical Sciences Midterm Test March 2014 STAB22H3 Statistics I Duration: 1 hour and 45 minutes Last Name: First Name: Student number: Aids
Diagrams and Graphs of Statistical Data
 Diagrams and Graphs of Statistical Data One of the most effective and interesting alternative way in which a statistical data may be presented is through diagrams and graphs. There are several ways in
Chapter 7 Section 1 Homework Set A
 Chapter 7 Section 1 Homework Set A 7.15 Finding the critical value t *. What critical value t * from Table D (use software, go to the web and type t distribution applet) should be used to calculate the
Dongfeng Li. Autumn 2010
 Autumn 2010 Chapter Contents Some statistics background; ; Comparing means and proportions; variance. Students should master the basic concepts, descriptive statistics measures and graphs, basic hypothesis
Chapter 4. Probability and Probability Distributions
 Chapter 4. robability and robability Distributions Importance of Knowing robability To know whether a sample is not identical to the population from which it was selected, it is necessary to assess the
MBA 611 STATISTICS AND QUANTITATIVE METHODS
 MBA 611 STATISTICS AND QUANTITATIVE METHODS Part I. Review of Basic Statistics (Chapters 1-11) A. Introduction (Chapter 1) Uncertainty: Decisions are often based on incomplete information from uncertain
1 Nonparametric Statistics
 1 Nonparametric Statistics When finding confidence intervals or conducting tests so far, we always described the population with a model, which includes a set of parameters. Then we could make decisions
CALCULATIONS & STATISTICS
 CALCULATIONS & STATISTICS CALCULATION OF SCORES Conversion of 1-5 scale to 0-100 scores When you look at your report, you will notice that the scores are reported on a 0-100 scale, even though respondents
ELEMENTARY STATISTICS
 ELEMENTARY STATISTICS Study Guide Dr. Shinemin Lin Table of Contents 1. Introduction to Statistics. Descriptive Statistics 3. Probabilities and Standard Normal Distribution 4. Estimates and Sample Sizes
SKEWNESS. Measure of Dispersion tells us about the variation of the data set. Skewness tells us about the direction of variation of the data set.
 SKEWNESS All about Skewness: Aim Definition Types of Skewness Measure of Skewness Example A fundamental task in many statistical analyses is to characterize the location and variability of a data set.
The Binomial Probability Distribution
 The Binomial Probability Distribution MATH 130, Elements of Statistics I J. Robert Buchanan Department of Mathematics Fall 2015 Objectives After this lesson we will be able to: determine whether a probability
TEACHER NOTES MATH NSPIRED
 Math Objectives Students will understand that normal distributions can be used to approximate binomial distributions whenever both np and n(1 p) are sufficiently large. Students will understand that when
Lesson 4 Measures of Central Tendency
 Outline Measures of a distribution s shape -modality and skewness -the normal distribution Measures of central tendency -mean, median, and mode Skewness and Central Tendency Lesson 4 Measures of Central
Algebra II EOC Practice Test
 Algebra II EOC Practice Test Name Date 1. Suppose point A is on the unit circle shown above. What is the value of sin? (A) 0.736 (B) 0.677 (C) (D) (E) none of these 2. Convert to radians. (A) (B) (C) (D)
Chapter 4. iclicker Question 4.4 Pre-lecture. Part 2. Binomial Distribution. J.C. Wang. iclicker Question 4.4 Pre-lecture
 Chapter 4 Part 2. Binomial Distribution J.C. Wang iclicker Question 4.4 Pre-lecture iclicker Question 4.4 Pre-lecture Outline Computing Binomial Probabilities Properties of a Binomial Distribution Computing
Course Text. Required Computing Software. Course Description. Course Objectives. StraighterLine. Business Statistics
 Course Text Business Statistics Lind, Douglas A., Marchal, William A. and Samuel A. Wathen. Basic Statistics for Business and Economics, 7th edition, McGraw-Hill/Irwin, 2010, ISBN: 9780077384470 [This