z-scores AND THE NORMAL CURVE MODEL
|
|
|
- April Crawford
- 7 years ago
- Views:
Transcription
1 z-scores AND THE NORMAL CURVE MODEL 1

2 Understanding z-scores 2
3 z-scores A z-score is a location on the distribution. A z- score also automatically communicates the raw score s distance from the mean A z-score describes a raw score s location in terms of how far above or below the mean it is when measured in standard deviations 3

4 z-score Formula The formula for computing a z-score for a raw score in a sample is: 4

5 z-score Formula The formula for computing a z-score for a raw score in a population is: z = X μ σ X 5

6 Example 1 In a sample with a sample mean of 25 and a standard deviation of 5, calculate the z-score for the raw score 32. 6

7 Example 2 In a sample with a sample mean of 50 and a standard deviation of 10, calculate the z-score for the raw score 44. 7

8 Example 3 In a population with a mean of 100 and a standard deviation of 16, calculate the z-score for the raw score

9 Computing a Raw Score When a z-score is known, this information can be used to calculate the original raw score. The formula for this is X= (z)(s )+X bar x 9
(s )+X")
10 Computing a Raw Score When a z-score is known, this information can be used to calculate the original raw score. The formula for this is X = (z)( z σ ) + X μ 10
( z σ )")
11 Example 4 In a sample with a sample mean of 25 and a standard deviation of 5, calculate the raw score for z=

12 Example 5 In a sample with a sample mean of 50 and a standard deviation of 10, calculate the raw score for z=

13 Example 6 In a population with a mean of 100 and a standard deviation of 16, calculate the raw score for z=

14 Interpreting z-scores Using the z-distribution 14
15 A z-distribution A z-distribution is the distribution produced by transforming all raw scores in the data into z- scores. 15

16 z-distribution of Attractiveness Scores 16

17 Characteristics of the z-distribution 1. A z-distribution always has the same shape as the raw score distribution 2. The mean of any z-distribution t ib ti always equals 0 3. The standard deviation of any z-distribution t ib ti always equals 1 17

18 Relative Frequency Relative frequency can be computed using the proportion of the total area under the curve. The relative frequency of a particular z-score will be the same on all normal z-distributions. 18

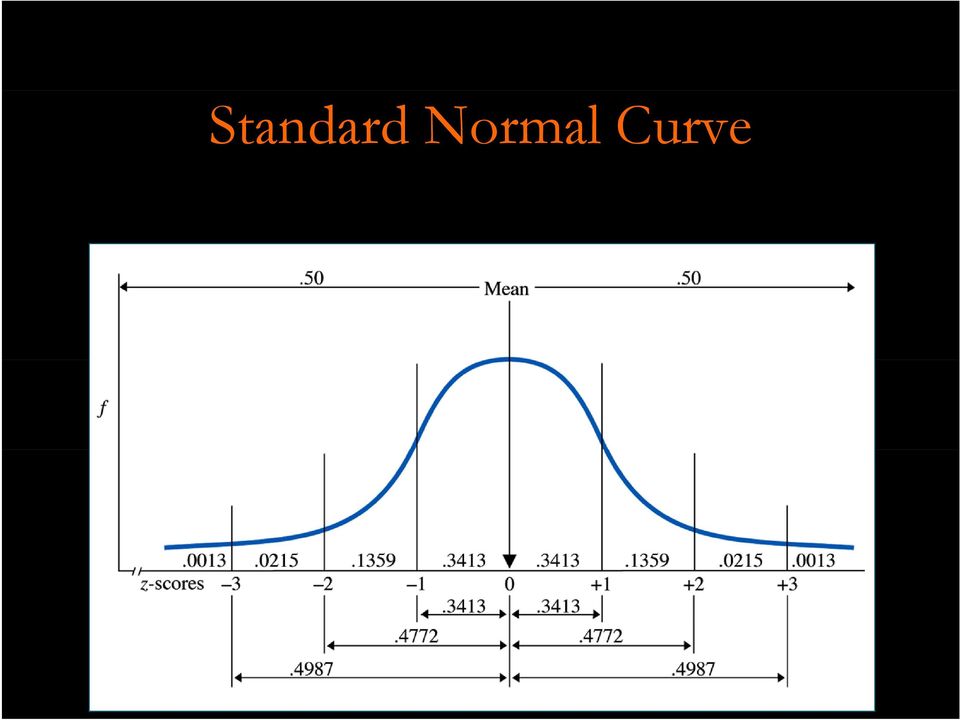
19 The Standard Normal Curve The standard normal curve is a perfect normal z-distribution that serves as our model of the z-distribution ib i that would result from any approximately normal raw score distribution 19

20 Standard Normal Curve 20
21 Uses of the Standard Normal Curve Calculate relative frequency of a score Calculate simple frequency of a score Calculate percentile of a score Cl Calculate l a raw score at a certain percentile 21
22 Proportions of the Standard Normal Curve 22
23 Example 7 In a sample with a sample mean of 40 and a standard deviation of 4, find the relative frequency of the scores above
24 Example 8 In a sample with a sample mean of 40 and a standard ddeviation i of 4, find the percentile of the score
25 Example 9 In a sample with a sample mean of 65 and a standard deviation of 12, and sample size of 1000, What is the relative frequency of scores below 59? How many scores are between the mean and 70? Which raw score signifies the top 3%? 25
26 Using z-scores to Describe Sample Means 26
27 Sampling Distribution of Means A distribution which shows all possible sample means that occur when an infinite number of samples of the same size N are randomly selected from one raw score population. p 27
28 Central Limit Theorem The central limit theorem tells us the sampling distribution of means 1. forms an approximately normal distribution, 2. has a μ equal to the μ of the underlying raw score population, and 3. has a standard deviation that is mathematically related to the standard deviation of the raw score population. 28
29 Standard Error of the Mean The standard deviation of the sampling distribution of means is called the standard error of the mean. The formula for the true standard error of the mean is σ = X σ X N 29
30 z-score Formula for a Sample Mean The formula for computing a z-score for a sample mean is z = X σ X μ 30
31 Example 10 If X = 13, N = 18, μ = 12, and σ = 2.5, X what is the z-score for this sample mean? 31
32 Example 11 On a test the population mean is 100, population standard deviation is 16 and our sample size is 64. What proportion p of sample means will be above 103? 32
33 Example 12 In a sample with a sample mean of 150 and a standard deviation of 20, and sample size of 1000, What is the proportion of scores below 100? What is the proportion of scores above 170? How many scores are between the mean and 160? Which raw score signifies the top 8%? 33
8. THE NORMAL DISTRIBUTION
 8. THE NORMAL DISTRIBUTION The normal distribution with mean μ and variance σ 2 has the following density function: The normal distribution is sometimes called a Gaussian Distribution, after its inventor,
Density Curve. A density curve is the graph of a continuous probability distribution. It must satisfy the following properties:
 Density Curve A density curve is the graph of a continuous probability distribution. It must satisfy the following properties: 1. The total area under the curve must equal 1. 2. Every point on the curve
The Normal Distribution
 Chapter 6 The Normal Distribution 6.1 The Normal Distribution 1 6.1.1 Student Learning Objectives By the end of this chapter, the student should be able to: Recognize the normal probability distribution
Lecture 2: Discrete Distributions, Normal Distributions. Chapter 1
 Lecture 2: Discrete Distributions, Normal Distributions Chapter 1 Reminders Course website: www. stat.purdue.edu/~xuanyaoh/stat350 Office Hour: Mon 3:30-4:30, Wed 4-5 Bring a calculator, and copy Tables
Lesson 7 Z-Scores and Probability
 Lesson 7 Z-Scores and Probability Outline Introduction Areas Under the Normal Curve Using the Z-table Converting Z-score to area -area less than z/area greater than z/area between two z-values Converting
Study Guide for the Final Exam
 Study Guide for the Final Exam When studying, remember that the computational portion of the exam will only involve new material (covered after the second midterm), that material from Exam 1 will make
6.2 Normal distribution. Standard Normal Distribution:
 6.2 Normal distribution Slide Heights of Adult Men and Women Slide 2 Area= Mean = µ Standard Deviation = σ Donation: X ~ N(µ,σ 2 ) Standard Normal Distribution: Slide 3 Slide 4 a normal probability distribution
DESCRIPTIVE STATISTICS. The purpose of statistics is to condense raw data to make it easier to answer specific questions; test hypotheses.
 DESCRIPTIVE STATISTICS The purpose of statistics is to condense raw data to make it easier to answer specific questions; test hypotheses. DESCRIPTIVE VS. INFERENTIAL STATISTICS Descriptive To organize,
STT315 Chapter 4 Random Variables & Probability Distributions KM. Chapter 4.5, 6, 8 Probability Distributions for Continuous Random Variables
 Chapter 4.5, 6, 8 Probability Distributions for Continuous Random Variables Discrete vs. continuous random variables Examples of continuous distributions o Uniform o Exponential o Normal Recall: A random
Chapter 4. Probability and Probability Distributions
 Chapter 4. robability and robability Distributions Importance of Knowing robability To know whether a sample is not identical to the population from which it was selected, it is necessary to assess the
6.4 Normal Distribution
 Contents 6.4 Normal Distribution....................... 381 6.4.1 Characteristics of the Normal Distribution....... 381 6.4.2 The Standardized Normal Distribution......... 385 6.4.3 Meaning of Areas under
Key Concept. Density Curve
 MAT 155 Statistical Analysis Dr. Claude Moore Cape Fear Community College Chapter 6 Normal Probability Distributions 6 1 Review and Preview 6 2 The Standard Normal Distribution 6 3 Applications of Normal
consider the number of math classes taken by math 150 students. how can we represent the results in one number?
 ch 3: numerically summarizing data - center, spread, shape 3.1 measure of central tendency or, give me one number that represents all the data consider the number of math classes taken by math 150 students.
Section 7.1. Introduction to Hypothesis Testing. Schrodinger s cat quantum mechanics thought experiment (1935)
") Section 7.1 Introduction to Hypothesis Testing Schrodinger s cat quantum mechanics thought experiment (1935) Statistical Hypotheses A statistical hypothesis is a claim about a population. Null hypothesis
Section 7.1 Introduction to Hypothesis Testing Schrodinger s cat quantum mechanics thought experiment (1935) Statistical Hypotheses A statistical hypothesis is a claim about a population. Null hypothesis
Def: The standard normal distribution is a normal probability distribution that has a mean of 0 and a standard deviation of 1.
 Lecture 6: Chapter 6: Normal Probability Distributions A normal distribution is a continuous probability distribution for a random variable x. The graph of a normal distribution is called the normal curve.
Z - Scores. Why is this Important?
 Z - Scores Why is this Important? How do you compare apples and oranges? Are you as good a student of French as you are in Physics? How many people did better than you on a test? How many did worse? Are
Chapter 3. The Normal Distribution
 Chapter 3. The Normal Distribution Topics covered in this chapter: Z-scores Normal Probabilities Normal Percentiles Z-scores Example 3.6: The standard normal table The Problem: What proportion of observations
STA-201-TE. 5. Measures of relationship: correlation (5%) Correlation coefficient; Pearson r; correlation and causation; proportion of common variance
 Correlation coefficient; Pearson r; correlation and causation; proportion of common variance") Principles of Statistics STA-201-TE This TECEP is an introduction to descriptive and inferential statistics. Topics include: measures of central tendency, variability, correlation, regression, hypothesis
Principles of Statistics STA-201-TE This TECEP is an introduction to descriptive and inferential statistics. Topics include: measures of central tendency, variability, correlation, regression, hypothesis
AP Statistics Solutions to Packet 2
 AP Statistics Solutions to Packet 2 The Normal Distributions Density Curves and the Normal Distribution Standard Normal Calculations HW #9 1, 2, 4, 6-8 2.1 DENSITY CURVES (a) Sketch a density curve that
Chapter 5: Normal Probability Distributions - Solutions
 Chapter 5: Normal Probability Distributions - Solutions Note: All areas and z-scores are approximate. Your answers may vary slightly. 5.2 Normal Distributions: Finding Probabilities If you are given that
Statistics. Measurement. Scales of Measurement 7/18/2012
 Statistics Measurement Measurement is defined as a set of rules for assigning numbers to represent objects, traits, attributes, or behaviors A variableis something that varies (eye color), a constant does
Statistics I for QBIC. Contents and Objectives. Chapters 1 7. Revised: August 2013
 Statistics I for QBIC Text Book: Biostatistics, 10 th edition, by Daniel & Cross Contents and Objectives Chapters 1 7 Revised: August 2013 Chapter 1: Nature of Statistics (sections 1.1-1.6) Objectives
WISE Sampling Distribution of the Mean Tutorial
 Name Date Class WISE Sampling Distribution of the Mean Tutorial Exercise 1: How accurate is a sample mean? Overview A friend of yours developed a scale to measure Life Satisfaction. For the population
AP STATISTICS 2010 SCORING GUIDELINES
 2010 SCORING GUIDELINES Question 4 Intent of Question The primary goals of this question were to (1) assess students ability to calculate an expected value and a standard deviation; (2) recognize the applicability
MATH 10: Elementary Statistics and Probability Chapter 7: The Central Limit Theorem
 MATH 10: Elementary Statistics and Probability Chapter 7: The Central Limit Theorem Tony Pourmohamad Department of Mathematics De Anza College Spring 2015 Objectives By the end of this set of slides, you
Descriptive Statistics and Measurement Scales
 Descriptive Statistics 1 Descriptive Statistics and Measurement Scales Descriptive statistics are used to describe the basic features of the data in a study. They provide simple summaries about the sample
Measures of Central Tendency and Variability: Summarizing your Data for Others
 Measures of Central Tendency and Variability: Summarizing your Data for Others 1 I. Measures of Central Tendency: -Allow us to summarize an entire data set with a single value (the midpoint). 1. Mode :
TImath.com. Statistics. Areas in Intervals
 Areas in Intervals ID: 9472 TImath.com Time required 30 minutes Activity Overview In this activity, students use several methods to determine the probability of a given normally distributed value being
6 3 The Standard Normal Distribution
 290 Chapter 6 The Normal Distribution Figure 6 5 Areas Under a Normal Distribution Curve 34.13% 34.13% 2.28% 13.59% 13.59% 2.28% 3 2 1 + 1 + 2 + 3 About 68% About 95% About 99.7% 6 3 The Distribution Since
CALCULATIONS & STATISTICS
 CALCULATIONS & STATISTICS CALCULATION OF SCORES Conversion of 1-5 scale to 0-100 scores When you look at your report, you will notice that the scores are reported on a 0-100 scale, even though respondents
People have thought about, and defined, probability in different ways. important to note the consequences of the definition:
 PROBABILITY AND LIKELIHOOD, A BRIEF INTRODUCTION IN SUPPORT OF A COURSE ON MOLECULAR EVOLUTION (BIOL 3046) Probability The subject of PROBABILITY is a branch of mathematics dedicated to building models
5/31/2013. 6.1 Normal Distributions. Normal Distributions. Chapter 6. Distribution. The Normal Distribution. Outline. Objectives.
 The Normal Distribution C H 6A P T E R The Normal Distribution Outline 6 1 6 2 Applications of the Normal Distribution 6 3 The Central Limit Theorem 6 4 The Normal Approximation to the Binomial Distribution
Descriptive Statistics
 Descriptive Statistics Primer Descriptive statistics Central tendency Variation Relative position Relationships Calculating descriptive statistics Descriptive Statistics Purpose to describe or summarize
Hypothesis Testing: Two Means, Paired Data, Two Proportions
 Chapter 10 Hypothesis Testing: Two Means, Paired Data, Two Proportions 10.1 Hypothesis Testing: Two Population Means and Two Population Proportions 1 10.1.1 Student Learning Objectives By the end of this
Normal Distribution. Definition A continuous random variable has a normal distribution if its probability density. f ( y ) = 1.
 = 1.") Normal Distribution Definition A continuous random variable has a normal distribution if its probability density e -(y -µ Y ) 2 2 / 2 σ function can be written as for < y < as Y f ( y ) = 1 σ Y 2 π Notation:
Normal Distribution Definition A continuous random variable has a normal distribution if its probability density e -(y -µ Y ) 2 2 / 2 σ function can be written as for < y < as Y f ( y ) = 1 σ Y 2 π Notation:
Introduction to Hypothesis Testing. Hypothesis Testing. Step 1: State the Hypotheses
 Introduction to Hypothesis Testing 1 Hypothesis Testing A hypothesis test is a statistical procedure that uses sample data to evaluate a hypothesis about a population Hypothesis is stated in terms of the
7. Normal Distributions
 7. Normal Distributions A. Introduction B. History C. Areas of Normal Distributions D. Standard Normal E. Exercises Most of the statistical analyses presented in this book are based on the bell-shaped
CHAPTER 7 INTRODUCTION TO SAMPLING DISTRIBUTIONS
 CHAPTER 7 INTRODUCTION TO SAMPLING DISTRIBUTIONS CENTRAL LIMIT THEOREM (SECTION 7.2 OF UNDERSTANDABLE STATISTICS) The Central Limit Theorem says that if x is a random variable with any distribution having
Chapter 9 Monté Carlo Simulation
 MGS 3100 Business Analysis Chapter 9 Monté Carlo What Is? A model/process used to duplicate or mimic the real system Types of Models Physical simulation Computer simulation When to Use (Computer) Models?
Interpreting Data in Normal Distributions
 Interpreting Data in Normal Distributions This curve is kind of a big deal. It shows the distribution of a set of test scores, the results of rolling a die a million times, the heights of people on Earth,
Means, standard deviations and. and standard errors
 CHAPTER 4 Means, standard deviations and standard errors 4.1 Introduction Change of units 4.2 Mean, median and mode Coefficient of variation 4.3 Measures of variation 4.4 Calculating the mean and standard
MULTIPLE CHOICE. Choose the one alternative that best completes the statement or answers the question. A) 0.4987 B) 0.9987 C) 0.0010 D) 0.
 0.4987 B) 0.9987 C) 0.0010 D) 0.") Ch. 5 Normal Probability Distributions 5.1 Introduction to Normal Distributions and the Standard Normal Distribution 1 Find Areas Under the Standard Normal Curve 1) Find the area under the standard normal
Ch. 5 Normal Probability Distributions 5.1 Introduction to Normal Distributions and the Standard Normal Distribution 1 Find Areas Under the Standard Normal Curve 1) Find the area under the standard normal
The right edge of the box is the third quartile, Q 3, which is the median of the data values above the median. Maximum Median
 CONDENSED LESSON 2.1 Box Plots In this lesson you will create and interpret box plots for sets of data use the interquartile range (IQR) to identify potential outliers and graph them on a modified box
Lecture 19: Chapter 8, Section 1 Sampling Distributions: Proportions
 Lecture 19: Chapter 8, Section 1 Sampling Distributions: Proportions Typical Inference Problem Definition of Sampling Distribution 3 Approaches to Understanding Sampling Dist. Applying 68-95-99.7 Rule
Chapter 1: Looking at Data Section 1.1: Displaying Distributions with Graphs
 Types of Variables Chapter 1: Looking at Data Section 1.1: Displaying Distributions with Graphs Quantitative (numerical)variables: take numerical values for which arithmetic operations make sense (addition/averaging)
Probability. Distribution. Outline
 7 The Normal Probability Distribution Outline 7.1 Properties of the Normal Distribution 7.2 The Standard Normal Distribution 7.3 Applications of the Normal Distribution 7.4 Assessing Normality 7.5 The
5.1 Identifying the Target Parameter
 University of California, Davis Department of Statistics Summer Session II Statistics 13 August 20, 2012 Date of latest update: August 20 Lecture 5: Estimation with Confidence intervals 5.1 Identifying
Normal distribution. ) 2 /2σ. 2π σ
 2 /2σ. 2π σ") Normal distribution The normal distribution is the most widely known and used of all distributions. Because the normal distribution approximates many natural phenomena so well, it has developed into a
Normal distribution The normal distribution is the most widely known and used of all distributions. Because the normal distribution approximates many natural phenomena so well, it has developed into a
Information Technology Services will be updating the mark sense test scoring hardware and software on Monday, May 18, 2015. We will continue to score
 Information Technology Services will be updating the mark sense test scoring hardware and software on Monday, May 18, 2015. We will continue to score all Spring term exams utilizing the current hardware
MATH 10: Elementary Statistics and Probability Chapter 5: Continuous Random Variables
 MATH 10: Elementary Statistics and Probability Chapter 5: Continuous Random Variables Tony Pourmohamad Department of Mathematics De Anza College Spring 2015 Objectives By the end of this set of slides,
Raw Score to Scaled Score Conversions
 Jon S Twing, PhD Vice President, Psychometric Services NCS Pearson - Iowa City Slide 1 of 22 Personal Background Doctorate in Educational Measurement and Statistics, University of Iowa Responsible for
MULTIPLE CHOICE. Choose the one alternative that best completes the statement or answers the question.
 Final Exam Review MULTIPLE CHOICE. Choose the one alternative that best completes the statement or answers the question. 1) A researcher for an airline interviews all of the passengers on five randomly
Lesson 4 Measures of Central Tendency
 Outline Measures of a distribution s shape -modality and skewness -the normal distribution Measures of central tendency -mean, median, and mode Skewness and Central Tendency Lesson 4 Measures of Central
Math 201: Statistics November 30, 2006
 Math 201: Statistics November 30, 2006 Fall 2006 MidTerm #2 Closed book & notes; only an A4-size formula sheet and a calculator allowed; 90 mins. No questions accepted! Instructions: There are eleven pages
Pr(X = x) = f(x) = λe λx
 = f(x) = λe λx") Old Business - variance/std. dev. of binomial distribution - mid-term (day, policies) - class strategies (problems, etc.) - exponential distributions New Business - Central Limit Theorem, standard error
Old Business - variance/std. dev. of binomial distribution - mid-term (day, policies) - class strategies (problems, etc.) - exponential distributions New Business - Central Limit Theorem, standard error
Week 3&4: Z tables and the Sampling Distribution of X
 Week 3&4: Z tables and the Sampling Distribution of X 2 / 36 The Standard Normal Distribution, or Z Distribution, is the distribution of a random variable, Z N(0, 1 2 ). The distribution of any other normal
Statistical Data analysis With Excel For HSMG.632 students
 1 Statistical Data analysis With Excel For HSMG.632 students Dialog Boxes Descriptive Statistics with Excel To find a single descriptive value of a data set such as mean, median, mode or the standard deviation,
The Normal Distribution
 The Normal Distribution Continuous Distributions A continuous random variable is a variable whose possible values form some interval of numbers. Typically, a continuous variable involves a measurement
2. Filling Data Gaps, Data validation & Descriptive Statistics
 2. Filling Data Gaps, Data validation & Descriptive Statistics Dr. Prasad Modak Background Data collected from field may suffer from these problems Data may contain gaps ( = no readings during this period)
Descriptive Statistics
 Descriptive Statistics Suppose following data have been collected (heights of 99 five-year-old boys) 117.9 11.2 112.9 115.9 18. 14.6 17.1 117.9 111.8 16.3 111. 1.4 112.1 19.2 11. 15.4 99.4 11.1 13.3 16.9
of course the mean is p. That is just saying the average sample would have 82% answering
 Sampling Distribution for a Proportion Start with a population, adult Americans and a binary variable, whether they believe in God. The key parameter is the population proportion p. In this case let us
5) The table below describes the smoking habits of a group of asthma sufferers. two way table ( ( cell cell ) (cell cell) (cell cell) )
 The table below describes the smoking habits of a group of asthma sufferers. two way table ( ( cell cell ) (cell cell) (cell cell) )") MULTIPLE CHOICE. Choose the one alternative that best completes the statement or answers the question. Determine which score corresponds to the higher relative position. 1) Which score has a better relative
MULTIPLE CHOICE. Choose the one alternative that best completes the statement or answers the question. Determine which score corresponds to the higher relative position. 1) Which score has a better relative
The Assumption(s) of Normality
 of Normality") The Assumption(s) of Normality Copyright 2000, 2011, J. Toby Mordkoff This is very complicated, so I ll provide two versions. At a minimum, you should know the short one. It would be great if you knew
The Assumption(s) of Normality Copyright 2000, 2011, J. Toby Mordkoff This is very complicated, so I ll provide two versions. At a minimum, you should know the short one. It would be great if you knew
Risk and Uncertainty. Managerial Economics: Economic Tools for Today s Decision Makers, 4/e
 Risk and Uncertainty Chapter 14 Managerial Economics: Economic Tools for Today s Decision Makers, 4/e By Paul Keat and Philip Young Risk and Uncertainty Risk versus Uncertainty Sources of Business Risk
3.2 Measures of Spread
 3.2 Measures of Spread In some data sets the observations are close together, while in others they are more spread out. In addition to measures of the center, it's often important to measure the spread
1 of 6 9/30/15, 4:49 PM
 Student: Date: Instructor: Doug Ensley Course: MAT117 01 Applied Statistics - Ensley Assignment: Online 09 - Section 6.2 1. In January 2011, the average monthly rental rate for one-bedroom apartments in
WISE Power Tutorial All Exercises
 ame Date Class WISE Power Tutorial All Exercises Power: The B.E.A.. Mnemonic Four interrelated features of power can be summarized using BEA B Beta Error (Power = 1 Beta Error): Beta error (or Type II
You flip a fair coin four times, what is the probability that you obtain three heads.
 Handout 4: Binomial Distribution Reading Assignment: Chapter 5 In the previous handout, we looked at continuous random variables and calculating probabilities and percentiles for those type of variables.
Simulation Exercises to Reinforce the Foundations of Statistical Thinking in Online Classes
 Simulation Exercises to Reinforce the Foundations of Statistical Thinking in Online Classes Simcha Pollack, Ph.D. St. John s University Tobin College of Business Queens, NY, 11439 pollacks@stjohns.edu
CHAPTER 14 ORDINAL MEASURES OF CORRELATION: SPEARMAN'S RHO AND GAMMA
 CHAPTER 14 ORDINAL MEASURES OF CORRELATION: SPEARMAN'S RHO AND GAMMA Chapter 13 introduced the concept of correlation statistics and explained the use of Pearson's Correlation Coefficient when working
Continuous Random Variables
 Chapter 5 Continuous Random Variables 5.1 Continuous Random Variables 1 5.1.1 Student Learning Objectives By the end of this chapter, the student should be able to: Recognize and understand continuous
Normal distributions in SPSS
 Normal distributions in SPSS Bro. David E. Brown, BYU Idaho Department of Mathematics February 2, 2012 1 Calculating probabilities and percents from measurements: The CDF.NORMAL command 1. Go to the Variable
Calculating P-Values. Parkland College. Isela Guerra Parkland College. Recommended Citation
 Parkland College A with Honors Projects Honors Program 2014 Calculating P-Values Isela Guerra Parkland College Recommended Citation Guerra, Isela, "Calculating P-Values" (2014). A with Honors Projects.
Notes on Continuous Random Variables
 Notes on Continuous Random Variables Continuous random variables are random quantities that are measured on a continuous scale. They can usually take on any value over some interval, which distinguishes
Probability Distributions
 Learning Objectives Probability Distributions Section 1: How Can We Summarize Possible Outcomes and Their Probabilities? 1. Random variable 2. Probability distributions for discrete random variables 3.
SAMPLING DISTRIBUTIONS
 0009T_c07_308-352.qd 06/03/03 20:44 Page 308 7Chapter SAMPLING DISTRIBUTIONS 7.1 Population and Sampling Distributions 7.2 Sampling and Nonsampling Errors 7.3 Mean and Standard Deviation of 7.4 Shape of
The Normal distribution
 The Normal distribution The normal probability distribution is the most common model for relative frequencies of a quantitative variable. Bell-shaped and described by the function f(y) = 1 2σ π e{ 1 2σ
Descriptive Statistics
 Y520 Robert S Michael Goal: Learn to calculate indicators and construct graphs that summarize and describe a large quantity of values. Using the textbook readings and other resources listed on the web
MULTIPLE CHOICE. Choose the one alternative that best completes the statement or answers the question.
 Exam Name MULTIPLE CHOICE. Choose the one alternative that best completes the statement or answers the question. Find the mean for the given sample data. 1) Frank's Furniture employees earned the following
Algebra I Vocabulary Cards
 Algebra I Vocabulary Cards Table of Contents Expressions and Operations Natural Numbers Whole Numbers Integers Rational Numbers Irrational Numbers Real Numbers Absolute Value Order of Operations Expression
Introduction to Environmental Statistics. The Big Picture. Populations and Samples. Sample Data. Examples of sample data
 A Few Sources for Data Examples Used Introduction to Environmental Statistics Professor Jessica Utts University of California, Irvine jutts@uci.edu 1. Statistical Methods in Water Resources by D.R. Helsel
1) Write the following as an algebraic expression using x as the variable: Triple a number subtracted from the number
 Write the following as an algebraic expression using x as the variable: Triple a number subtracted from the number") 1) Write the following as an algebraic expression using x as the variable: Triple a number subtracted from the number A. 3(x - x) B. x 3 x C. 3x - x D. x - 3x 2) Write the following as an algebraic expression
1) Write the following as an algebraic expression using x as the variable: Triple a number subtracted from the number A. 3(x - x) B. x 3 x C. 3x - x D. x - 3x 2) Write the following as an algebraic expression
Chapter 3 RANDOM VARIATE GENERATION
 Chapter 3 RANDOM VARIATE GENERATION In order to do a Monte Carlo simulation either by hand or by computer, techniques must be developed for generating values of random variables having known distributions.
Exercise 1.12 (Pg. 22-23)
") Individuals: The objects that are described by a set of data. They may be people, animals, things, etc. (Also referred to as Cases or Records) Variables: The characteristics recorded about each individual.
Individuals: The objects that are described by a set of data. They may be people, animals, things, etc. (Also referred to as Cases or Records) Variables: The characteristics recorded about each individual.
Topic 9 ~ Measures of Spread
 AP Statistics Topic 9 ~ Measures of Spread Activity 9 : Baseball Lineups The table to the right contains data on the ages of the two teams involved in game of the 200 National League Division Series. Is
Lecture 2: Descriptive Statistics and Exploratory Data Analysis
 Lecture 2: Descriptive Statistics and Exploratory Data Analysis Further Thoughts on Experimental Design 16 Individuals (8 each from two populations) with replicates Pop 1 Pop 2 Randomly sample 4 individuals
Fairfield Public Schools
 Mathematics Fairfield Public Schools AP Statistics AP Statistics BOE Approved 04/08/2014 1 AP STATISTICS Critical Areas of Focus AP Statistics is a rigorous course that offers advanced students an opportunity
Problem of the Month: Fair Games
 Problem of the Month: The Problems of the Month (POM) are used in a variety of ways to promote problem solving and to foster the first standard of mathematical practice from the Common Core State Standards:
Ch. 3.1 # 3, 4, 7, 30, 31, 32
 Math Elementary Statistics: A Brief Version, 5/e Bluman Ch. 3. # 3, 4,, 30, 3, 3 Find (a) the mean, (b) the median, (c) the mode, and (d) the midrange. 3) High Temperatures The reported high temperatures
Normal and Binomial. Distributions
 Normal and Binomial Distributions Library, Teaching and Learning 14 By now, you know about averages means in particular and are familiar with words like data, standard deviation, variance, probability,
AP STATISTICS (Warm-Up Exercises)
") AP STATISTICS (Warm-Up Exercises) 1. Describe the distribution of ages in a city: 2. Graph a box plot on your calculator for the following test scores: {90, 80, 96, 54, 80, 95, 100, 75, 87, 62, 65, 85,
AP STATISTICS (Warm-Up Exercises) 1. Describe the distribution of ages in a city: 2. Graph a box plot on your calculator for the following test scores: {90, 80, 96, 54, 80, 95, 100, 75, 87, 62, 65, 85,
Normal Distribution Example 1
 PubH 6414 Worksheet 6a: Normal Distribution 1 of 6 Normal Distribution Example 1 Assume that cholesterol levels for women ages 20-34 are approximately normally distributed with µ = 185 and σ = 39. Cholesterol
Lecture 5 : The Poisson Distribution
 Lecture 5 : The Poisson Distribution Jonathan Marchini November 10, 2008 1 Introduction Many experimental situations occur in which we observe the counts of events within a set unit of time, area, volume,
MATH 140 Lab 4: Probability and the Standard Normal Distribution
 MATH 140 Lab 4: Probability and the Standard Normal Distribution Problem 1. Flipping a Coin Problem In this problem, we want to simualte the process of flipping a fair coin 1000 times. Note that the outcomes
Chapter 6: Probability
 Chapter 6: Probability In a more mathematically oriented statistics course, you would spend a lot of time talking about colored balls in urns. We will skip over such detailed examinations of probability,
EXAM #1 (Example) Instructor: Ela Jackiewicz. Relax and good luck!
 Instructor: Ela Jackiewicz. Relax and good luck!") STP 231 EXAM #1 (Example) Instructor: Ela Jackiewicz Honor Statement: I have neither given nor received information regarding this exam, and I will not do so until all exams have been graded and returned.
STP 231 EXAM #1 (Example) Instructor: Ela Jackiewicz Honor Statement: I have neither given nor received information regarding this exam, and I will not do so until all exams have been graded and returned.
MEASURES OF VARIATION
 NORMAL DISTRIBTIONS MEASURES OF VARIATION In statistics, it is important to measure the spread of data. A simple way to measure spread is to find the range. But statisticians want to know if the data are
LINEAR INEQUALITIES. less than, < 2x + 5 x 3 less than or equal to, greater than, > 3x 2 x 6 greater than or equal to,
 LINEAR INEQUALITIES When we use the equal sign in an equation we are stating that both sides of the equation are equal to each other. In an inequality, we are stating that both sides of the equation are
MBA 611 STATISTICS AND QUANTITATIVE METHODS
 MBA 611 STATISTICS AND QUANTITATIVE METHODS Part I. Review of Basic Statistics (Chapters 1-11) A. Introduction (Chapter 1) Uncertainty: Decisions are often based on incomplete information from uncertain