Big Data: The curse of dimensionality and variable selection in identification for a high dimensional nonlinear non-parametric system
|
|
|
- Doris Chase
- 10 years ago
- Views:
Transcription
1 Big Data: The curse of dimensionality and variable selection in identification for a high dimensional nonlinear non-parametric system Er-wei Bai University of Iowa, Iowa, USA Queen s University, Belfast, UK 1

2 2

3 Big Data? Deriving meaning from, and acting upon data sets that are large, high dimensional, heterogeneous, incomplete, contradictory, noisy, fast varying,..., with many different forms and formats. 3

4 Algorithms: Computing Data fusion Machine learning Dimension reduction Data streaming Scalable algorithms Fundamentals: Infrastructure CPS architecture Cloud, Grid, Distributive platforms Models Uncertainties Storage Software tools Data Management: Database and web Distributed management Stream management Data integration Decision making Data search and mining: Data mining/extraction Social network Data cleaning Visualization Models Many other Issues Big Data Security/Privacy: Cryptography Threat detection/protection Privacy preserving Social-economical impact Applications: Science, engineering, healthcare, business, Education, transportation, finance, law 4

5 What we are interested: for identification purpose y( ) = f(x( )) + noise To estimate the unknown nonlinear non-parametric f( ) when the dimension is high. 5
 when the dimension")
6 Pattern recognition x data y pattern f classifier Data mining x feature y label f inducer Imaging x input grey scale y output grey scale f deformation y=f(x) Machine learning x input y target Other areas Statistics x current/past values y trend 6

7 Non-parametric nonlinear system identification is pattern recognition or data mining or... Given x and want to estimate y = f(x ). Step 1: Similar patterns or neighborhoods x x(k) h. k 1,..., k l with y(k i ) = f(x(k i )). Step 2: y is a convex combination of y(k i ) with the weights K( x x(k i ) h ) j K( x x(kj ) h ), y = i K( x x(k i ) h ) j K(x x(k j ) h ) y(k i) Supervised learning with infinitely many patterns y(k i ). 7
 with the weights K( x x(k i ) h ) j K( x x(kj ) h ), y = i K(")
8 Parametric or basis approaches: polynomial (Volterra), splines, neural networks, RKHS,... Local or Point by point: DWO, local polynomial, kernel,... f is estimated point by point. If f(x 0 ) is of interests, only the data {x : x x 0 h} is used for some h > 0 and data far away from x 0 are not very useful. f(x) f(x 0 ) x 0 h x x 0 +h 0 8
 is of interests, only the data {x : x x 0 h} is used for some h > 0 and")
9 Curse of Dimensionality: Empty space. x R n, x 0 = (0,..., 0) T and C = {x : x k 0.1}. Randomly sample a point x, P rob{x C} = 0.1 n. On average, the number of points in C is N 0.1 n. To have one point in C N 10 n 1 billion when n = 9. 9

10 The curse of dimensionality The colorful phrase the curse of dimensionality was coined by Richard Bellman in High Dimensional Data Analysis: the curse and blessing of dimensionality, D. Donoho, 2000 The Curse of Dimensionality: A Blessing to Personalized Medicine, J of Clinical Oncology, Vol 28,

11 The diagonal is almost orthogonal to all coordinate axes. A unit cube [ 1, 1] n centered at the origin. The angel between its diagonal v = (±1,..., ±1) T. and any axis e i is cos(θ) =< v v, e i >= ±1 0 n 11
 =< v v, e i >= ±1 0 n 11")
12 High dimensional Gaussian. Let p(x) = 1 (2π) n e x 2 2. Calculate P rob{ x 2} n Prob For a high dimensional Gaussian, the entire samples are almost in the tails. 12

13 Concentration. x = (x 1,..., x n ) T and x k s iid Gaussian of zero mean. Then, P rob{ x 2 (1 + ɛ)µ x 2} e ɛ2n/6, P rob{ x 2 (1 ɛ)µ x 2} e ɛ2 n/4, High dimensional iid vectors are distributed close to the surface of a sphere of radius µ x 2. 13

14 Volumes of cubes and balls. V ball = πn/2 r n Γ(n/2 + 1), V cube = (2r) n lim n V ball/v cube = 0 The volume of a cube concentrates more on its corners as n increases. 14

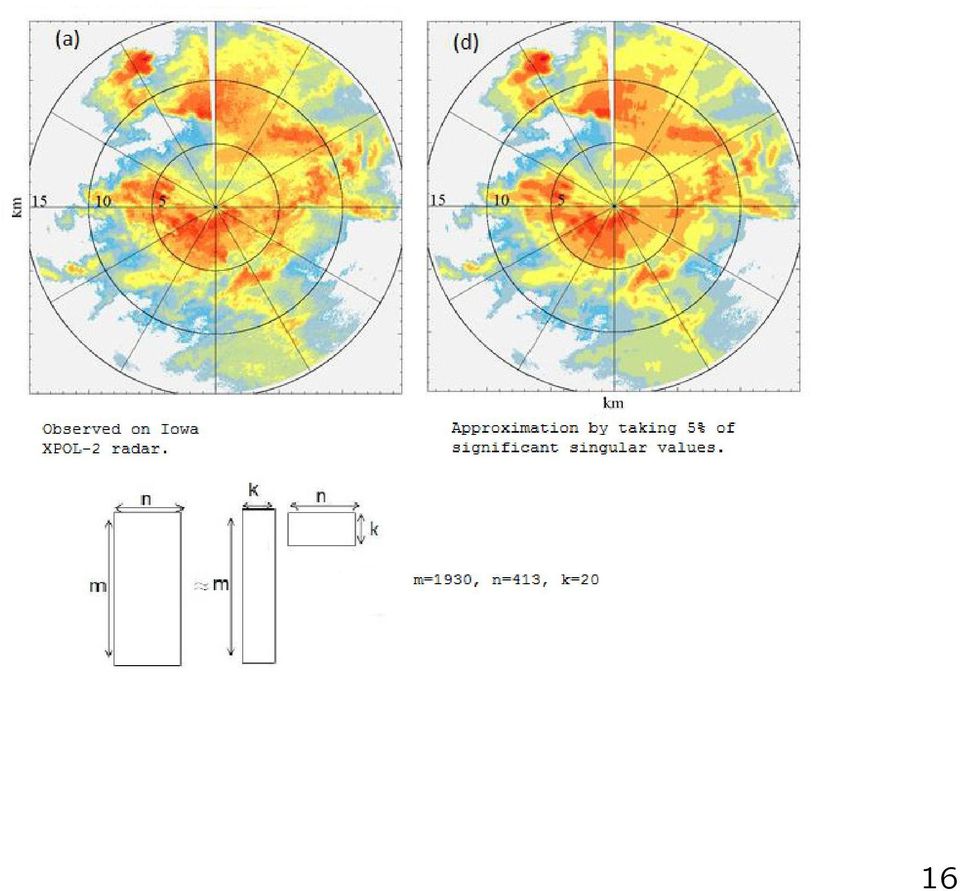
15 Extreme dimension reduction is possible, Science ,414 Reuters newswire stories, each article is represented as a vector containing the counts of the most frequently used 2000 words and further dimensionality reduction to R 2 (Boltzmann neural network). Text to a 2-dimensional code 15
.")
16 16
17 What we do in high dimensional nonlinear nonparametric system identification: Underlying models: Additive model, Block oriented nonlinear systems... Dimension asymptotic: The limit distributions... Variable selection and dimension reduction Global (nonlinear nonparametric) models... 17

18 Dimension reduction and variable selection: a well studied topic in the linear setting, e.g., Principal component analysis, Low rank matrix approximation, Factor analysis, Independent component analysis, Fisher discriminator, Forward/backward stepwise(stage),... Penalized (regularized) optimization and its variants min Y X ˆβ 2 + λ ˆβ i α, 0 α < or min Y X ˆβ 2, s.t, ˆβ i α t Nonlinear(support vector regression): Complexity) (Model Fits) + λ (Model Tibshirani, R. (1996). Regression shrinkage and selection via the Lasso. Journal of the Royal Statistical Society. Series B., Zhao, P. and Yu, B. (2006). On model selection consistency of Lasso, Journal of Machine Learning Research, irrepresentable condition. 18
: Complexity) (Model Fits) + λ (Model Tibshirani, R. (1996). Regression shrinkage and selection via the Lasso.")
19 Geometric interpretation arg min ˆβ Y X ˆβ 2 = arg min(ˆβ β 0 ) T X T X(ˆβ β 0 ) s.t, ˆβ i α t ridge Lasso bridge α = 1(Lasso), α = 2(ridge), α < 1(bridge) 19
, α = 2(ridge), α < 1(bridge)")
20 Compressive sensing Y = Xβ, β is sparse. min ˆβ Y X ˆβ 1 ˆβ = β provided that X satisfies the restricted isometry property. E. Candes and T. Tao, Near optimal signal recovery from random projections: Universal encoding strategies?, IEEE Trans. Inform. Theory, Dec

21 In a (FIR) system identification setting Y = u 1... u n u N... u n+n+1 e outliers and w random noise. ˆβ = arg min ξ Y Xξ 1 β + e + w Under some weak assumptions, iid on w and e has k βn non-zero elements for some β < 1, then in probability as N, ˆβ β 2 0 W. Xu, EW Bai and M Cho (2014) Automatica, System Identification in the Presence of Outliers and Random Noises: a Compressed Sensing Approach. 21
22 Big difference between linear and nonlinear settings Local vs global dimension. = y(k) = f(u(k 1), u(k 2), u(k 3), u(k 4)) u(k 4) u(k 1) 0 u(k 4)u(k 2) u(k 4) < 0, u(k 2) 0 u(k 4)u(k 3) u(k 4) < 0, u(k 2) < 0 u(k 1) otherwise Linear (global) PCA may not work. 22
23 Methods work in a linear setting may not work in a nonlinear setting, e.g., correlation methods x uniformly in [ 1,1] y = x 2,ρ(x,y) = 0 y = x,ρ(x,y) = 1 Linear: y(k) = x(k) 1 cov(y,x) cov(y) cov(x) = 1. Nonlinear: y(k) = x(k) 2 1 cov(y, x) = E(yx) E(y)E(x) = 1 1 a da = 0 y depends on x nonlinearly and the correlation is zero. 23
24 For a high dimensional nonlinear problem, approximation is a key. The ambient dimension is very high, yet its desired property is embedded in a low dimensional structure. The goal is to design efficient algorithms that reveal dominate variables for which one can have some theoretical guarantees. 24
25 Manifold Embedding (Nonlinear PCA): Eliminate redundant/dependent variables. If x = (x 1, x 2 ) and x 1 = g(x 2 ), = y = f(x) = f(g(x 2 ), x 2 ) = h(x 2 ). If x = (x 1, x 2 ) = (g 1 (z), g 2 (z)) = y = f(x) = f(g 1 (z), g 2 (z)) = h(z). More realistically, y h(x 2 ) (h(z)). 25
26 One dimensional: principal curve: Let x = (x 1,..., x n ) T and f(t) = (f 1 (t),..., f n (t)) be a curve in R n. Define s f (x) to be the value of t corresponding to the point of f(t) that is closest to x. The principal curve is f(t) = E(x s f (x) = t) f(t) is a curve that passes through the middle of the distribution of x. Principle surface is not easy and computationally prohibitive! 26
27 Local (linear/nonlinear) embedding: Find a set of lower dimensional data that resembles the local structure of the original high dimensional data. The key is distance preservation or topology preservation. 27
28 Multidimensional scaling, Science, 2000 Given high dimensional x i s, define d ij = x i x j Find lower dimensional z i s that minimizes the pairwise distance min z i i<j ( z i z j d ij ) 2 In a linear setting, is the Euclidean norm and in a nonlinear setting, is usually the distance along some manifold (Isomap). 28
29 Euclidean norm embedding: (Johnson-Lindenstrauss). Theorem: Let x 1,..., x n R n, ɛ (0, 1/2) and d O(ɛ 2 log n). There exists a matrix Q : R n R d and with a high probability, (1 ɛ) x i x j 2 Q(x i ) Q(x j ) 2 (1 + ɛ) x i x j 2 1 x i R n x i x j x j Q(x i ) R d Q(x i ) Q(x j ) 0 1 Q(x j ) 0 0 The space is approximately d dimensional not n dimensional if pairwise distance is an interest. What if on a manifold? 29
30 Isomap distance: Euclidean: A B < A C, Along the surface: A B > A C A B C 30
31 Local Linear Embedding Find the local structure of the data min w ij i x i j w ij x j 2 Find a lower dimensional data z that resembles the local structure of x, under some regularization min z i i z i j w ij z i 2 Estimation is carried out in a lower dimensional space y = f(z) 31
32 Example: Science,
33 Unsupervised: dimension reduction is based on x alone without considering output y: x 2 y(x 1,x 2 ) = x 2 By PCA, ( x1 x 2 ) x 1 ŷ(x 1,x 2 ) = x 1 y(x 1,x 2 ) x 1 ŷ(x 1,x 2 ) Add a penalty term, min zi λ i z i j w ij z i 2 + (1 λ)(output error term) An active research area. Henrik Ohlsson, Jacob Roll and Lennart Ljung, Manifold-Constrained Regressors in System Identification,
34 Global Model The problem of the curse of dimensionality is the lack of a global model. As a consequence, only data in (x 0 h, x 0 + h) can be used and the majority ( of ) data ( is discarded. ) As in a linear y1 x1 1 ( ) k case, every data is used min... b 2. y N x N 1 f(x) f(x 0 ) x 0 h x 0 x 0 +h y=kx+b x 0 Bayesian in particular Gaussian process model is one of the global models. Rasmussen CE and C. Williams (2006) Gaussian Pro- cess for Machine Learning, The MIT Press, Cambridge, MA 34
35 Gaussian process regression model Consider a scalar nonlinear system y(k) = f(x(k)) + v(k) where v( ) is an iid radome sequence of zero mean and finite variance σ 2 v. In a Gaussian Process setting, f(x 0 ), f(x(1)),..., f(x(n)) are assumed to follow a joint Gaussian distribution with zero mean (not necessary though) and a covariance matrix Σ p. 35
36 Example: Let y 0 = f(x 0 ), Y = (y(1), y(2),..., y(n)). Since (y 0, Y ) follows a joint Gaussian ( ) ( ) y0 c B N (0, Y B ) A Given x 0, what is y 0?. The conditional density of y 0 conditioned on Y is also Gaussian y 0 N (BA 1 Y, c BA 1 B ) The minimum variance estimate ŷ 0 = ˆf(x 0 ) of f(x 0 ) is the conditional mean given by ˆf(x 0 ) = BA 1 Y 36
37 Huntington Disease Example: test Neurological cognitive A cognitive test data for 21 pa- Totally 60 patients. tients were missing. 37
38 Modified Gaussian Model: The first row are predicted and the second true but missing data. ( ( ) ) Bai et al,
39 Some discussions: Hard vs soft approaches. Top down vs bottom up approaches. Simplified but reasonable models
40 Top down approach: x i ( ) is irrelevant f x i where min f(x 0 ),ˆβ y(k) = f(x 1 (k),..., x n (k)) + noise = 0. Local linear estimator f(x(k)) = f(x 0 ) + (x(k) x 0 ) T f x x 0 + h.o.t N {y(k) [1, (x(k) x 0 ) T ] k=1 β = β 1. β d 0. 0 ( f(x 0 ) ˆβ ) } 2 K Q (x(k) x 0 ), β1 > 0,..., β d > 0, β d+1 =... = β n = 0 A = {j : βj > 0} = {1, 2, 3,..., d} Goal is both parameter and set convergence. 40
41 Parameter and set convergence: Example: x 1 (k) = k x 1 = 0.8 x 2 (k) = 0.5 k x 2 = 0 ˆx jk x j, j = 1, 2 A = {j : x j > 0} = {1}. Â k = {j : x jk > 0} = {1, 2} A 41
42 Top down approach: The approach is an adaptive convex penalized optimization, J(β) = min β Z Φβ 2 + λ n w j β j, j=1 w j = 1 calculated from the local linear estimator. ˆβ j some technical conditions, in probability as N, f x i x 0 Then under f x i x 0 if f x i x 0 > 0 parameter convergence P rob{ f x i x 0 = 0} = 1, if f x i x 0 = 0 set convergence The approach works if the the available data is long. E Bai et al, Kernel based approaches to local nonlinear non-parametric variable selection, Automatica, 2014, K Bertin, Selection of variables and dimension reduction in high-dimensional non-parametric regression, EJS,
43 Bottom up approach:forward/backward First proposed by Billings, 1989, Identification of MIMO non-linear systems using a forward-regression orthogonal estimator. Extremely popular in statistics and in practice. For a long time was considered to be Ad Hoc but recent research showed otherwise, T Zhang, Adaptive Forward-Backward Greedy Algorithm for Learning Sparse Representations, IEEE TIT,2011, On the Consistency of Feature Selection using Greedy Least Squares Regression, J of Machine learning Res. 2009, Tropp, Greed is Good: Algorithmic Results for Sparse Approximation, IEEE TIT,
44 Forward selection What if the dimension is high and the available data set is limited. To illustrate, consider a linear case Y = ( x 1, x 2,..., x n ) ( ) a1. a n kth step: i k First step: i 1 = arg min Y a i x i 2 i [1,...,n] = arg min i [1,...,n]/[i 1,...,i k 1 ] Y (x i 1,..., x i k 1 ) a 1. a k 1 a i x i 2 44
45 Bottom up approach: Backward selection Start with the chosen (i 1,..., i p ) and a 1,..., a p. i 1 = arg min Y (x i i n/[i 2,...,i p ] 2,..., x ip ) Repeated for every i j. a 2. a p a i x i 2, 45
46 Forward/Backward for nonlinear system: The minimum set of unfalsified variables f(x 1,..., x n ) g(x i1,..., x ip ) 0 Low dimensional neighborhood One dimensional neighborhood of x i (k), {x(j) R n (x(k) x(j)) i = (x i (k) x i (k)) 2 h} p-dimensional neighborhood of (x i1 (k),..., x ip (k)), = {x(j) R n (x(k) x(j)) i1,...,ip (x i1 (k) x i1 (k)) (x ip (k) x ip (j)) 2 h} 46
47 Algorithm: Step 1: Determine the bandwidth. Step 2: The number of variables are determined by the modified Box-Pierce test. Step 3: Forward selection. Step 4: Backward selection. Step 5: Terminate. 47
48 Example: the actual system lies approximately on a unknown dimensional manifold: x 2 (k) g(x 1 (k)) y(k) f(x 1 (k), g(x 1 (k))) = f 1 (x 1 (k)) which is lower dimensional. y(k) = 10sin(x 1 (k)x 2 (k))+20(x 3 (k) 0.5) 2 +10x 4 (k)+5x 5 (k) +x 6 (k)x 7 (k)+x 7 (k) 2 +5cos(x 6 (k)x 8 (k))+exp( x 8 (k) ) +0.5η(k), k = 1, 2,..., 500 η(k) is i.i.d. variance. Gaussian noise of zero mean and unit 48
49 x 3 (k), x 5 (k) are independent and uniformly in [ 1, 1] and x 4 (k) = x 1 (k) = x 2 (k) = x 6 (k) = x 7 (k) = x 8 (k) = x 3 (k) x 5 (k) η(k) x 3 (k) 2 x 5 (k) η(k) x 3 (k) x 5 (k) η(k) x 1 (k) x 4 (k) η(k) x 3 (k) 3 x 5 (k) η(k) x 2 (k) x 5 (k) η(k) x 1 ( ),..., x 8 ( ) are not exactly but approximately on an two dimensional manifold. h = 0.2 was chosen by the 5-fold cross validation. Test signal x 3 (k) = 0.9 sin( 2πk 20 ), x 5(k) = 0.9 cos( 2πk ), k = 1,...,
50 Results: Gof=0.9205(2 dim),0.6940(8 dim) RSS number n of variables chosen Bai et al, 2013, On Variable Selection of a Nonlinear Non-parametric System with a Limited Data Set 50
51 Nonlinear systems with short term memory and low degree of interactions: Additive systems y(k) = f(x 1 (k),..., x n (k)) + noise = n f i (x i (k)) + f ij (x i (k), x j (k)) + noise i=1 j>i An n-dimensional system becomes a number of 1 and 2-dimensional systems. Under some technical conditions, e.g., iid or Galois on the inputs, f i and f ij can be identified independently... Bai et al TAC(2008), Automatica(2009), Automatica(2010), TAC(2010)... 51
52 Why? Consider a household expense tree: The most widely used nonlinear model in practice (and also in the statistics literature.) 52
53 A simple example: y(k) = c+ f 1 (x 1 (k))+ f 2 (x 2 (k))+ f 12 (x 1 (k), x 2 (k))+v(k) = c + f 1 (x 1 (k)) + f 2 (x 2 (k)) + f 12 (x 1 (k), x 2 (k)) + v(k) Each term can be identified separately and low dimension. c = Ey(k) f 1 (x 0 1 ) = E(y(k) x 1(k) = x 0 1 ) c f 2 (x 0 2 ) = E(y(k) x 2(k) = x 0 2 ) c f 12 (x 0 1, x0 2 ) = E(y(k) x 1(k) = x 0 1, x 2(k) = x 0 2 ) c 53
54 Quick boring derivation: g 1,12 (x 0 1 ) = E( f 12 (x 1 (k), x 2 (k)) x 1 (k) = x 0 1 ) g 2,12 (x 0 2 ) = E( f 12 (x 1 (k), x 2 (k)) x 2 (k) = x 0 2 ) c 12 = E( f 12 (x 1 (k), x 2 (k))) c 1 = E( f 1 (x 1 (k)) + g 1,12 (x 1 (k))) c 2 = E( f 2 (x 2 (k)) + g 2,12 (x 2 (k))) f 12 (x 1 (k), x 2 (k)) = f 12 (x 1 (k), x 2 (k)) g 2,12 (x 2 (k)) g 1,12 (x 1 (k)) + c 12 f 1 (x 1 (k)) = f 1 (x 1 (k)) + g 1,12 (x 1 (k)) c 1 f 2 (x 2 (k)) = f 2 (x 2 (k)) + g 2,12 (x 2 (k)) c 2 c = c c 12 = c 1 + c 2 Ef 1 (x 1 (k)) = Ef 2 (x 2 (k)) = Ef 12 (x 1 (k), x 2 (k)) = 0 Ef 1 (x 1 (k)) f 2 (x 2 (k)) = Ef i (x i (k)) f 12 (x 1 (k), x 2 (k)) = 0, i = 1, 2, 54
55 Convergence and sparsity Consider J = Y ( i f i + j<k f jk ) 2 +λ 1 ( f i 2 + f jk 2 ) 1/2 +λ 2 f jk i j k j<k Then, under some technical conditions, the true f i, f jk s can be identified and sparse. Rachenko and James, J of ASA,
56 Thanks! 56
HT2015: SC4 Statistical Data Mining and Machine Learning
 HT2015: SC4 Statistical Data Mining and Machine Learning Dino Sejdinovic Department of Statistics Oxford http://www.stats.ox.ac.uk/~sejdinov/sdmml.html Bayesian Nonparametrics Parametric vs Nonparametric
PATTERN RECOGNITION AND MACHINE LEARNING CHAPTER 4: LINEAR MODELS FOR CLASSIFICATION
 PATTERN RECOGNITION AND MACHINE LEARNING CHAPTER 4: LINEAR MODELS FOR CLASSIFICATION Introduction In the previous chapter, we explored a class of regression models having particularly simple analytical
Comparison of Non-linear Dimensionality Reduction Techniques for Classification with Gene Expression Microarray Data
 CMPE 59H Comparison of Non-linear Dimensionality Reduction Techniques for Classification with Gene Expression Microarray Data Term Project Report Fatma Güney, Kübra Kalkan 1/15/2013 Keywords: Non-linear
Machine Learning and Data Analysis overview. Department of Cybernetics, Czech Technical University in Prague. http://ida.felk.cvut.
 Machine Learning and Data Analysis overview Jiří Kléma Department of Cybernetics, Czech Technical University in Prague http://ida.felk.cvut.cz psyllabus Lecture Lecturer Content 1. J. Kléma Introduction,
Supervised Feature Selection & Unsupervised Dimensionality Reduction
 Supervised Feature Selection & Unsupervised Dimensionality Reduction Feature Subset Selection Supervised: class labels are given Select a subset of the problem features Why? Redundant features much or
Manifold Learning Examples PCA, LLE and ISOMAP
 Manifold Learning Examples PCA, LLE and ISOMAP Dan Ventura October 14, 28 Abstract We try to give a helpful concrete example that demonstrates how to use PCA, LLE and Isomap, attempts to provide some intuition
Multimedia Databases. Wolf-Tilo Balke Philipp Wille Institut für Informationssysteme Technische Universität Braunschweig http://www.ifis.cs.tu-bs.
 Multimedia Databases Wolf-Tilo Balke Philipp Wille Institut für Informationssysteme Technische Universität Braunschweig http://www.ifis.cs.tu-bs.de 14 Previous Lecture 13 Indexes for Multimedia Data 13.1
Lecture 3: Linear methods for classification
 Lecture 3: Linear methods for classification Rafael A. Irizarry and Hector Corrada Bravo February, 2010 Today we describe four specific algorithms useful for classification problems: linear regression,
Statistical Machine Learning
 Statistical Machine Learning UoC Stats 37700, Winter quarter Lecture 4: classical linear and quadratic discriminants. 1 / 25 Linear separation For two classes in R d : simple idea: separate the classes
Component Ordering in Independent Component Analysis Based on Data Power
 Component Ordering in Independent Component Analysis Based on Data Power Anne Hendrikse Raymond Veldhuis University of Twente University of Twente Fac. EEMCS, Signals and Systems Group Fac. EEMCS, Signals
Dimension Reduction. Wei-Ta Chu 2014/10/22. Multimedia Content Analysis, CSIE, CCU
 1 Dimension Reduction Wei-Ta Chu 2014/10/22 2 1.1 Principal Component Analysis (PCA) Widely used in dimensionality reduction, lossy data compression, feature extraction, and data visualization Also known
Linear Classification. Volker Tresp Summer 2015
 Linear Classification Volker Tresp Summer 2015 1 Classification Classification is the central task of pattern recognition Sensors supply information about an object: to which class do the object belong
Data Mining and Data Warehousing. Henryk Maciejewski. Data Mining Predictive modelling: regression
 Data Mining and Data Warehousing Henryk Maciejewski Data Mining Predictive modelling: regression Algorithms for Predictive Modelling Contents Regression Classification Auxiliary topics: Estimation of prediction
Gaussian Processes in Machine Learning
 Gaussian Processes in Machine Learning Carl Edward Rasmussen Max Planck Institute for Biological Cybernetics, 72076 Tübingen, Germany [email protected] WWW home page: http://www.tuebingen.mpg.de/ carl
MACHINE LEARNING IN HIGH ENERGY PHYSICS
 MACHINE LEARNING IN HIGH ENERGY PHYSICS LECTURE #1 Alex Rogozhnikov, 2015 INTRO NOTES 4 days two lectures, two practice seminars every day this is introductory track to machine learning kaggle competition!
15.062 Data Mining: Algorithms and Applications Matrix Math Review
 .6 Data Mining: Algorithms and Applications Matrix Math Review The purpose of this document is to give a brief review of selected linear algebra concepts that will be useful for the course and to develop
Statistical Models in Data Mining
 Statistical Models in Data Mining Sargur N. Srihari University at Buffalo The State University of New York Department of Computer Science and Engineering Department of Biostatistics 1 Srihari Flood of
CS 5614: (Big) Data Management Systems. B. Aditya Prakash Lecture #18: Dimensionality Reduc7on
 Data Management Systems. B. Aditya Prakash Lecture #18: Dimensionality Reduc7on") CS 5614: (Big) Data Management Systems B. Aditya Prakash Lecture #18: Dimensionality Reduc7on Dimensionality Reduc=on Assump=on: Data lies on or near a low d- dimensional subspace Axes of this subspace
CS 5614: (Big) Data Management Systems B. Aditya Prakash Lecture #18: Dimensionality Reduc7on Dimensionality Reduc=on Assump=on: Data lies on or near a low d- dimensional subspace Axes of this subspace
CS 2750 Machine Learning. Lecture 1. Machine Learning. http://www.cs.pitt.edu/~milos/courses/cs2750/ CS 2750 Machine Learning.
 Lecture Machine Learning Milos Hauskrecht [email protected] 539 Sennott Square, x5 http://www.cs.pitt.edu/~milos/courses/cs75/ Administration Instructor: Milos Hauskrecht [email protected] 539 Sennott
So which is the best?
 Manifold Learning Techniques: So which is the best? Todd Wittman Math 8600: Geometric Data Analysis Instructor: Gilad Lerman Spring 2005 Note: This presentation does not contain information on LTSA, which
Section 1.1. Introduction to R n
 The Calculus of Functions of Several Variables Section. Introduction to R n Calculus is the study of functional relationships and how related quantities change with each other. In your first exposure to
Penalized regression: Introduction
 Penalized regression: Introduction Patrick Breheny August 30 Patrick Breheny BST 764: Applied Statistical Modeling 1/19 Maximum likelihood Much of 20th-century statistics dealt with maximum likelihood
Least Squares Estimation
 Least Squares Estimation SARA A VAN DE GEER Volume 2, pp 1041 1045 in Encyclopedia of Statistics in Behavioral Science ISBN-13: 978-0-470-86080-9 ISBN-10: 0-470-86080-4 Editors Brian S Everitt & David
Visualization by Linear Projections as Information Retrieval
 Visualization by Linear Projections as Information Retrieval Jaakko Peltonen Helsinki University of Technology, Department of Information and Computer Science, P. O. Box 5400, FI-0015 TKK, Finland [email protected]
Class #6: Non-linear classification. ML4Bio 2012 February 17 th, 2012 Quaid Morris
 Class #6: Non-linear classification ML4Bio 2012 February 17 th, 2012 Quaid Morris 1 Module #: Title of Module 2 Review Overview Linear separability Non-linear classification Linear Support Vector Machines
Exact Inference for Gaussian Process Regression in case of Big Data with the Cartesian Product Structure
 Exact Inference for Gaussian Process Regression in case of Big Data with the Cartesian Product Structure Belyaev Mikhail 1,2,3, Burnaev Evgeny 1,2,3, Kapushev Yermek 1,2 1 Institute for Information Transmission
Machine Learning and Pattern Recognition Logistic Regression
 Machine Learning and Pattern Recognition Logistic Regression Course Lecturer:Amos J Storkey Institute for Adaptive and Neural Computation School of Informatics University of Edinburgh Crichton Street,
Introduction: Overview of Kernel Methods
 Introduction: Overview of Kernel Methods Statistical Data Analysis with Positive Definite Kernels Kenji Fukumizu Institute of Statistical Mathematics, ROIS Department of Statistical Science, Graduate University
Feature Selection vs. Extraction
 Feature Selection In many applications, we often encounter a very large number of potential features that can be used Which subset of features should be used for the best classification? Need for a small
Distance Metric Learning in Data Mining (Part I) Fei Wang and Jimeng Sun IBM TJ Watson Research Center
 Fei Wang and Jimeng Sun IBM TJ Watson Research Center") Distance Metric Learning in Data Mining (Part I) Fei Wang and Jimeng Sun IBM TJ Watson Research Center 1 Outline Part I - Applications Motivation and Introduction Patient similarity application Part II
Distance Metric Learning in Data Mining (Part I) Fei Wang and Jimeng Sun IBM TJ Watson Research Center 1 Outline Part I - Applications Motivation and Introduction Patient similarity application Part II
Medical Information Management & Mining. You Chen Jan,15, 2013 [email protected]
 Medical Information Management & Mining You Chen Jan,15, 2013 [email protected] 1 Trees Building Materials Trees cannot be used to build a house directly. How can we transform trees to building materials?
Non-negative Matrix Factorization (NMF) in Semi-supervised Learning Reducing Dimension and Maintaining Meaning
 in Semi-supervised Learning Reducing Dimension and Maintaining Meaning") Non-negative Matrix Factorization (NMF) in Semi-supervised Learning Reducing Dimension and Maintaining Meaning SAMSI 10 May 2013 Outline Introduction to NMF Applications Motivations NMF as a middle step
Non-negative Matrix Factorization (NMF) in Semi-supervised Learning Reducing Dimension and Maintaining Meaning SAMSI 10 May 2013 Outline Introduction to NMF Applications Motivations NMF as a middle step
Linear Threshold Units
 Linear Threshold Units w x hx (... w n x n w We assume that each feature x j and each weight w j is a real number (we will relax this later) We will study three different algorithms for learning linear
NOV - 30211/II. 1. Let f(z) = sin z, z C. Then f(z) : 3. Let the sequence {a n } be given. (A) is bounded in the complex plane
 = sin z, z C. Then f(z) : 3. Let the sequence {a n } be given. (A) is bounded in the complex plane") Mathematical Sciences Paper II Time Allowed : 75 Minutes] [Maximum Marks : 100 Note : This Paper contains Fifty (50) multiple choice questions. Each question carries Two () marks. Attempt All questions.
Mathematical Sciences Paper II Time Allowed : 75 Minutes] [Maximum Marks : 100 Note : This Paper contains Fifty (50) multiple choice questions. Each question carries Two () marks. Attempt All questions.
DATA MINING CLUSTER ANALYSIS: BASIC CONCEPTS
 DATA MINING CLUSTER ANALYSIS: BASIC CONCEPTS 1 AND ALGORITHMS Chiara Renso KDD-LAB ISTI- CNR, Pisa, Italy WHAT IS CLUSTER ANALYSIS? Finding groups of objects such that the objects in a group will be similar
Example: Credit card default, we may be more interested in predicting the probabilty of a default than classifying individuals as default or not.
 Statistical Learning: Chapter 4 Classification 4.1 Introduction Supervised learning with a categorical (Qualitative) response Notation: - Feature vector X, - qualitative response Y, taking values in C
STA 4273H: Statistical Machine Learning
 STA 4273H: Statistical Machine Learning Russ Salakhutdinov Department of Statistics! [email protected]! http://www.cs.toronto.edu/~rsalakhu/ Lecture 6 Three Approaches to Classification Construct
Unsupervised Data Mining (Clustering)
") Unsupervised Data Mining (Clustering) Javier Béjar KEMLG December 01 Javier Béjar (KEMLG) Unsupervised Data Mining (Clustering) December 01 1 / 51 Introduction Clustering in KDD One of the main tasks in
Unsupervised Data Mining (Clustering) Javier Béjar KEMLG December 01 Javier Béjar (KEMLG) Unsupervised Data Mining (Clustering) December 01 1 / 51 Introduction Clustering in KDD One of the main tasks in
Data, Measurements, Features
 Data, Measurements, Features Middle East Technical University Dep. of Computer Engineering 2009 compiled by V. Atalay What do you think of when someone says Data? We might abstract the idea that data are
EM Clustering Approach for Multi-Dimensional Analysis of Big Data Set
 EM Clustering Approach for Multi-Dimensional Analysis of Big Data Set Amhmed A. Bhih School of Electrical and Electronic Engineering Princy Johnson School of Electrical and Electronic Engineering Martin
Two Topics in Parametric Integration Applied to Stochastic Simulation in Industrial Engineering
 Two Topics in Parametric Integration Applied to Stochastic Simulation in Industrial Engineering Department of Industrial Engineering and Management Sciences Northwestern University September 15th, 2014
Data Visualization and Feature Selection: New Algorithms for Nongaussian Data
 Data Visualization and Feature Selection: New Algorithms for Nongaussian Data Howard Hua Yang and John Moody Oregon Graduate nstitute of Science and Technology NW, Walker Rd., Beaverton, OR976, USA [email protected],
An Introduction to Machine Learning
 An Introduction to Machine Learning L5: Novelty Detection and Regression Alexander J. Smola Statistical Machine Learning Program Canberra, ACT 0200 Australia [email protected] Tata Institute, Pune,
Support Vector Machines with Clustering for Training with Very Large Datasets
 Support Vector Machines with Clustering for Training with Very Large Datasets Theodoros Evgeniou Technology Management INSEAD Bd de Constance, Fontainebleau 77300, France [email protected] Massimiliano
CSCI567 Machine Learning (Fall 2014)
") CSCI567 Machine Learning (Fall 2014) Drs. Sha & Liu {feisha,yanliu.cs}@usc.edu September 22, 2014 Drs. Sha & Liu ({feisha,yanliu.cs}@usc.edu) CSCI567 Machine Learning (Fall 2014) September 22, 2014 1 /
CSCI567 Machine Learning (Fall 2014) Drs. Sha & Liu {feisha,yanliu.cs}@usc.edu September 22, 2014 Drs. Sha & Liu ({feisha,yanliu.cs}@usc.edu) CSCI567 Machine Learning (Fall 2014) September 22, 2014 1 /
Supervised Learning (Big Data Analytics)
") Supervised Learning (Big Data Analytics) Vibhav Gogate Department of Computer Science The University of Texas at Dallas Practical advice Goal of Big Data Analytics Uncover patterns in Data. Can be used
Supervised Learning (Big Data Analytics) Vibhav Gogate Department of Computer Science The University of Texas at Dallas Practical advice Goal of Big Data Analytics Uncover patterns in Data. Can be used
Supervised and unsupervised learning - 1
 Chapter 3 Supervised and unsupervised learning - 1 3.1 Introduction The science of learning plays a key role in the field of statistics, data mining, artificial intelligence, intersecting with areas in
Statistiques en grande dimension
 Statistiques en grande dimension Christophe Giraud 1,2 et Tristan Mary-Huart 3,4 (1) Université Paris-Sud (2) Ecole Polytechnique (3) AgroParistech (4) INRA - Le Moulon M2 MathSV & Maths Aléa C. Giraud
Master s Theory Exam Spring 2006
 Spring 2006 This exam contains 7 questions. You should attempt them all. Each question is divided into parts to help lead you through the material. You should attempt to complete as much of each problem
Sections 2.11 and 5.8
 Sections 211 and 58 Timothy Hanson Department of Statistics, University of South Carolina Stat 704: Data Analysis I 1/25 Gesell data Let X be the age in in months a child speaks his/her first word and
Large-Scale Similarity and Distance Metric Learning
 Large-Scale Similarity and Distance Metric Learning Aurélien Bellet Télécom ParisTech Joint work with K. Liu, Y. Shi and F. Sha (USC), S. Clémençon and I. Colin (Télécom ParisTech) Séminaire Criteo March
Sublinear Algorithms for Big Data. Part 4: Random Topics
 Sublinear Algorithms for Big Data Part 4: Random Topics Qin Zhang 1-1 2-1 Topic 1: Compressive sensing Compressive sensing The model (Candes-Romberg-Tao 04; Donoho 04) Applicaitons Medical imaging reconstruction
Visualization of General Defined Space Data
 International Journal of Computer Graphics & Animation (IJCGA) Vol.3, No.4, October 013 Visualization of General Defined Space Data John R Rankin La Trobe University, Australia Abstract A new algorithm
CS 591.03 Introduction to Data Mining Instructor: Abdullah Mueen
 CS 591.03 Introduction to Data Mining Instructor: Abdullah Mueen LECTURE 3: DATA TRANSFORMATION AND DIMENSIONALITY REDUCTION Chapter 3: Data Preprocessing Data Preprocessing: An Overview Data Quality Major
Learning Gaussian process models from big data. Alan Qi Purdue University Joint work with Z. Xu, F. Yan, B. Dai, and Y. Zhu
 Learning Gaussian process models from big data Alan Qi Purdue University Joint work with Z. Xu, F. Yan, B. Dai, and Y. Zhu Machine learning seminar at University of Cambridge, July 4 2012 Data A lot of
A Survey on Pre-processing and Post-processing Techniques in Data Mining
 , pp. 99-128 http://dx.doi.org/10.14257/ijdta.2014.7.4.09 A Survey on Pre-processing and Post-processing Techniques in Data Mining Divya Tomar and Sonali Agarwal Indian Institute of Information Technology,
Syllabus for MATH 191 MATH 191 Topics in Data Science: Algorithms and Mathematical Foundations Department of Mathematics, UCLA Fall Quarter 2015
 Syllabus for MATH 191 MATH 191 Topics in Data Science: Algorithms and Mathematical Foundations Department of Mathematics, UCLA Fall Quarter 2015 Lecture: MWF: 1:00-1:50pm, GEOLOGY 4645 Instructor: Mihai
Introduction to Support Vector Machines. Colin Campbell, Bristol University
 Introduction to Support Vector Machines Colin Campbell, Bristol University 1 Outline of talk. Part 1. An Introduction to SVMs 1.1. SVMs for binary classification. 1.2. Soft margins and multi-class classification.
Neural Networks Lesson 5 - Cluster Analysis
 Neural Networks Lesson 5 - Cluster Analysis Prof. Michele Scarpiniti INFOCOM Dpt. - Sapienza University of Rome http://ispac.ing.uniroma1.it/scarpiniti/index.htm [email protected] Rome, 29
Statistical machine learning, high dimension and big data
 Statistical machine learning, high dimension and big data S. Gaïffas 1 14 mars 2014 1 CMAP - Ecole Polytechnique Agenda for today Divide and Conquer principle for collaborative filtering Graphical modelling,
3. INNER PRODUCT SPACES
 . INNER PRODUCT SPACES.. Definition So far we have studied abstract vector spaces. These are a generalisation of the geometric spaces R and R. But these have more structure than just that of a vector space.
Bilinear Prediction Using Low-Rank Models
 Bilinear Prediction Using Low-Rank Models Inderjit S. Dhillon Dept of Computer Science UT Austin 26th International Conference on Algorithmic Learning Theory Banff, Canada Oct 6, 2015 Joint work with C-J.
Noisy and Missing Data Regression: Distribution-Oblivious Support Recovery
 : Distribution-Oblivious Support Recovery Yudong Chen Department of Electrical and Computer Engineering The University of Texas at Austin Austin, TX 7872 Constantine Caramanis Department of Electrical
Metrics on SO(3) and Inverse Kinematics
 and Inverse Kinematics") Mathematical Foundations of Computer Graphics and Vision Metrics on SO(3) and Inverse Kinematics Luca Ballan Institute of Visual Computing Optimization on Manifolds Descent approach d is a ascent direction
Mathematical Foundations of Computer Graphics and Vision Metrics on SO(3) and Inverse Kinematics Luca Ballan Institute of Visual Computing Optimization on Manifolds Descent approach d is a ascent direction
Dirichlet Processes A gentle tutorial
 Dirichlet Processes A gentle tutorial SELECT Lab Meeting October 14, 2008 Khalid El-Arini Motivation We are given a data set, and are told that it was generated from a mixture of Gaussian distributions.
Basics of Statistical Machine Learning
 CS761 Spring 2013 Advanced Machine Learning Basics of Statistical Machine Learning Lecturer: Xiaojin Zhu [email protected] Modern machine learning is rooted in statistics. You will find many familiar
These slides follow closely the (English) course textbook Pattern Recognition and Machine Learning by Christopher Bishop
 course textbook Pattern Recognition and Machine Learning by Christopher Bishop") Music and Machine Learning (IFT6080 Winter 08) Prof. Douglas Eck, Université de Montréal These slides follow closely the (English) course textbook Pattern Recognition and Machine Learning by Christopher
Music and Machine Learning (IFT6080 Winter 08) Prof. Douglas Eck, Université de Montréal These slides follow closely the (English) course textbook Pattern Recognition and Machine Learning by Christopher
ADVANCED MACHINE LEARNING. Introduction
 1 1 Introduction Lecturer: Prof. Aude Billard ([email protected]) Teaching Assistants: Guillaume de Chambrier, Nadia Figueroa, Denys Lamotte, Nicola Sommer 2 2 Course Format Alternate between: Lectures
Knowledge Discovery from patents using KMX Text Analytics
 Knowledge Discovery from patents using KMX Text Analytics Dr. Anton Heijs [email protected] Treparel Abstract In this white paper we discuss how the KMX technology of Treparel can help searchers
THREE DIMENSIONAL REPRESENTATION OF AMINO ACID CHARAC- TERISTICS
 THREE DIMENSIONAL REPRESENTATION OF AMINO ACID CHARAC- TERISTICS O.U. Sezerman 1, R. Islamaj 2, E. Alpaydin 2 1 Laborotory of Computational Biology, Sabancı University, Istanbul, Turkey. 2 Computer Engineering
BUSINESS ANALYTICS. Data Pre-processing. Lecture 3. Information Systems and Machine Learning Lab. University of Hildesheim.
 Tomáš Horváth BUSINESS ANALYTICS Lecture 3 Data Pre-processing Information Systems and Machine Learning Lab University of Hildesheim Germany Overview The aim of this lecture is to describe some data pre-processing
Introduction to General and Generalized Linear Models
 Introduction to General and Generalized Linear Models General Linear Models - part I Henrik Madsen Poul Thyregod Informatics and Mathematical Modelling Technical University of Denmark DK-2800 Kgs. Lyngby
Server Load Prediction
 Server Load Prediction Suthee Chaidaroon ([email protected]) Joon Yeong Kim ([email protected]) Jonghan Seo ([email protected]) Abstract Estimating server load average is one of the methods that
Machine Learning and Data Mining. Regression Problem. (adapted from) Prof. Alexander Ihler
 Prof. Alexander Ihler") Machine Learning and Data Mining Regression Problem (adapted from) Prof. Alexander Ihler Overview Regression Problem Definition and define parameters ϴ. Prediction using ϴ as parameters Measure the error
Machine Learning and Data Mining Regression Problem (adapted from) Prof. Alexander Ihler Overview Regression Problem Definition and define parameters ϴ. Prediction using ϴ as parameters Measure the error
A Simple Introduction to Support Vector Machines
 A Simple Introduction to Support Vector Machines Martin Law Lecture for CSE 802 Department of Computer Science and Engineering Michigan State University Outline A brief history of SVM Large-margin linear
Monotonicity Hints. Abstract
 Monotonicity Hints Joseph Sill Computation and Neural Systems program California Institute of Technology email: [email protected] Yaser S. Abu-Mostafa EE and CS Deptartments California Institute of Technology
Inner Product Spaces and Orthogonality
 Inner Product Spaces and Orthogonality week 3-4 Fall 2006 Dot product of R n The inner product or dot product of R n is a function, defined by u, v a b + a 2 b 2 + + a n b n for u a, a 2,, a n T, v b,
Publication List. Chen Zehua Department of Statistics & Applied Probability National University of Singapore
 Publication List Chen Zehua Department of Statistics & Applied Probability National University of Singapore Publications Journal Papers 1. Y. He and Z. Chen (2014). A sequential procedure for feature selection
Tree based ensemble models regularization by convex optimization
 Tree based ensemble models regularization by convex optimization Bertrand Cornélusse, Pierre Geurts and Louis Wehenkel Department of Electrical Engineering and Computer Science University of Liège B-4000
BIOINF 585 Fall 2015 Machine Learning for Systems Biology & Clinical Informatics http://www.ccmb.med.umich.edu/node/1376
 Course Director: Dr. Kayvan Najarian (DCM&B, [email protected]) Lectures: Labs: Mondays and Wednesdays 9:00 AM -10:30 AM Rm. 2065 Palmer Commons Bldg. Wednesdays 10:30 AM 11:30 AM (alternate weeks) Rm.
Introduction to Machine Learning Lecture 1. Mehryar Mohri Courant Institute and Google Research [email protected]
 Introduction to Machine Learning Lecture 1 Mehryar Mohri Courant Institute and Google Research [email protected] Introduction Logistics Prerequisites: basics concepts needed in probability and statistics
Computing with Finite and Infinite Networks
 Computing with Finite and Infinite Networks Ole Winther Theoretical Physics, Lund University Sölvegatan 14 A, S-223 62 Lund, Sweden [email protected] Abstract Using statistical mechanics results,
Topological Data Analysis Applications to Computer Vision
 Topological Data Analysis Applications to Computer Vision Vitaliy Kurlin, http://kurlin.org Microsoft Research Cambridge and Durham University, UK Topological Data Analysis quantifies topological structures
Smoothing and Non-Parametric Regression
 Smoothing and Non-Parametric Regression Germán Rodríguez [email protected] Spring, 2001 Objective: to estimate the effects of covariates X on a response y nonparametrically, letting the data suggest
1 VECTOR SPACES AND SUBSPACES
 1 VECTOR SPACES AND SUBSPACES What is a vector? Many are familiar with the concept of a vector as: Something which has magnitude and direction. an ordered pair or triple. a description for quantities such
(Quasi-)Newton methods
Newton methods") (Quasi-)Newton methods 1 Introduction 1.1 Newton method Newton method is a method to find the zeros of a differentiable non-linear function g, x such that g(x) = 0, where g : R n R n. Given a starting
(Quasi-)Newton methods 1 Introduction 1.1 Newton method Newton method is a method to find the zeros of a differentiable non-linear function g, x such that g(x) = 0, where g : R n R n. Given a starting
Big Data Analytics: Optimization and Randomization
 Big Data Analytics: Optimization and Randomization Tianbao Yang, Qihang Lin, Rong Jin Tutorial@SIGKDD 2015 Sydney, Australia Department of Computer Science, The University of Iowa, IA, USA Department of
Social Media Mining. Data Mining Essentials
 Introduction Data production rate has been increased dramatically (Big Data) and we are able store much more data than before E.g., purchase data, social media data, mobile phone data Businesses and customers
LINEAR ALGEBRA W W L CHEN
 LINEAR ALGEBRA W W L CHEN c W W L Chen, 1997, 2008 This chapter is available free to all individuals, on understanding that it is not to be used for financial gain, and may be downloaded and/or photocopied,
Classification Techniques for Remote Sensing
 Classification Techniques for Remote Sensing Selim Aksoy Department of Computer Engineering Bilkent University Bilkent, 06800, Ankara [email protected] http://www.cs.bilkent.edu.tr/ saksoy/courses/cs551
Artificial Neural Networks and Support Vector Machines. CS 486/686: Introduction to Artificial Intelligence
 Artificial Neural Networks and Support Vector Machines CS 486/686: Introduction to Artificial Intelligence 1 Outline What is a Neural Network? - Perceptron learners - Multi-layer networks What is a Support
Part II Redundant Dictionaries and Pursuit Algorithms
 Aisenstadt Chair Course CRM September 2009 Part II Redundant Dictionaries and Pursuit Algorithms Stéphane Mallat Centre de Mathématiques Appliquées Ecole Polytechnique Sparsity in Redundant Dictionaries
Mathematics Course 111: Algebra I Part IV: Vector Spaces
 Mathematics Course 111: Algebra I Part IV: Vector Spaces D. R. Wilkins Academic Year 1996-7 9 Vector Spaces A vector space over some field K is an algebraic structure consisting of a set V on which are
CS Master Level Courses and Areas COURSE DESCRIPTIONS. CSCI 521 Real-Time Systems. CSCI 522 High Performance Computing
 CS Master Level Courses and Areas The graduate courses offered may change over time, in response to new developments in computer science and the interests of faculty and students; the list of graduate