GLOBAL CLOTHING B2C E-COMMERCE MARKET 2016
|
|
|
- Sophia Ferguson
- 7 years ago
- Views:
Transcription
1 PUBLICATION DATE: AUGUST 2016 PAGE 2 GENERAL INFORMATION I PAGE 3 KEY FINDINGS I PAGE 4-10 TABLE OF CONTENTS I PAGE 11 REPORT-SPECIFIC SAMPLE CHARTS I PAGE 12 METHODOLOGY I PAGE 13 RELATED REPORTS I PAGE 14 CLIENTS I PAGE FREQUENTLY ASKED QUESTIONS PAGE 17 ORDER FORM I PAGE 18 TERMS AND CONDITIONS 1
2 PRODUCT DETAILS Title: Type of Product: Category: Covered Regions: Covered Countries: Language: Formats: Number of Charts: Global Clothing B2C E-Commerce Market 2016 Market Report B2C E-Commerce Global Japan, South Korea, Australia, China, India, Indonesia, Thailand, UK, Germany, France, Spain, Italy, Russia, Poland, Turkey, USA, Canada, Brazil, Mexico, Argentina, Colombia, Chile, Peru, UAE, Saudi Arabia, Iran, Israel, Qatar, South Africa, Nigeria, Egypt, Morocco English PDF & PowerPoint 144 PRICES* Single User License: Site License: Global Site License: 2950 (exc. VAT) 4425 (exc. VAT) 5900 (exc. VAT) QUESTIONS ANSWERED IN THIS REPORT SECONDARY MARKET RESEARCH ADVANTAGES How is the clothing B2C E-Commerce market developing around the world? What is the standing of this category relative to other products in online retail? How large are the B2C E-Commerce sales of fashion products in some of the world s major markets? What important trends are forming in clothing B2C E-Commerce? Which online shopping websites for clothing are leading in various countries? Our reports are exclusively based on secondary market research. Our researchers derive information and data from a variety of reliable published sources and compile the data into understandable and easy-to-use formats. Maximum Objectivity Reliable Sources Up-To-Date Analysis Boardroom-Ready PowerPoint Presentations Guidance For Strategic Company Decisions 2 2
3 CLOTHING IS THE LEADING PRODUCT CATEGORY IN ONLINE SHOPPERS SHARE WORLDWIDE Fashion products were purchased by over one half of online shoppers worldwide in 2015, according to a survey cited in the ystats.com report. It is the number one product category in terms of online shoppers share in countries such as China, the USA, Brazil, Saudi Arabia, the UK, Russia and many others. In terms of online retail sales, however, it is often surpassed by categories with a higher value per item, such as electronics. Mobile commerce is an important contributor to the rise of fashion online retail. Worldwide, a combined share of more than 10% of online shoppers preferred mobile channels (phones and tablets) for buying apparel and footwear. Furthermore, the ystats.com research shows that clothing is popular with cross-border online shoppers around the world. Another important trend highlighted in the report is omnichannel commerce, as customers combine online, mobile and in-store channels on their way to a purchase of clothing. Online clothing stores such as HM.com, Asos.com and Zara.com were most popular with global Internet users, as of July Furthermore, online mass merchants and marketplaces are also active in this product segment, with Amazon projected to become the largest apparel seller in the USA by 2017, according to a forecast cited in the new report by ystats.com. 3
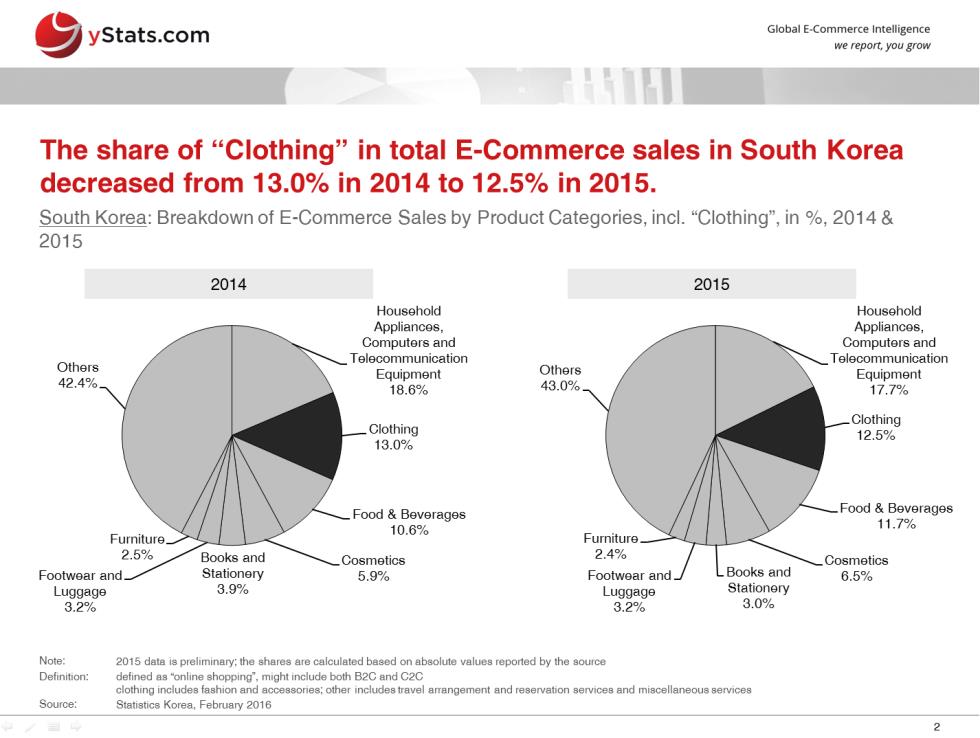
4 TABLE OF CONTENTS (1 OF 7) 1 2 MANAGEMENT SUMMARY GLOBAL DEVELOPEMENTS Product Categories Purchased Online, incl. Fashion-Related Products, in % of Online Shoppers, Q Product Categories Most Purchased Online, by Generation, incl. Apparel, in % of Online Shoppers, November 2015 Product Categories Purchased Cross-Border, incl. Clothing and Footwear, in % Cross-Border Online Shoppers, September 2015 Breakdown of Preferred Channels of Buying Clothing and Footwear, in % of Online Shoppers, September 2015 Top 20 Clothing E-Commerce Websites, by Website Rank, incl. Website Visits, in millions, Average Visit Duration, in minutes, Bounce Rate, in %, and Top 5 Countries by Share of Visits, in %, July ASIA-PACIFIC 3.1 ADVANCED MARKETS JAPAND Overview of Clothing B2C E-Commerce Market and Players, June 2016 B2C E-Commerce Sales of Clothing, in JPY billion, B2C E-Commerce Share of Total Retail Sales of Clothing, in %, Share of Online Shoppers Buying Clothes and Fashion-Related Products Online, in %, 2015 Top 10 Clothing E-Commerce Websites, by Website Rank, incl. Total Website Visits, in millions, Average Visit Duration, in minutes, Bounce Rate, in %, and Japan s Share of Total Visits, in %, July SOUTH KOREA E-Commerce Sales of Clothing, in KRW billion, 2014 & 2015 Breakdown of E-Commerce Sales by Product Categories, incl. Clothing, in %, 2014 & 2015 E-Commerce Share of Retail Sales, by Product Category, incl. Clothing, in %, 2014 & 2015 Product Categories Purchased Online, incl. General Apparel Merchandise, by PC and Mobile, in % of Online Shoppers, October 2015 Product Categories Purchased Cross-Border Online, incl. General Apparel Merchandise, in % of Cross-Border Online Shoppers, October AUSTRALIA Breakdown of Online Spending by Sector, incl. Fashion, in %, 2015 Breakdown of Online Clothing Spending, by Domestic and Overseas, by Spending by Men and Spending by Women, in AUD million, 2015 Top Product Categories Purchased Online, in % of Online Shoppers, 2014 &
5 TABLE OF CONTENTS (2 OF 7) 3 ASIA-PACIFIC (Cont.) 3.2 EMERGING MARKETS CHINA Overview of Clothing B2C E-Commerce Market, June 2016 B2C E-Commerce Sales of Clothing, in CNY billion, and in % Year-on-Year Change, Q Q Breakdown of Online Clothing Gross Merchandise Volume by B2C and C2C, in % and in CNY billion, H Product Categories Purchased Online, incl. Apparel & Footwear, in % of Online Shoppers, 2013 & 2014 Breakdown of the Usual Research and Purchase Behavior of Clothing Shoppers, in % of Clothing Shoppers, Q Breakdown of Clothing B2C E-Commerce Sales by Players, in %, Q Top 10 Clothing E-Commerce Websites, by Website Rank, incl. Total Website Visits, in millions, Average Visit Duration, in minutes, Bounce Rate, in %, and China s Share of Total Visits, in %, July INDIA Overview of Clothing B2C E-Commerce Market and Players, June 2016 B2C E-Commerce Sales of Apparel and Footwear, in INR billion, 2014 & 2015 Share of Online Shoppers Visiting Websites of Clothing and Accessories Retailers, in %, Breakdown of B2C E-Commerce Sales by Product Categories, incl. Clothing and Accessories, in %, 2015e & 2020f Top 10 Clothing E-Commerce Websites, by Website Rank, incl. Total Website Visits, in millions, Average Visit Duration, in minutes, Bounce Rate, in %, and India s Share of Total Visits, in %, July INDONESIA B2C E-Commerce Sales of Apparel and Footwear, in IDR billion, 2014, 2015e & 2019f Product Categories Purchased Online, incl. Fashion, in % of Online Shoppers, THAILAND Product Categories Purchased Online, incl. Fashion, in % of Online Shoppers, May EUROPE 4.1 REGIONAL Share of Online Shoppers Buying Clothing, Sports Goods Online, by EU Countries, Switzerland, Norway and Turkey, in % of Online Shoppers and in % of Individuals, 2014 &
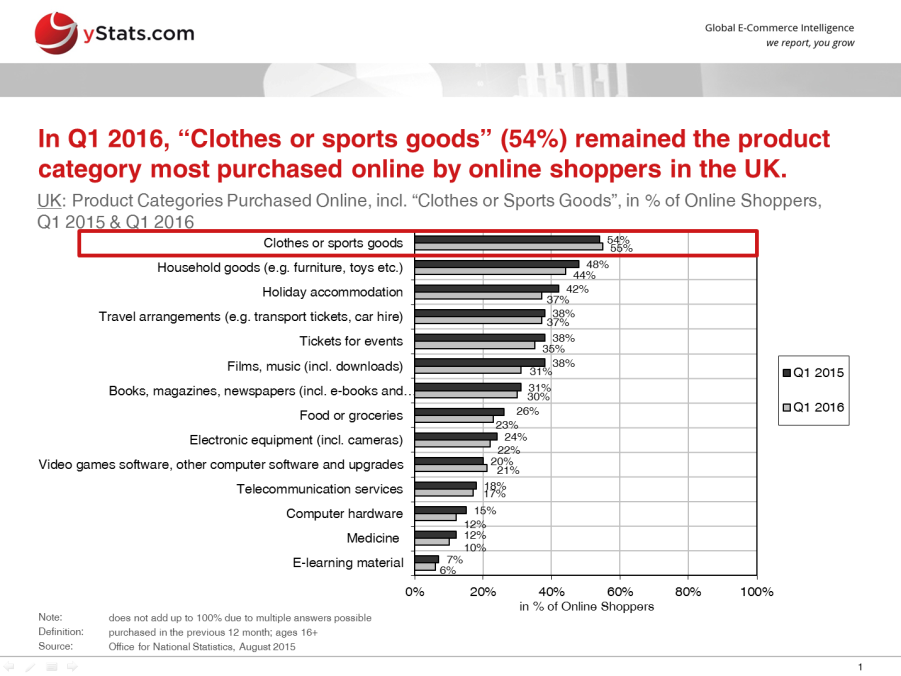
6 TABLE OF CONTENTS (3 OF 7) 4 EUROPE (Cont.) 4.2 ADVANCED MARKETS UK Overview of Clothing B2C E-Commerce Market, August 2016 B2C E-Commerce Sales of Clothing and Footwear, in GBP billion, B2C E-Commerce Share of Total Retail Sales of Clothing and Footwear, in %, and B2C E-Commerce Share of Total Retail Sales of Clothing, in %, 2015 & 2020f B2C E-Commerce Share of Total Retail Sales of Textile, Clothing and Footwear Retailers, Compared to B2C E- Commerce Share of Total Retail Sales, in %, & Q1-Q Product Categories Purchased Online, incl. Clothes or Sports Goods, in % of Online Shoppers, Q & Q Top 10 Clothing E-Commerce Websites, by Website Rank, incl. Total Website Visits, in millions, Average Visit Duration, in minutes, Bounce Rate, in %, and UK s Share of Total Visits, in %, July GERMANY Overview of Clothing B2C E-Commerce Market and Players, August 2016 B2C E-Commerce Sales of Clothing, in EUR billion, and Year-on-Year Change, in %, B2C E-Commerce Share of Total Retail Sales of Clothing, Shoes and Accessories, in %, 2015 & 2025f Product Categories Purchased Online, incl. Clothing and Sports Goods, in % of Online Shoppers, Q Top 5 Online Shops and Marketplaces to Purchase Clothing and Shoes, in % of Clothing Online Shoppers, October FRANCE B2C E-Commerce Sales, by Product Category, in EUR billion, and Share of Total Retail Sales in the Respective Category, in %, incl. Clothing, 2015 B2C E-Commerce Sales of Clothing, Shoes and Home Textile, in EUR billion, 2014 & 2015 Product Categories Purchased Online, in % of Online Shoppers, 2015 Product Categories Purchased Online via Desktop and Smartphone, incl. Clothing, in % of Internet Users and in % of Mobile Internet Users, H Breakdown of B2C E-Commerce Sales of Clothing by Retailer Types, in %, 12 Months to June SPAIN Breakdown of B2C E-Commerce Sales of Fashion by Sub-Categories, in % and in EUR million, 2015 B2C E-Commerce Share of Total Retail Sales of Clothing, Footwear, Accessories and Home Textiles, in Q Q Products Purchased Online, incl. Fashion, in % of Online Shoppers, 12 Months to November
7 TABLE OF CONTENTS (4 OF 7) 4 EUROPE (Cont.) 4.2 ADVANCED MARKETS (Cont.) ITALY B2C E-Commerce Sales of Clothing and Accessories, in EUR billion, 2015 & 2016f B2C E-Commerce Exports of Clothing and Accessories, in EUR billion, 2015 & 2016f B2C E-Commerce Share of Total Retail Sales of Clothing and Accessories, in %, 2015 & 2016f 4.3 EMERGING MARKETS RUSSIA B2C E-Commerce Sales of Clothing and Shoes, in RUB billion, 2014 & 2020f B2C E-Commerce Sales by Product Categories, incl. Clothing, Shoes, in RUB billion, 2013 & 2014 Product Categories Purchased Online, in % of Online Shoppers, incl. Clothing, Shoes, Sports Goods, 2014 & 2015 Breakdown of Cross-Border E-Commerce Imports by Product Categories, incl. Clothing and Shoes, in %, 2015 Top 10 Online Shops Specialized in Clothing, Shoes an Accessories, incl. E-Commerce Sales, in RUB million, Number of Orders, in thousands, and Average Check, in RUB, POLAND Product Categories Purchased Online, incl. Clothes, Sports Goods, in % of Online Shoppers, 2014 & 2015 Average Monthly Online Spending per Shopper, by Selected Product Categories, incl. Clothing and Accessories, in PLN, April 2015 Most Known E-Commerce Websites for Buying Clothing Online, in % of Internet Users, April TURKEY B2C E-Commerce Sales of Clothing and Footwear, in USD million, 2015 & 2020f Product Categories Purchased Online, incl. Clothes, Sports Goods, in % of Online Shoppers, by Gender, 12 Months to March NORTH AMERICA 5.1 USA Overview of Clothing B2C E-Commerce Market, August 2016 B2C E-Commerce Sales of Apparel and Accessories, in USD billion, 2014 & 2015e B2C E-Commerce Share of Total Retail Sales of Clothing, in %, 2014 & 2015 Top 3 Product Categories Purchased Online, in % of Online Shoppers, July
8 TABLE OF CONTENTS (5 OF 7) 5 NORTH AMERICA (Cont.) 5.1 USA (Cont.) Breakdown of Frequency of Clothing Online Shopping, in % of Clothing Online Shoppers, by Gender, April 2016 Breakdown of Online Shopping for Clothing Compared to In-Store, in % of Clothing Shoppers, by Gender, April 2016 Breakdown of Channels Used for Most of Clothing Purchases, incl. Online, in % of Clothing Buyers, by Men, Women and Total, 2015 Devices Used to Browse and Purchase Clothing Online, in % of Clothing Buyers, 2015 Top 10 Clothing E-Commerce Websites, by Website Rank, incl. Total Website Visits, in millions, Average Visit Duration, in minutes, Bounce Rate, in %, and USA s Share of Total Visits, in %, July CANADA B2C E-Commerce Sales of Clothing, in CAD billion, 2014, 2015e & 2018f Product Categories Purchased Online, incl. Clothing, in % of Online Shoppers, March Latin America 6 LATIN AMERICA 6.1 REGIONAL Product Categories Most Purchased Online, incl. Clothing, by Rank, by Argentina, Brazil, Chile, Colombia, Mexico, Peru, January BRAZIL Top 3 Product Categories Purchased Online, incl. Clothing, Shoes and Accessories, in % of Online Shoppers, October 2015 Top 3 Product Categories Purchased Online Cross-Border, incl. Clothing, Shoes and Accessories, in % of Cross- Border Online Shopping, October 2015 Breakdown of B2C E-Commerce Transactions, by Product Categories, in %, 2013 & 2015e Average Online Purchase Value, by Clothing, Shoes and Accessories, in BRL, by Gender, 2015e Share of Shoppers Who Showroom for Clothing and Related Products, in % of All Consumers Who Showroom, in %, Q Top 10 Clothing E-Commerce Websites, by Website Rank, incl. Total Website Visits, in millions, Average Visit Duration, in minutes, Bounce Rate, in %, and Brazil s Share of Total Visits, in %, July
9 TABLE OF CONTENTS (6 OF 7) 6 LATIN AMERICA (Cont.) 6.3 MEXICO Products Categories Purchased Online, in % of Online Shoppers, and Average Quarterly Spending per Category, in MXN, incl. Apparel and Accessories, Q Number of Recurring Online Shoppers Purchasing Fashion Online, in millions, Average Spending per Purchase, in MXN, and Estimated Annual Market Value, in MXN billion, October 2015 Top 3 Online Shops for Purchasing Clothing, in % of Clothing Online Shoppers, October ARGENTINA B2C E-Commerce Sales of Clothing, in ARS million, and Share of Total B2C E-Commerce Sales, in %, Top 3 Product Categories Purchased Online, incl. Footwear and Clothing, in % of Online Shoppers, H Product Categories Purchased Cross-Border, incl. Clothing, Footwear, Accessories, in % of Cross-Border Online Shoppers, 2015e 6.5 COLOMBIA Product Categories Purchased Online, incl. Clothing, in % of Online Shoppers, July CHILE Product Categories Purchased Online, incl. Clothing, Shoes, Food, Alcohol, in % of Online Shoppers, by Urban, Rural and Total, January PERU Product Categories Purchased Online, incl. Fashion and Accessories, in % of Online Shoppers, H Product Categories Purchased Online, incl. Clothing and Footwear, in % of Online Shoppers, MIDDLE EAST 7.1 REGIONAL Top 5 Product Categories Purchased Online, incl. Clothing, in % of Online Shoppers, by Kuwait, Saudi Arabia and the UAE, June 2016 Top 5 Online Shops Most Used by Online Shoppers in Arab Countries, incl. 2 Online Shops Specialized in Clothing, June UAE Top 10 Clothing E-Commerce Websites, by Website Rank, incl. Total Website Visits, in millions, Average Visit Duration, in minutes, Bounce Rate, in %, and UAE s Share of Total Visits, in %, July
10 TABLE OF CONTENTS (7 OF 7) 7 MIDDLE EAST (Cont.) 7.3 SAUDI ARABIA Product Categories Most Purchased Online Cross-Border, incl. Clothing, Accessories and Footwear, in % of Cross- Border Online Shoppers, April IRAN Product Categories Purchased Online, incl. Clothing, in % of Online Shoppers, 2012 & 2015 Top 5 Product Categories that Online Shoppers in Iran Expect to Have a Greater Access to in the Next Six Months, incl. Clothing, in % of Online Shoppers, January ISRAEL Product Categories Purchased Online, incl. Clothes, in % of Online Shoppers, July QATAR Breakdown of B2C E-Commerce Sales, by Product Category, incl. Fashion and Lifestyle, in %, AFRICA 8.1 SOUTH AFRICA B2C E-Commerce Sales of Apparel and Footwear, in USD million, 2014 & 2019f Product Categories Purchased Online, incl. Clothes and Accessories, in % of Online Shoppers, October 2015 Top 10 Clothing E-Commerce Websites, by Website Rank, incl. Total Website Visits, in millions, Average Visit Duration, in minutes, Bounce Rate, in %, and South Africa s Share of Total Visits, in %, July NIGERIA B2C E-Commerce Sales of Apparel and Footwear, in USD million, 2014 & 2019f Top 3 Product Categories Purchased Online, in % of Online Shoppers, October EGYPT Top 5 Product Categories Purchased Online, incl. Clothes, in % of Online Shoppers, June MOROCCO Product Categories Purchased Online, Clothing, Beauty Products, in % of Online Shoppers, February
11 REPORT-SPECIFIC SAMPLE CHARTS 11 11
12 GENERAL METHODOLOGY OF OUR MARKET REPORTS Secondary Market Research The reports are compiled based on secondary market research. Secondary research is information gathered from previously published sources. Our reports are solely based on information and data acquired from national and international statistical offices, industry and trade associations, business reports, business and company databases, journals, company registries, news portals and many other reliable sources. By using various sources we ensure maximum objectivity for all obtained data. As a result, companies gain a precise and unbiased impression of the market situation. Cross referencing of data is conducted in order to ensure validity and reliability. The source of information and its release date are provided on every chart. It is possible that the information contained in one chart is derived from several sources. If this is the case, all sources are mentioned on the chart. The reports include mainly data from the last 12 months prior to the date of report publication. Exact publication dates are mentioned in every chart. Definitions The reports take into account a broad definition of B2C E-Commerce, which might include mobile commerce. As definitions may vary among sources, exact definition used by the source (if available) is included at the bottom of the chart. Chart Types Our reports include text charts, pie charts, bar charts, rankings, line graphs and tables. Every chart contains an Action Title, which summarizes the main idea/finding of the chart and a Subtitle, which provides necessary information about the country, the topic, units or measures of currency, and the applicable time period(s) to which the data refers. With respect to rankings, it is possible that the summation of all categories amounts to more than 100%. In this case, multiple answers were possible, which is noted at the bottom of the chart. Report Structure Reports are comprised of the following elements, in the following order: Cover page, preface, legal notice, methodology, definitions, table of contents, management summary (summarizing main information contained in each section of report) and report content (divided into sections and chapters). When available, we also include forecasts in our report content. These forecasts are not our own; they are published by reliable sources. Within Global and Regional reports, we include all major developed and emerging markets, ranked in order of importance by using evaluative criteria such as sales figures. Notes and Currency Values If available, additional information about the data collection, for example the time of survey and number of people surveyed, is provided in the form of a note. In some cases, the note (also) contains additional information needed to fully understand the contents of the respective data. When providing information about amounts of money, local currencies are most often used. When referencing currency values in the Action Title, the EUR values are also provided in brackets. The conversions are always made using the average currency exchange rate for the respective time period. Should the currency figure be in the future, the average exchange rate of the past 12 months is used. METHODOLOGY OF OUR GLOBAL CLOTHING B2C E-COMMERCE MARKET 2016 REPORT Report Coverage This report covers the global B2C E-Commerce market for clothing. It takes into account a wide definition of the clothing segment, including products referred to as apparel, fashion, clothing, accessories and footwear. It takes into account a wide definition of the clothing segment, including products referred to as apparel, fashion, clothing, accessories and footwear. The exact definition of the segment covered on each particular chart may differ depending on the original source used. Besides sales figures, penetration and rankings, this report also reveals important market trends that affect clothing B2C E-Commerce, such as mobile, cross-border and omnichannel shopping. All global regions are covered in this report, including Africa, Asia-Pacific, Europe, Latin America, the Middle East and North America. Report Structure The global chapter opens the report, including an overview of global market developments and trends. The rest of the report is divided by regions. The regions are presented in the order of descending total B2C E-Commerce sales. Where applicable, the countries in the regions are grouped by advanced and emerging markets. The countries are also presented in the order of descending total B2C E-Commerce sales. Within the country chapters, the following information is covered, where available: B2C E-Commerce sales of clothing, the share of online shoppers buying clothing online and the rank of this category among other product categories, the share of B2C E- Commerce on total retail sales of clothing and the share of clothing on total B2C E-Commerce sales. Not all types of information mentioned are provided for each country, due to varying data availability. For the top countries in each region, a ranking of E-Commerce websites specialized in clothing is included. For selected leading B2C E-Commerce markets, a text chart with qualitative overview of the online clothing market, trends and players is provided. 12
13 Europe Clothing B2C E-Commerce Market 2016 August Asia-Pacific Clothing B2C E-Commerce Market 2016 July Top Players in Global B2C E-Commerce Market 2016 July Trends in Worldwide Internet Retail 2016 July ,450 Online Retail in Emerging Markets 2016 June ,450 Global B2C E-Commerce Market 2016 June ,950 Global Online Payment Methods: Full Year 2015 February ,950 Global Delivery B2C E-Commerce Market 2015 October ,950 Global Cross-Border B2C E-Commerce Market 2015 August ,950 Africa B2C E-Commerce Market 2016 May ,950 Middle-East B2C E-Commerce Market 2016 May ,950 Latin America B2C E-Commerce Market 2016 March ,950 Europe B2C E-Commerce Market 2016 February ,950 Western Europe B2C E-Commerce Market 2016 February ,950 Eastern Europe B2C E-Commerce Market 2016 January ,950 Central Asia and Caucasus B2C E-Commerce Market 2015 November ,450 North America B2C E-Commerce Market 2015 November Asia-Pacific B2C E-Commerce Market 2015 October ,450 Southeast Asia B2C E-Commerce Market 2015 September ,950 UPCOMING RELATED REPORTS REPORT PUBLICATION DATE PRICE* Global Online Payment Methods: First Half 2016 September ,950 Global Cross-Border B2C E-Commerce 2016 Quarter ,950 13
14 14
15 15
16 16
17 17
18 18
GLOBAL B2C E-COMMERCE DELIVERY 2015
 PUBLICATION DATE: OCTOBER 2015 PAGE 2 GENERAL INFORMATION I PAGE 3 KEY FINDINGS I PAGE 4-8 TABLE OF CONTENTS I PAGE 9 REPORT-SPECIFIC SAMPLE CHARTS I PAGE 10 METHODOLOGY I PAGE 11RELATED REPORTS I PAGE
GLOBAL ONLINE PAYMENT METHODS: FIRST HALF 2015
 PUBLICATION DATE: JULY 2015 PAGE 2 GENERAL INFORMATION I PAGE 3 KEY FINDINGS I PAGE 4-9 TABLE OF CONTENTS I PAGE 10 REPORT-SPECIFIC SAMPLE CHARTS I PAGE 11 METHODOLOGY I PAGE 12 RELATED REPORTS I PAGE
THAILAND B2C E-COMMERCE MARKET 2015
 PUBLICATION DATE: AUGUST 2015 PAGE 2 GENERAL INFORMATION I PAGE 3 KEY FINDINGS I PAGE 4-5 TABLE OF CONTENTS I PAGE 6 REPORT-SPECIFIC SAMPLE CHARTS I PAGE 7 METHODOLOGY I PAGE 8 RELATED REPORTS I PAGE 9
GLOBAL MOBILE PAYMENT METHODS: FIRST HALF 2015
 PUBLICATION DATE: AUGUST 2015 PAGE 2 GENERAL INFORMATION I PAGE 3 KEY FINDINGS I PAGE 4-8 TABLE OF CONTENTS I PAGE 9 REPORT-SPECIFIC SAMPLE CHARTS I PAGE 10 METHODOLOGY I PAGE 11 RELATED REPORTS I PAGE
PHILIPPINES B2C E-COMMERCE MARKET 2015
 PUBLICATION DATE: AUGUST 2015 PAGE 2 GENERAL INFORMATION I PAGE 3 KEY FINDINGS I PAGE 4-5 TABLE OF CONTENTS I PAGE 6 REPORT-SPECIFIC SAMPLE CHARTS I PAGE 7 METHODOLOGY I PAGE 8 RELATED REPORTS I PAGE 9
VIETNAM B2C E-COMMERCE MARKET 2015
 PUBLICATION DATE: AUGUST 2015 PAGE 2 GENERAL INFORMATION I PAGE 3 KEY FINDINGS I PAGE 4-5 TABLE OF CONTENTS I PAGE 6 REPORT-SPECIFIC SAMPLE CHARTS I PAGE 7 METHODOLOGY I PAGE 8 RELATED REPORTS I PAGE 9
GLOBAL B2C E-COMMERCE MARKET 2014. October 2014
 GLOBAL B2C E-COMMERCE MARKET 2014 October 2014 General Information Product Details Language: English Format: PDF & Power Point Number of Pages/Charts: 1051 Covered Countries/Regions: Global, North America,
GLOBAL ONLINE GAMING MARKET 2015. April 2015
 GLOBAL ONLINE GAMING MARKET 2015 April 2015 Global Online Gaming2015 General Information Product Details Language: English Format: PDF & Power Point Number of Pages/Charts: 149 Covered Countries/Regions:
GLOBAL CROSS-BORDER B2C E-COMMERCE 2014. April 2014
 GLOBAL CROSS-BORDER B2C E-COMMERCE 2014 April 2014 General Information Product Details Language: English Format: PDF & Power Point Number of Pages/Charts: 129 Covered Countries/Regions: Global, North America,
OMNICHANNEL TREND IN GLOBAL B2C E-COMMERCE AND GENERAL RETAIL 2015. March 2015
 OMNICHANNEL TREND IN GLOBAL B2C E-COMMERCE AND GENERAL RETAIL 2015 March 2015 General Information Product Details Language: English Format: PDF & Power Point Number of Pages/Charts: 52 Covered Countries/Regions:
FRAUD IN GLOBAL B2C E-COMMERCE & ONLINE PAYMENT 2014. October 2014
 FRAUD IN GLOBAL B2C E-COMMERCE & ONLINE PAYMENT 2014 October 2014 General Information Product Details Language: English Format: PDF & Power Point Number of Pages/Charts: 77 Covered Countries/Regions: Global,
Global Online Payment Methods: First Half 2015
 Brochure More information from http://www.researchandmarkets.com/reports/3378379/ Global Online Payment Methods: First Half 2015 Description: Around the world, the online and mobile payments environments
Global Alternative Online Payment Methods: First Half 2015
 Brochure More information from http://www.researchandmarkets.com/reports/3378010/ Global Alternative Online Payment Methods: First Half 2015 Description: An important trend in the global online payment
ASIA-PACIFIC ONLINE PAYMENT METHODS: FULL YEAR 2014. March 2015
 ASIA-PACIFIC ONLINE PAYMENT METHODS: FULL YEAR 2014 March 2015 General Information Product Details Language: English Format: PDF & Power Point Number of Pages/Charts: 98 Covered Countries/Regions: Asia-Pacific,
GLOBAL ONLINE GAMBLING AND BETTING MARKET 2015. May 2015
 GLOBAL ONLINE GAMBLING AND BETTING MARKET 2015 May 2015 General Information Product Details Language: English Format: PDF & Power Point Number of Pages/Charts: 65 Covered Countries/Regions: Global, Asia-Pacific,
B2C E-COMMERCE & ONLINE PAYMENT MARKET REPORTS
 B2C E-COMMERCE & ONLINE PAYMENT MARKET REPORTS twitter.com/ystats linkedin.com/company/ystats gplus.to/ystatscom facebook.com/ystats Contents: Page 02 Page 03 Pages 04-05 Pages 06-07 Page 08 Page 09 Page
PAKISTAN B2C E-COMMERCE MARKET 2015. January 2015
 PAKISTAN B2C E-COMMERCE MARKET 2015 January 2015 General Information Product Details Language: English Format: PDF & Power Point Number of Pages/Charts: 69 Covered Countries/Regions: Pakistan Prices Single
DIGITAL RIVER WORLD PAYMENTS COMPANY PROFILE 2015: ONLINE PAYMENT SERVICES. Publication Date: June 2015
 DIGITAL RIVER WORLD PAYMENTS COMPANY PROFILE 2015: ONLINE PAYMENT SERVICES Publication Date: June 2015 General Information Product Details Language: English Format: PDF & Power Point Number of Pages/Charts:
Sulfuric Acid 2013 World Market Outlook and Forecast up to 2017
 Brochure More information from http://www.researchandmarkets.com/reports/2547547/ Sulfuric Acid 2013 World Market Outlook and Forecast up to 2017 Description: Sulfuric Acid 2013 World Market Outlook and
FACT SHEET Global Direct Selling
 Global 2011 Global Retail Sales: USD $153,727 million Global Sales Force The 91.5 million Direct Sellers who represent companies around the world are: 3 2 16% 9% 2% 3% 2% 3% 2% 3% Care 42% 2% 56% 3% 2
WORLDWIDE RETAIL ECOMMERCE SALES: EMARKETER S UPDATED ESTIMATES AND FORECAST THROUGH 2019
 WORLDWIDE RETAIL ECOMMERCE SALES: EMARKETER S UPDATED ESTIMATES AND FORECAST THROUGH 2019 Worldwide retail sales including in-store and internet purchases will surpass $22 trillion in 2015, up 5.6% from
How To Rank The World'S Largest E Commerce Companies
 THE WORLD s LEADING E-COMMERCE COMPANIES 2014 October 2014 General Information Product Details Language: English Format: PDF & Power Point Number of Pages/Charts: 18 Covered Countries/Regions: Global,
State of Mobile Commerce. Q1 2015
 State of Mobile Commerce. Q1 2015 MARCH 2015 Executive Summary Mobile commerce is growing like a weed. Mobile is now 29% of ecommerce transactions in the US and 34% globally. Mobile shopping trends ecommerce
State of Mobile Commerce Growing like a weed
 State of Mobile Commerce Growing like a weed Q1 2015 Executive Summary Mobile commerce is growing like a weed. Mobile is 29% of ecommerce transactions in the US and 34% globally. By the end of 2015, mobile
GLOBAL ONLINE GAMBLING AND BETTING MARKET 2014. March 2014
 GLOBAL ONLINE GAMBLING AND BETTING MARKET 2014 March 2014 General Information Product Details Language: Format: Number of Pages/Charts: 56 Covered Countries: English PDF & Power Point USA, Canada, Mexico,
GLOBAL CONNECTED COMMERCE
 GLOBAL CONNECTED COMMERCE CONSUMER PURCHASING IN TODAY S DIGITAL ECONOMY Carlina Johnson, Nielsen New Business Development & Ecommerce Leader April 22, 2016 ONLINE SHOPPING HAS EXPANDED BEYOND DURABLE
GWI Commerce Summary Q2 2014
 GWI Commerce Summary Q2 2014 GlobalWebIndex s quarterly report on the latest trends in e-, m- and t-commerce 1 Introduction GWI Commerce is where GlobalWebIndex presents the very latest figures for online
Making Leaders Successful Every Day
 Making Leaders Successful Every Day Succeeding In Global ecommerce Forrester Research Benjamin Ensor Research Director, ebusiness & Channel Strategy March 13, 2013 For internal use only Agenda What s the
Copyright 2015 Criteo. State of Mobile Commerce Apps and cross-device lead mobile business Q2 2015
 State of Mobile Commerce Apps and cross-device lead mobile business Q2 2015 Mobile Commerce Report Methodology Individual transaction data analyzed How can marketers use this data? Over 3,000 online retail
NRF 2015 Global Ecommerce: It s a Small World After All
 NRF 2015 Global Ecommerce: It s a Small World After All #nrf15 @FitForCommerce @PitneyBowesEcommerce FitForCommerce is a consultancy founded to help online and omnichannel businesses figure out what they
STATE OF GLOBAL E-COMMERCE REPORT (Preview) February 2013
 February 2013") STATE OF GLOBAL E-COMMERCE REPORT (Preview) February 2013 THE E-COMMERCE REPORT WHAT IS THE E-COMMERCE REPORT? It is an annual investigation into the global uptake and impact of e- commerce. The report
STATE OF GLOBAL E-COMMERCE REPORT (Preview) February 2013 THE E-COMMERCE REPORT WHAT IS THE E-COMMERCE REPORT? It is an annual investigation into the global uptake and impact of e- commerce. The report
2015 Country RepTrak The World s Most Reputable Countries
 2015 Country RepTrak The World s Most Reputable Countries July 2015 The World s View on Countries: An Online Study of the Reputation of 55 Countries RepTrak is a registered trademark of Reputation Institute.
Merchant's Default Payout in local currency
 HiPay Mobile - 1 - EUROPE - AUSTRIA - Direct Carrier Billing Local EUR 1,10 0,92 Activated 0,3328 EUR 2,00 1,67 Activated 0,6870 EUR 3,00 2,50 Activated 1,1250 EUR 4,00 3,33 Activated 1,6797 EUR 5,00 4,17
E-Commerce - Global Outlook
 Brochure More information from http://www.researchandmarkets.com/reports/338331/ E-Commerce - Global Outlook Description: The global outlook series on E-Commerce provides a collection of statistical anecdotes,
Open Doors 2013. Report on International Educational Exchange. Produced by the Institute of International Education. In partnership with the
 Open Doors 2013 Report on International Educational Exchange Produced by the Institute of International Education In partnership with the Bureau of Educational and Cultural Affairs U.S. Department of State
GLOBAL DATA CENTER INVESTMENT 2013
 2013 CENSUS REPORT: Global Data Center Investment 2013 GLOBAL DATA CENTER INVESTMENT 2013 2013 - Healthy Growth in Data Center Investment Globally Globally, the data center industry has continued to maintain
UK Television Exports FY 2014/2015
 UK Television Exports FY 2014/2015 Page 1 of 5 The annual UK Television Exports Survey highlights the popularity of UK programming abroad by collecting revenue figures relating to the international activity
Global Luxury B2C E-Commerce Snapshot 2014
 Brochure More information from http://www.researchandmarkets.com/reports/2932975/ Global Luxury B2C E-Commerce Snapshot 2014 Description: The report Global Luxury B2C E-Commerce Snapshot 2014 reveals that
Appendix 1: Full Country Rankings
 Appendix 1: Full Country Rankings Below please find the complete rankings of all 75 markets considered in the analysis. Rankings are broken into overall rankings and subsector rankings. Overall Renewable
HAS BRAZIL REALLY TAKEN OFF? BRAZIL LONG-RUN ECONOMIC GROWTH AND CONVERGENCE
 HAS BRAZIL REALLY TAKEN OFF? BRAZIL LONG-RUN ECONOMIC GROWTH AND CONVERGENCE COUNTRY PROFILE: A COUNTRY IN TRANSFORMATION POLICY RECOMENDATIONS COUNTRY PROFILE Brazilian Equivalent Population in The World
World Consumer Income and Expenditure Patterns
 World Consumer Income and Expenditure Patterns 2014 14th edi tion Euromonitor International Ltd. 60-61 Britton Street, EC1M 5UX TableTypeID: 30010; ITtableID: 22914 Income Algeria Income Algeria Income
Global Effective Tax Rates
 www.pwc.com/us/nes Global s Global s April 14, 2011 This document has been prepared pursuant to an engagement between PwC and its Client. As to all other parties, it is for general information purposes
Excerpt Sudan Fixed Telecommunications: Low Penetration Rates Get a Boost from Broadband Internet and VoIP Services
 Excerpt Sudan Fixed Telecommunications: Low Penetration Rates Get a Boost from Broadband Internet and VoIP Services This report is part of Pyramid Research s series of Africa & Middle East Country Intelligence
Triple-play subscriptions to rocket to 400 mil.
 Triple-play criptions to rocket to 400 mil. Global triple-play criptions will reach 400 million by 2017; up by nearly 300 million on the end-2011 total and up by 380 million on the 2007 total, according
November. Summary: Global Payments
 November 2014 Executive Summary: Global Payments Global Payment Growth Fueled by Cross-Border and Mobile Commerce By Tim Parry Global ecommerce is expected to top $1.25 trillion U.S. by the end of 2014,
GfK PURCHASING POWER INTERNATIONAL
 GfK PURCHASING POWER INTERNATIONAL 1 Agenda 1. Europe 3 2. Americas 45 3. Asia & Near East 54 4. Afrika 66 5. Australia 68 6. Overview of countries and available levels 70 2 2 EUROPE 4 GfK
Global Dynamism Index (GDI) 2013 summary report. Model developed by the Economist Intelligence Unit (EIU)
 2013 summary report. Model developed by the Economist Intelligence Unit (EIU)") Global Dynamism Index (GDI) 2013 summary report Model developed by the Economist Intelligence Unit (EIU) What is the Global Dynamism Index (GDI)? the GDI assesses the dynamism of 60 of the world's largest
Global Dynamism Index (GDI) 2013 summary report Model developed by the Economist Intelligence Unit (EIU) What is the Global Dynamism Index (GDI)? the GDI assesses the dynamism of 60 of the world's largest
2012 Country RepTrak Topline Report
 2012 Country RepTrak Topline Report The World s View on Countries: An Online Study of the Reputation of 50 Countries RepTrak is a registered trademark of Reputation Institute. Global Reputation Knowledge
List of tables. I. World Trade Developments
 List of tables I. World Trade Developments 1. Overview Table I.1 Growth in the volume of world merchandise exports and production, 2010-2014 39 Table I.2 Growth in the volume of world merchandise trade
The Global Chemical Industry: US, China and Global Status and Opportunities, 2015
 The Global Chemical Industry: US, China and Global Status and Opportunities, 2015 August 28, 2005 American Chemical Society Martha Gilchrist Moore Moore Economics mmoore@mooreeconomics.com Opportunities
FTSE Global Small Cap Index
 FTSE FACTSHEET FTSE Global Small Cap Index bmktitle1 The FTSE Global Small Cap Index is derived from FTSE's flagship Global Equity Series universe, which comprises around 7,000 securities worldwide, giving
2015 The Global E-Commerce Payments Guide
 2015 The Global E-Commerce Payments Guide The global e-commerce market is projected to grow to $1.7 trillion in 2015, and reach over $2 trillion by 2017. Over this period, cross-border e-commerce (where
The big pay turnaround: Eurozone recovering, emerging markets falter in 2015
 The big pay turnaround: Eurozone recovering, emerging markets falter in 2015 Global salary rises up compared to last year But workers in key emerging markets will experience real wage cuts Increase in
Trade Credit Insurance in Major Global Markets
 Trade Credit Insurance in Major Global Markets Series prospectus for an overview plus ten country-specific reports AUSTRALIA, BRAZIL, CANADA, CHINA, INDIA, JAPAN, MIDDLE EAST, RUSSIA, SOUTH AFRICA, USA
Copyright 2015 Criteo. State of Mobile Commerce Apps and cross-device lead mobile business Q2 2015
 State of Mobile Commerce Apps and cross-device lead mobile business Q2 2015 Mobile Commerce Report Methodology Individual transaction data analyzed How can marketers use this data? Over 3,000 online retail
SEIZING THE OPPORTUNITY IN INTERNATIONAL MARKETS
 WHITE PAPER SEIZING THE OPPORTUNITY IN INTERNATIONAL MARKETS A practical guide to choosing the right s and languages 2014 Lionbridge INTRODUCTION If your app for Windows Phone is doing well at home, now
Online Marketing Institute London, Feb 2012 Mike Shaw Director, Marketing Solutions
 The State of Social Media Online Marketing Institute London, Feb 2012 Mike Shaw Director, Marketing Solutions comscore s Innovative Approach Revolutionizes Measurement 2 Million Person Panel 360 View of
2015 Growth in data center employment continues but the workforce is changing
 Published in Conjunction with MARKET BRIEFING GLOBAL DATA CENTER EMPLOYMENT 2015 2015 Growth in data center employment continues but the workforce is changing Globally, the number of people working in
State of Mobile Commerce.
 State of Mobile Commerce. Apps and cross-device lead mobile business Q2 2015 JUNE 2015 Executive summary Consumer mobile behavior continues to advance faster than retailers ability to keep up. Key takeaways
I. World trade developments
 I. World trade developments The value of world merchandise exports increased by 20 per cent in 2011 while exports of commercial services grew by 11 per cent. Key developments in 2011: a snapshot Trade
Verdict Financial: Wealth Management. Data Collection and Forecasting Methodologies
 Verdict Financial: Wealth Management Data Collection and Forecasting Methodologies April 2014 Contents Global Wealth Markets Methodology Methodology Methodology 2 Global Wealth Markets Section 1: Global
MAUVE GROUP GLOBAL EMPLOYMENT SOLUTIONS PORTFOLIO
 MAUVE GROUP GLOBAL SOLUTIONS PORTFOLIO At Mauve Group, we offer a variety of complete employee management services such as Global Employment Solutions (GES), Professional Employment Outsourcing (PEO),
Axioma Risk Monitor Global Developed Markets 29 June 2016
 Axioma Risk Monitor Global Developed Markets 29 June 2016 1. Global volatility hotspots 2. Global correlation hotspots www.axioma.com Greater than 1% rise over last week Greater than 1% fall over last
The Role of Banks in Global Mergers and Acquisitions by James R. Barth, Triphon Phumiwasana, and Keven Yost *
 The Role of Banks in Global Mergers and Acquisitions by James R. Barth, Triphon Phumiwasana, and Keven Yost * There has been substantial consolidation among firms in many industries in countries around
Send Money Africa sendmoneyafrica.worldbank.org
 Send Money Africa sendmoneyafrica.worldbank.org October 2013 1I ll The World Bank SMA is funded by the AIR Project This report 1 identifies and analyzes trends in the cost of sending money to and within
What Proportion of National Wealth Is Spent on Education?
 Indicator What Proportion of National Wealth Is Spent on Education? In 2008, OECD countries spent 6.1% of their collective GDP on al institutions and this proportion exceeds 7.0% in Chile, Denmark, Iceland,
Global Learning Management System (LMS) Market Analysis & Trends - Industry Forecast to 2020
 Market Analysis & Trends - Industry Forecast to 2020") Brochure More information from http://www.researchandmarkets.com/reports/3548942/ Global Learning Management System (LMS) Market Analysis & Trends - Industry Forecast to 2020 Description: The Global Learning
Brochure More information from http://www.researchandmarkets.com/reports/3548942/ Global Learning Management System (LMS) Market Analysis & Trends - Industry Forecast to 2020 Description: The Global Learning
Foreign Taxes Paid and Foreign Source Income INTECH Global Income Managed Volatility Fund
 Income INTECH Global Income Managed Volatility Fund Australia 0.0066 0.0375 Austria 0.0045 0.0014 Belgium 0.0461 0.0138 Bermuda 0.0000 0.0059 Canada 0.0919 0.0275 Cayman Islands 0.0000 0.0044 China 0.0000
Supported Payment Methods
 Supported Payment Methods Global In the global payments market, credit cards are the most popular payment method. However, BlueSnap expands the payment selection by including not only the major credit
State of Mobile Commerce. Cross-device shopping starts and ends on mobile Q3 2015
 State of Mobile Commerce Cross-device shopping starts and ends on mobile Q3 2015 Brazil State of Mobile Commerce Q3 Highlights Criteo s analysis of shopping data from Q3 2015 demonstrates that smartphones
Global AML Resource Map Over 2000 AML professionals
 www.pwc.co.uk Global AML Resource Map Over 2000 AML professionals January 2016 Global AML Resources: Europe France Italy Jersey / Guernsey 8 Ireland 1 Portugal 7 Luxembourg 5 United Kingdom 1 50 11 Spain
www.pwc.co.uk/economics Global wage projections to 2030 September 2013
 www.pwc.co.uk/economics Global wage projections to 2030 Summary: Wage gap between emerging and advanced economies will shrink significantly by 2030 By 2030, our projections in this report suggest that
Global Online Gambling and Betting Market 2015
 Brochure More information from http://www.researchandmarkets.com/reports/3215407/ Global Online Gambling and Betting Market 2015 Description: The latest publication Global Online Gambling and Betting Market
State of Mobile Commerce
 State of Mobile Commerce Leading mobile retailers dominate and the gap is growing Netherlands - Q4 2015 State of Mobile Commerce Q4 Highlights Criteo s analysis of shopping data from Q4 2015 demonstrates
Open Doors 2011 Report on International Educational Exchange
 Open Doors 2011 Report on International Educational Exchange Produced by the Institute of International Education with support from the Bureau of Educational and Cultural Affairs of the U.S. Department
Supported Payment Methods
 Sell Globally in a Snap Supported Payment Methods Global In the global payments market, credit cards are the most popular payment method. However, BlueSnap expands the payment selection by including not
DIY Industry - Global Outlook
 Brochure More information from http://www.researchandmarkets.com/reports/661677/ DIY Industry - Global Outlook Description: The global outlook series on the DIY Industry provides a collection of statistical
State of Mobile Commerce.
 State of Mobile Commerce. Leading mobile retailers dominate - and the gap is growing Q4 2015 FEBRUARY 2016 Executive summary Criteo s analysis of shopping data from Q4 2015 demonstrates that mobile is
Global Expatriates: Size, Segmentation and Forecast for the Worldwide Market
 Global Expatriates: Size, Segmentation and Forecast for the Worldwide Market Report Prospectus January 2014 Finaccord Ltd., 2014 Web: www.finaccord.com. E-mail: info@finaccord.com 1 Prospectus contents
BT Premium Event Call and Web Rate Card
 BT Managed Event and BT Self-Managed Event (also referred to as Express, Plus and Premium) Conference Bridge and Call for Booked Audio Conferencing Services will comprise the following for each phone-conference:
Credit & Debit Card Payments. Factsheet
 Credit & Debit Card Payments Factsheet Contents 1. Card Types... 2 2. Supported countries... 2 3. First Funding via Credit / Debit Card... 3 4. Transaction Currencies... 4 5. Currency Conversion... 4 6.
Consolidated International Banking Statistics in Japan
 Total (Transfer Consolidated cross-border claims in all currencies and local claims in non-local currencies Up to and including one year Maturities Over one year up to two years Over two years Public Sector
Consumer Credit Worldwide at year end 2012
 Consumer Credit Worldwide at year end 2012 Introduction For the fifth consecutive year, Crédit Agricole Consumer Finance has published the Consumer Credit Overview, its yearly report on the international
Introducing GlobalStar Travel Management
 Introducing GlobalStar Travel Management GlobalStar is a worldwide travel management company owned and managed by local entrepreneurs. In total over 80 market leading enterprises, representing over US$13
Clinical Trials. Local Trial Requirements
 Clinical Trials Clinical trials insurance covers the legal liabilities of the insured in respect of clinical trials for bodily injury arising from the trial. The coverage provided by Newline is on the
Life Bancassurance in Latin America: Protection-Related Life Insurance
 Life Bancassurance in Latin America: Protection-Related Life Insurance Report Prospectus April 2013 Finaccord, 2013 Web: www.finaccord.com. E-mail: info@finaccord.com 1 Prospectus contents Page What is
U.S. Trade Overview, 2013
 U.S. Trade Overview, 213 Stephanie Han & Natalie Soroka Trade and Economic Analysis Industry and Analysis Department of Commerce International Trade Administration October 214 Trade: A Vital Part of the
Brochure More information from http://www.researchandmarkets.com/reports/1339929/
 Brochure More information from http://www.researchandmarkets.com/reports/1339929/ The 2011 World Forecasts of Machine Tools That Remove Material by Laser or Light, Photon, Ultrasonic, Electro-Discharge,
Dow Jones Titans Indices Methodology
 Dow Jones Titans Indices Methodology March 2014 S&P Dow Jones Indices: Index Methodology Table of Contents Introduction 4 Highlights and Index Family 4 Eligibility Criteria and Index Construction 7 Dow
What Is the Total Public Spending on Education?
 What Is the Total Public Spending on Education? Indicator On average, OECD countries devote 12.9% of total public expenditure to, but values for individual countries range from less than 10% in the Czech
CONSIDERATIONS WHEN CONSTRUCTING A FOREIGN PORTFOLIO: AN ANALYSIS OF ADRs VS ORDINARIES
 THE APERIO DIFFERENCE. Authors Michael Branch, CFA Ran Leshem CONSIDERATIONS WHEN CONSTRUCTING A FOREIGN PORTFOLIO: AN ANALYSIS OF ADRs VS ORDINARIES U.S. investors can capture international equity exposure
Fiscal Year 2014 Unicharm Presentation Materials for Investor Meeting April 30, 2014 Takahisa Takahara President and CEO Unicharm Corporation
 Fiscal Year 214 Unicharm Presentation Materials for Investor Meeting April 3, 214 Takahisa Takahara President and CEO Unicharm Corporation Projections stated herein include those based on the Company s
Broadcasting Industry - Global Outlook
 Brochure More information from http://www.researchandmarkets.com/reports/661646/ Broadcasting Industry - Global Outlook Description: The global outlook series on the Broadcasting Industry provides a collection
Whitepaper Online Selling in China in 3 Easy Steps
 Whitepaper Online Selling in China in 3 Easy Steps www.salesupply.com Copyright 8-2015 Salesupply AG, All rights reserved Introduction China is at present the world s second largest economy and the EU
Brochure More information from http://www.researchandmarkets.com/reports/3278449/
 Brochure More information from http://www.researchandmarkets.com/reports/3278449/ The 2016 World Forecasts of Hand-Operated Date, Sealing, or Numbering Stamps; Devices for Printing or Embossing Labels;
GLOBAL DATA CENTER SPACE 2013
 2013 CENSUS REPORT: Global Data Center Space 2013 GLOBAL DATA CENTER SPACE 2013 Top 3 data center markets account for almost half of all global data center space. In spite of a slowdown in the amount of
Comparative tables. CPSS Red Book statistical update 427
 CPSS Red Book statistical update 427 January 2013 Table 1 Basic statistical data GDP (USD billions) 1 Population (millions, yearly average) Australia 952 1,050 999 1,246 1,500 21.1 21.4 21.8 22.1 22.4
Road Assistance in Europe
 Road Assistance in Europe Series prospectus for an overview plus ten country-specific reports AUSTRIA, BELGIUM, FRANCE, GERMANY, ITALY, NETHERLANDS, POLAND, SPAIN, SWITZERLAND, UK July 2013 Finaccord Ltd.,
Digital Evolution Index
 Digital Evolution Index The Next Billion Consumers Move Onto the Global Stage Demand Supply Institutions Innovation Presented by MasterCard, DataCash and The Fletcher School at Tufts University 1 SINCE
Internet, Smartphone & Social Media Usage Statistics
 Internet, Smartphone & Social Media Usage Statistics Presented by: RapidValue Solutions Date: 1 st December 2014 RapidValue Solutions Internet Demographics RapidValue Solutions 2 Number of Internet Users