Volume 11: January December 2014
|
|
|
- Lee Cross
- 10 years ago
- Views:
Transcription
1 BIST TRENDS REPORT By TUYID TURKISH INVESTOR RELATIONS SOCIETY & MKK CENTRAL REGISTRY AGENCY Volume 11: January December 2014 January 15, / 21

2 January 28, 2015 Dear Readers, We proudly present Volume 11 of Borsa Istanbul Trends Report, which provides index-based information on public offerings, market capitalization, free float and trade volumes by investor type for In 2014, economic and geopolitical developments and the growth-oriented strategies of central banks around the world determined the agenda for the global capital markets, while the local elections in March dominated Turkey s agenda in the first quarter. Although Borsa Istanbul mostly decoupled negatively from the global markets during this period, BIST-100 closed the year with 26% increase in TL terms, supported by the postponement of FED s interest rate hike to 2015 and the strong decline in oil prices was stagnant in terms of IPOs; nevertheless we have left behind a year where annual trade volumes and foreign inflows increased. In 2015, global economic developments, FED and Central Bank of Turkey s monetary policies, the local elections scheduled for June and the course of oil prices will be the main factors to watch in terms of Turkish capital markets performance. MKK General Manager and Board Member Doç. Dr. Yakup ERGİNCAN TUYID Chairman Abdullah Orkun KAYA 2 / 21

3 Acknowledgements: We express our gratitude to MKK Foreign Affairs and Reporting Management Department Deputy Manager Dr. Özgür Uysal, Assistant Manager Levent Ürgenç, Specialist Dr. Fatih Kiraz, TUYID Audit Committee Member and Co-Chair of Publications Working Group Aslı Selçuk, TUYID Member Eren Öner for their contributions. The evaluations and the information in the Report, where you can find significant statistics about listed stocks in Borsa Istanbul, are prepared based on Central Registry Agency s database. Investment information, comment and advices are not in the enclosure of investment consultancy and do not comprise information for buying and selling decisions in the capital markets. The data and the information in the Report cannot be guaranteed to be correct; the content can be changed without announcing. All the data are taken from the sources thought to be reliable. MMK and TUYID cannot be taken responsible for the problems that might emerge out of using these sources. 3 / 21

4 CONTENTS 1. Public Offerings by Index 5 2. Free Float 6 3. Market Capitalization 7 4. Trade Volume 8 5. Foreign Transactions Net inflow and outflow Trade Volume by Investor Type Number of Investors and Market Capitalization Number of Domestic and Foreign Investors by Index Market Capitalization by Index and Nationality Foreign Investors by Portfolio Value and Residence Holding Periods Number of Investors and Market Capitalization by Security Type Risk Appetite Index 19 4 / 21

5 1. PUBLIC OFFERINGS BY INDEX 9 initial public offerings took place in Borsa Istanbul equity market with TL 690 million proceeds in Index 2011 YE 2012 YE 2013 YE 2014 YE BIST BANK BIST HOLDING AND INVESTMENT BIST TRADE BIST SERVICES BIST FINANCIAL BIST INDUSTRY BIST TECHNOLOGY BIST ALL Source: BIST - As we analyze 2014 according to the number of public offerings and the amount of proceeds, it is observed that the proceeds almost halved year-over-year, although the number of IPOs remained flat. 9 initial public offerings took place in Borsa Istanbul equity market in In the first days of 2015, 2 companies applied to list their shares in the equity market, where 6 companies applied to list their shares in the Emerging Companies Market. Company Public Offerings Nominal Amount Initial Public Offerings (%) (TL) Arbul Entegre Tekstil İşletmeleri A.Ş. Körfez Gayrimenkul Yatırım Ortaklığı A.Ş. RTA Laboratuarları Biyolojik Ürünler İlaç ve Makine Sa. Tic. A.Ş. Tuğçelik Alüminyum ve Metal Mamulleri Sanayi ve Ticaret A.Ş. Total Proceeds (TL) Total Proceeds (USD) Initial Process Number of Foreign Buyers Date Domestic Foreign ,000,000 20,000,000 9,341, ,500,000 18,975,000 8,892, ,000,000 26,000,000 12,354, ,000,000 28,000,000 13,388, Lider Faktoring A.Ş ,500,000 13,500,000 6,368, Pergamon Status Dış Ticaret A.Ş ,480,000 11,100,000 4,888, AvivaSA Emeklilik ve Hayat A.Ş ,037, ,755, ,662, Ulusoy Un Sanayi ve Ticaret A.Ş ,500,000 74,025,000 33,018, Ulusoy Elektrik İmalat Taahhüt Tic. A.Ş ,000, ,000,000 74,936, / 21

6 2. FREE FLOAT FREE FLOAT EFFECTIVE FREE FLOAT Effective free float of the companies in Borsa Istanbul continued to increase in INDEX BIST BANK 42.01% 42.30% 42.12% 33.22% 32.89% 32.37% BIST HOLDING AND INVESTMENT 37.04% 37.32% 39.30% 31.77% 31.36% 30.92% BIST TRADE 48.34% 49.98% 50.67% 41.77% 43.16% 37.65% BIST % 38.07% 39.25% 34.18% 34.37% 33.94% BIST % 36.89% 38.87% 33.28% 33.07% 33.11% BIST % 38.34% 39.54% 32.61% 32.09% 31.51% BIST SERVICES 33.23% 33.50% 34.61% 26.18% 27.79% 27.09% BIST FINANCIAL 40.35% 41.27% 41.72% 31.92% 32.02% 31.88% BIST INDUSTRY 40.03% 38.63% 39.61% 26.51% 26.53% 27.89% BIST TECHNOLOGY 24.51% 22.59% 24.13% 20.82% 19.51% 20.06% BIST ALL 38.67% 38.57% 39.34% 29.19% 29.35% 29.55% The increase in free float continued in 2014, as it was in Although a few companies attempted to delist from the stock exchange, an increase is observed in the free float level in the market. These indicators contributed positively to market depth and effectiveness as well as an increase in trade volume. When compared to the previous years, an increase in free float is observed for all indices, except a small decline in the Bank index. Turkey s Capital Markets Board changed the definition of effective free float with a decision taken in October starting from In line with this decision, which increased the threshold share owned by individual and institutional shareholders from 5% to 10%, effective free float rate will increase in the coming period. 6 / 21

7 3. MARKET CAPITALIZATION In 2014, economic and geopolitical developments and the growth-oriented strategies of central banks around the world determined the agenda for the global capital markets, while the local elections in March dominated Turkey s agenda in the first quarter. Although Borsa Istanbul mostly decoupled negatively from the global markets during this period, BIST-100 closed the year with 26% increase in TL terms, supported by the postponement of FED s interest rate hike to 2015 and the strong decline in oil prices. Market capitalization of BIST 100 index increased by 26%, while BIST ALL index increased by 24% in TL terms in 2014 Market capitalization of BIST ALL index increased by 24% in TL terms, year-overyear. The biggest contribution to this increase came from the Bank index with 28% annual rise. The highest increase in market caps was recorded in BIST Technology index with 48%. MILLION TL Annual Change BIST BANK 144, ,747 28% BIST HOLDING AND INVESTMENT 67,106 86,196 28% BIST TRADE 25,737 32,636 27% BIST , ,036 32% BIST , ,254 27% BIST , ,645 27% BIST SERVICES 111, ,188 22% BIST FINANCIAL 238, ,906 26% BIST INDUSTRY 145, ,161 21% The trade volume of BIST ALL increased by 8% in TL terms YoY, while Bank index increased by 18% in TL terms YoY. BIST TECHNOLOGY 5,590 8,270 48% BIST ALL 500, ,526 MILLION USD % Annual Change BIST BANK 67,934 79,396 17% BIST HOLDING AND INVESTMENT 31,499 37,043 18% BIST TRADE 12,081 14,025 16% BIST , ,943 21% BIST , ,822 16% BIST , ,056 16% BIST SERVICES 52,175 58,098 11% BIST FINANCIAL 111, ,316 16% BIST INDUSTRY 68,181 75,277 10% BIST TECHNOLOGY 2,624 3,554 35% BIST ALL 234, ,245 13% 7 / 21

8 4. TRADE VOLUME NOMINAL VALUE (Million) BIST BANK Change Change 49,836 53,658 63,367 8% 18% BIST HOLDING AND INVESTMENT 29,943 35,560 23,855 19% -33% BIST TRADE 3,219 2,746 4,152-15% 51% BIST 30 94, , ,874 14% 3% BIST , , ,564 13% 6% BIST , , ,813 14% 7% BIST SERVICES 17,874 24,133 28,191 35% 17% BIST FINANCIAL 95, , ,933 11% 0% BIST INDUSTRY 45,339 49,359 47,769 9% -3% BIST TECHNOLOGY 1,678 2,001 1,540 19% -23% BIST ALL 160, , ,626 13% 1% MILLION TL Change Change BIST BANK 256, , ,539 40% 18% BIST HOLDING AND INVESTMENT 50,605 79,875 59,804 58% -25% BIST TRADE 20,490 22,075 23,754 8% 8% BIST , , ,947 45% 15% BIST , , ,277 35% 13% BIST , , ,901 36% 11% BIST SERVICES 83, , ,048 56% 20% BIST FINANCIAL 337, , ,133 41% 10% BIST INDUSTRY 167, , ,405 9% -7% BIST TECHNOLOGY 17,543 9,483 6,648-46% -30% BIST ALL 606, , ,590 32% 8% 8 / 21

9 MILLION USD Change Change BIST BANK 143, , ,631 32% 3% BIST HOLDING AND INVESTMENT 28,286 42,521 27,300 50% -36% BIST TRADE 11,458 11,621 10,858 1% -7% BIST , , ,256 37% -1% BIST , , ,460 27% -2% BIST , , ,229 28% -4% BIST SERVICES 46,746 68,834 71,695 47% 4% BIST FINANCIAL 188, , ,599 33% -4% BIST INDUSTRY 93,950 97,238 78,263 3% -20% BIST TECHNOLOGY 9,802 5,091 3,046-48% -40% BIST ALL 338, , ,770 24% -7% In 2012 and 2013, the growth rate of trade volumes in BIST ALL was 32% in TL terms. In 2014, it slowed down to 8%. In this period, the trade volume increased in all indices but BIST Holding and Investment, BIST Technology, and BIST Industry. With the depreciation of TL against USD, the USD trade volume in BIST ALL fell by 7%. The increase in Bank index remained limited to 3%. A year-over-year decline was observed in BIST Technology, BIST Holding and Investment, and BIST Industry in Nominal, TL and USD terms BIST BIST / 21

10 5. FOREIGN TRANSACTIONS NET INFLOW AND OUTFLOW USD 1.1 billion net foreign inflow, took place in BIST ALL in the last quarter of 2014, representing the highest level for the year. Net foreign inflow in 2014 reached USD 2.3 billion. BIST BANK (USD million) BIST HOLDING AND INVESTMENT 1Q Q Q Q Total (131) 393 1, (72) 239 BIST TRADE 10 (20) (42) 44 (9) BIST (211) 958 1,784 BIST (160) 1,045 1,963 BIST (111) 1,067 2,058 BIST SERVICES (84) (227) (88) BIST FINANCIAL (80) 321 1,430 BIST INDUSTRY (5) BIST TECHNOLOGY BIST ALL (26) 1,116 2,287 (USD million) BIST BANK 2,194 (1,221) 1,048 BIST HOLDING AND INVESTMENT BIST TRADE 164 (1) (9) BIST 30 3,021 (905) 1,784 BIST 50 5,024 (953) 1,963 BIST 100 5,389 (572) 2,058 BIST SERVICES BIST FINANCIAL 2,707 (916) 1,430 BIST INDUSTRY 2, BIST TECHNOLOGY 38 (7) 78 BIST ALL 5,407 (418) 2,287 Borsa Istanbul closed 2014 with net inflows of USD 2.3 billion, compared to the USD 418 million net outflow of The highest net inflow was in BIST Bank and BIST Industry indices, while a low net foreign outflow was seen in BIST Trade index (USD 9 million). 10 / 21
 1,045 1,963 BIST 100 340 762 (111) 1,067 2,058 BIST SERVICES (84) (227) (88) 631 233 BIST FINANCIAL 480 710 (80) 321 1,430 BIST INDUSTRY (5) 299 119 123 535 BIST")
11 6. TRADE VOLUME BY INVESTOR TYPE th rd nd Quarter Quarter Quarter st Quarter Foreign Domestic Foreign Domestic Foreign Domestic Foreign Domestic Foreign Domestic BIST-ALL 20% 80% 20% 80% 20% 80% 20% 80% 22% 78% BIST % 76% 24% 76% 23% 77% 24% 76% 25% 75% BIST % 77% 23% 77% 23% 77% 24% 76% 25% 75% BIST % 78% 21% 79% 21% 79% 22% 78% 23% 77% BIST INDUSTRY 17% 83% 16% 84% 16% 84% 18% 82% 19% 81% BIST SERVICES 20% 80% 19% 81% 22% 78% 21% 79% 21% 79% BIST TRADE 26% 74% 24% 76% 26% 74% 23% 77% 29% 71% BIST FINANCIAL 22% 78% 22% 78% 21% 79% 21% 79% 23% 77% BIST BANK 21% 79% 22% 78% 20% 80% 21% 79% 22% 78% BIST HOLDING AND INVESTMENT 27% 73% 26% 74% 29% 71% 24% 76% 28% 72% BIST TECHNOLOGY 7% 93% 10% 90% 7% 93% 5% 95% 7% 93% In 2014, the share of the foreign investors in BIST ALL trade volume was 20%. The highest share of foreign investors in trade volume was in BIST Holding and Investment (27%) while the lowest was in BIST Technology (7%). In 2014, domestic investors generated 80% of the volume in Borsa Istanbul. Average Trade Volumes of Foreign Investors by Index BIST-ALL 20% 20% BIST % 24% BIST % 23% BIST % 22% BIST INDUSTRY 15% 17% BIST SERVICES 22% 20% BIST TRADE 27% 26% BIST FINANCIAL 22% 22% BIST BANK 23% 21% BIST HOLDING AND INVESTMENT 22% 27% BIST TECHNOLOGY 7% 7% Foreign trade volume increased in BIST Holding and Investment by 5% and BIST Industry by 2% year-over-year. There was a fall in BIST Bank Index by 2%, BIST Services by 2% and BIST Trade by 1% in terms of the share of foreign investors. In 4Q14, compared to 3Q14, foreign trade volume increased in BIST 30, BIST Financial, BIST Bank and BIST Technology but decreased in BIST Holding and 11 / 21

12 Investment, BIST Services, and BIST Trade. The highest increase (3%) was seen in BIST Technology and the largest decrease (3%) was seen in both BIST Holding and Investment and BIST Services. 24% 23% 22% 21% 20% 19% 18% 17% Foreign Share in BIST-ALL Trade Volume Jan Feb Mar Apr May Jun Jul Aug Sep Oct Nov Dec / 21

13 7. NUMBER OF INVESTORS AND MARKET CAPITALIZATION As of year-end, 9,895 of the total 1 million 75 thousand investors in Borsa Istanbul were nonresidents. Foreign investors represent only 1% of the total investors. Yet, their share in trade volume is 20% and they hold 64% of the market cap. Domestic % Number of Investors Foreign % As of December 2014, the number of total investors in Borsa Istanbul was 1,075,368, 99% of which are domestic investors. In December, the number of foreign investors increased by 104 compared to September. However, the number of domestic investors, which are mostly individuals, decreased by 4,350. Market Capitalization Domestic 36% 90 billion TL Foreign 64% 159 billion TL 13 / 21

14 In 2014, foreign investors had 20% share in BIST All trade volume and their share in market capitalization reached 64%. The total value of the equities held by foreign investors is TL 159 billion. Domestic investors are mostly individuals. The domestic corporate investor base is yet very limited and their share in the market capitalization is 18%. Corporate 0,5% Domestic Investors by Type Individual 99,5% Over 99% of the domestic investors are individuals and they hold half of the total domestic portfolio value. Foreign Investors by Type Individual 62% Corporate 38% Among foreign investors, corporate investors have a much higher share with 38% when compared to the domestic case above. This group is holding 64% of the total market cap and almost the entire foreign portfolio. 14 / 21

15 8. NUMBER OF DOMESTIC AND FOREIGN INVESTORS BY INDEX Dec.14 Dec.13 Sep.14 Jun.14 Mar.14 Foreign Domestic Foreign Domestic Foreign Domestic Foreign Domestic Foreign Domestic BIST ALL BIST BIST BIST BIST INDUSTRY BIST SERVICES BIST FINANCIAL BIST TECHNOLOGY BIST TRADE BIST BANK BIST HOLDING AND INVESTMENT As of year-end, the number of foreign investors increased year-over-year in BIST ALL, BIST 50, BIST Industry, BIST Financial, BIST Holding and Investment and BIST Trade. The highest increase was seen in BIST Holding and Investment index with 390 investors. Throughout the year, the highest foreign trade volume was also seen in the same index by 27%. On the other hand, the number of foreign investors declined in BIST 100, BIST Services, BIST 30, and BIST Technology but the highest decline was in BIST Bank. On an annual basis, the number of domestic investors declined in all indices but mostly in BIST 100. As we compare September and December, an increase is observed in BIST 30 and BIST Holding and Investment indices, while there is a decrease in all other indices. 15 / 21

16 9. MARKET CAPITALIZATION BY INDEX AND NATIONALITY Billion TL Dec.14 Dec.13 Sep.14 Jun.14 Mar.14 Foreign Domestic Foreign Domestic Foreign Domestic Foreign Domestic Foreign Domestic BIST ALL BIST BIST BIST BIST INDUSTRY BIST SERVICES BIST FINANCIAL BIST TECHNOLOGY BIST TRADE BIST BANK BIST HOLDING AND INVESTMENT The market capitalization of foreign investors increased in all indices in December, as compared to both September 2014 and December In September, it remained the same in Technology, Trade and Holding, and Investment indices but decreased in all other indices, as compared to June. Similarly, the market capitalization by domestic investors increased in all indices in December, as compared to both September 2014 and December / 21

17 10. FOREIGN INVESTORS BY PORTFOLIO VALUE AND RESIDENCE 1,402 US based investors hold one third of the foreign investments. USA and UK based investors hold the half of the total foreign investment. Location Portfolio Value (Million TL) Share 1 USA % 2 UK % 3 LUXEMBOURG % 4 HOLLAND % 5 IRELAND % 6 SINGAPORE % 7 NORWAY % 8 CAYMAN ISLANDS % 9 FRANCE % 10 GREECE % OTHER % By the end of the year, residence based shares remained the same compared to the previous quarter. As of December 2014, the top three countries with the highest portfolio value stayed the same, which belong to investors residing in USA, UK and Luxembourg. The total number of investors resident in USA increased to 1,402 at the end of 2014, while it was 1,312 at the end of One third of the total foreign investments belong to the investors resident in USA, while the investors based in USA and UK hold 49% of the total foreign investment at BIST. 11. HOLDING PERIODS * Days Foreign Domestic Foreign Domestic Foreign Domestic Foreign Domestic BIST ALL BIST BIST BIST BIST INDUSTRY BIST SERVICES BIST FINANCIAL BIST TECHNOLOGY BIST TRADE BIST BANK BIST HOLDING AND INVESTMENT Foreign investors long-term, domestic investors short-term investment perspective has not changed in Foreign investors had an average holding period of 1 year, while domestic investors had a mere 46 days. As a result, domestic investors had a share of 80% in total trade volume. 17 / 21

18 The holding period of domestic investors was longest in BIST Holding and Investment index and shortest in BIST Bank. In 2014, similar to 2013, the shortest holding period for both domestic and foreign investors was in BIST Bank, declining from 26 days to 21 days and from 252 days to 207 days for domestic and foreign investors, respectively. The longest holding period for domestic investors continued to be in BIST Holding and Investment, however the period extended to 103 days from 65 days. On the other hand, foreign investors preferred BIST Trade index for their long-term investments and the period increased to 688 days from 651 days. The index with the highest increase of holding period for domestic investors was BIST Holding and Investment with 38 days. It also increased in BIST Technology, BIST Industry and BIST Trade. For foreign investors, the index with the highest increase in holding period was BIST Technology with 239 days. An increase was also observed in BIST Holding and Investment and BIST Trade indices. However, it should be noted that for foreign investors, BIST Technology index had the lowest number of investor and market value. The highest decrease in holding period for foreign investors was in BIST Bank index with 45 days. * For the calculation of holding periods, SEC s (Securities and Exchange Commission of USA) turnover-based formula for funds is used. (annual average value of the portfolio / smaller of the total buy and total sell transaction amounts) x NUMBER OF INVESTORS AND MARKET CAPITALIZATION BY TYPE OF SECURITY Type of Security Share Certificates Investment Fund BIST Investment Fund Private Sector Debt Instrument Structured Product Other Securities Government Bonds Dec.13 Dec.14 Number of Investors Market Cap Market Cap Number of Investors (Million TL) (Million TL) TOTAL / 21

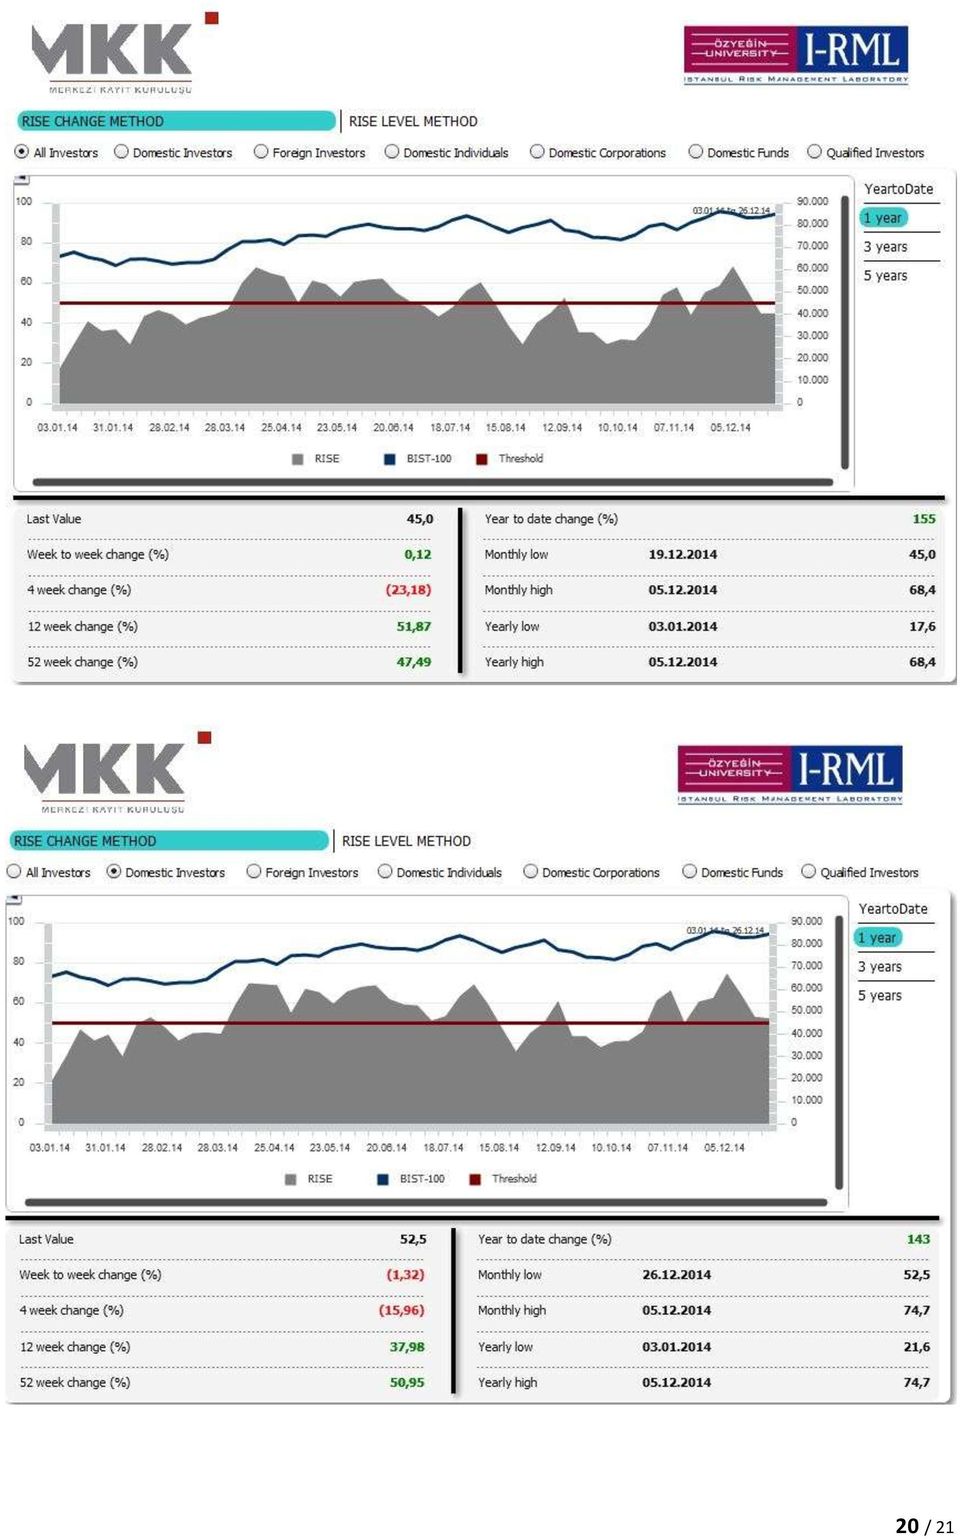
19 13. INVESTOR RISK APPETITE INDEX In 2014, RISE started at 18 levels, which is the lowest this year and then recovered to 50 but it was not able to hold on that level for a long time and it closed 2014 at 45 levels. The Investor Risk Appetite Index (RISE) has been announced by MKK since December Unlike in 1Q14, Risk Appetite in Borsa Istanbul was never below the critical value of 50 in 2Q14. Risk Appetite index, which witnessed rises and declines in Q3 and Q4, stayed below 50 in general, in this volatile period of six months. The average RISE value of these last two quarters is 46. A significant point for this year is that, since April 18, domestic investors Risk Appetite levels have always been a little bit higher than the foreign investors. Another important point is that foreign investors RISE series is the most volatile whereas domestic individuals series is the most stable among seven categories. To sum it up, this year s RISE started at 18 which is the lowest level of this year and then recovered but it was not able to hold on at above 50 levels for a long time and it closed this year at 45 levels. Analyzing RISE series characteristics in three quarters, it is evident that Q1 and Q3 series averages are low but volatilities are high, whereas exactly the opposite is true for Q2. The last quarter, which also witnessed the maximum RISE value (68.4) of this year, is the most volatile period. This trend can be partially explained statistically and significantly with; high political uncertainties at the beginning of the year, then their replacement by not so radical expectations about the elections, ECB s declarations positive impacts, FED policy (and its effects on dollar rates), reincrease of geopolitical risks, and finally the global outlook at year end, which can be summarized by low petroleum prices and sudden and important currency rate changes. 19 / 21

20 20 / 21
21 Source: MKK / 21
Volume 10: January September 2014
 BIST TRENDS REPORT by TUYID TURKISH INVESTOR RELATIONS SOCIETY & MKK CENTRAL REGISTRY AGENCY Volume 10: January September 2014 October 13, 2014 1 / 17 October 13, 2014 Dear Readers, We proudly present
Volume 8: January March 2014
 BIST TRENDS REPORT by TUYID TURKISH INVESTOR RELATIONS SOCIETY & MKK CENTRAL REGISTRY AGENCY Volume 8: January March 2014 April 16, 2014 1 / 18 April 16, 2014 Dear Readers, We proudly present Volume VIII
Volume 4: January March 2013
 BIST TRENDS REPORT by TUYİD TURKISH INVESTOR RELATIONS SOCIETY & MKK CENTRAL REGISTRY AGENCY Volume 4: January March 2013 25 April 2013 1 / 19 April 25, 2013 Dear Readers, We proudly present Volume IV
FLOW OF FUNDS REPORT IV TUYID Q1
 FLOW OF FUNDS REPORT IV TUYID Q1 2014 January, 2014 Dear Readers, This volume of the Flow of Funds Report, which provides important insight about the inflow and outflow of funds, as well as investment
AT&T Global Network Client for Windows Product Support Matrix January 29, 2015
 AT&T Global Network Client for Windows Product Support Matrix January 29, 2015 Product Support Matrix Following is the Product Support Matrix for the AT&T Global Network Client. See the AT&T Global Network
COMPARISON OF FIXED & VARIABLE RATES (25 YEARS) CHARTERED BANK ADMINISTERED INTEREST RATES - PRIME BUSINESS*
 CHARTERED BANK ADMINISTERED INTEREST RATES - PRIME BUSINESS*") COMPARISON OF FIXED & VARIABLE RATES (25 YEARS) 2 Fixed Rates Variable Rates FIXED RATES OF THE PAST 25 YEARS AVERAGE RESIDENTIAL MORTGAGE LENDING RATE - 5 YEAR* (Per cent) Year Jan Feb Mar Apr May Jun
COMPARISON OF FIXED & VARIABLE RATES (25 YEARS) 2 Fixed Rates Variable Rates FIXED RATES OF THE PAST 25 YEARS AVERAGE RESIDENTIAL MORTGAGE LENDING RATE - 5 YEAR* (Per cent) Year Jan Feb Mar Apr May Jun
Global Equity Trading Volumes Surge 36% in 1 st half 2015 driven by Mainland China
 Global Equity Trading Volumes Surge 36% in 1 st half 215 driven by Mainland China Global Equity Trading Volumes Ex Mainland China Up 5% Mainland China Share Trading Vols Rise 166% in H1 215 vs H2 214 The
7. Foreign Investments in India
 93 Foreign Investments in India ISMR 7. Foreign Investments in India Introduction From 1992, Foreign Institutional Investors (FIIs) have been allowed to invest in all securities traded on the primary and
OCTOBER 2014. Turkey Brokerage Industry 2014 SEMIANNUAL REVIEW
 OCTOBER 2014 Turkey Brokerage Industry 2014 SEMIANNUAL REVIEW TURKISH BROKERAGE INDUSTRY 2014 SEMIANNUAL REVIEW Edited by Alparslan Budak Ekin Fıkırkoca-Asena Written by Gökben Altaş Serhat Tahsin İşler
FINANCIAL RESULTS Q1 2016
 FINANCIAL RESULTS Q1 2016 CFO Hallvard Granheim 28 th April 2016 Highlights Q1 Increase in underlying results (EBITDA) - Nordic prices are down 15% Q-on-Q - High production from Nordic hydropower assets
Fixed Income 2015 Update. Kathy Jones, Senior Vice President Chief Fixed Income Strategist, Schwab Center for Financial Research
 Fixed Income 2015 Update Kathy Jones, Senior Vice President Chief Fixed Income Strategist, Schwab Center for Financial Research 1 Fed: Slow and Low 2015 Fixed Income Outlook 2 Yield Curve Flattening 3
MACROECONOMIC OVERVIEW
 MACROECONOMIC OVERVIEW MAY 20 Koç Holding CONTENTS Global Economy... 3 Global Financial Markets... 3 Global Economic Growth Forecasts... 3 Turkey Macroeconomic Indicators... Economic Growth... Industrial
An Overview of Offshore RMB Market. Nov 2013
 An Overview of Offshore RMB Market Nov 2013 Contents 1. Outlook of RMB Internationalisation 2. Implications for Offshore RMB Bonds 2 Section 1 Outlook of RMB Internationalisation 3 RMB The next international
Taking stock of China s external debt: low indebtedness, but rapid growth is a concern
 1991 1993 1995 1997 1999 21 23 25 27 29 211 213 1991 1992 1993 1994 1995 1996 1997 1998 1999 2 21 22 23 24 25 26 27 28 29 21 211 212 213 ECONOMIC ANALYSIS Taking stock of China s external debt: low indebtedness,
What s inside. Total Traded Value, Breakdown by Markets, BIST Main Indices. Equity Market
 BORSA İSTANBUL MARKETS MONTHLY July 21 What s inside Consolidated Data Total Traded Value, Breakdown by s, BIST Main Indices Equity Traded Value, Breakdown by Instruments, Traded Volume, Cap., Monthly
INFORMATION FOR SHAREHOLDERS. Ordinary shares
 INFORMATION FOR SHAREHOLDERS Ordinary shares The Group s share capital is divided into 5,993,227,24 shares with a nominal value of RUB 1 each. NLMK s shares are traded on the MICEX and RTS trading platforms
Analysis One Code Desc. Transaction Amount. Fiscal Period
 Analysis One Code Desc Transaction Amount Fiscal Period 57.63 Oct-12 12.13 Oct-12-38.90 Oct-12-773.00 Oct-12-800.00 Oct-12-187.00 Oct-12-82.00 Oct-12-82.00 Oct-12-110.00 Oct-12-1115.25 Oct-12-71.00 Oct-12-41.00
Case 2:08-cv-02463-ABC-E Document 1-4 Filed 04/15/2008 Page 1 of 138. Exhibit 8
 Case 2:08-cv-02463-ABC-E Document 1-4 Filed 04/15/2008 Page 1 of 138 Exhibit 8 Case 2:08-cv-02463-ABC-E Document 1-4 Filed 04/15/2008 Page 2 of 138 Domain Name: CELLULARVERISON.COM Updated Date: 12-dec-2007
Chapter 2 Financial markets
 Chapter Financial markets Hovedstyret desember,,,,,.a Exchange rates against USD Daily figures,,,,, JPY per USD (left-hand scale),, USD per euro (right-hand scale), jan jul jan jul jan jul, Source: EcoWin
2014 Asia Securities Forum Presented by the Korea Financial Investment Association
 2014 Asia Securities Forum Presented by the K O R E A I. Korean Capital Market I. Current Status II. Prospects II. Korean Financial Investment Industry C O N T E N T S III. Capital Market Regulations 2
Coffee prices fall to 18-month low as supply concerns fade
 Coffee prices fall to 18-month low as supply concerns fade The coffee market registered further decreases in July with prices reacting to the depreciation in the Brazilian exchange rate, which dropped
FUNDMARKET INSIGHT REPORT
 FUNDMARKET INSIGHT REPORT AUGUST 2013 LAUNCHES, LIQUIDATIONS, AND MERGERS IN THE EUROPEAN MUTUAL FUND INDUSTRY, Q2 2013 CHRISTOPH KARG Content Specialist for Germany & Austria Executive Summary As of the
Housing Price Forecasts, 2015. Illinois and Chicago MSA
 Housing Price Forecasts, 2015 Illinois and Chicago MSA Presented To Illinois Association of Realtors From R E A L Regional Economics Applications Laboratory, Institute of Government and Public Affairs
Development of the government bond market and public debt management in Singapore
 Development of the government bond market and public debt management in Singapore Monetary Authority of Singapore Abstract This paper describes the growth of the Singapore Government Securities (SGS) market.
The Coming Volatility
 The Coming Volatility Lowell Bolken, CFA Vice President and Portfolio Manager Real estate Securities June 18, 2015 www.advantuscapital.com S&P 500 Percent Daily Change in Price September 2008 to April
Changes to China s Renminbi Exchange Rate. Wednesday, August 12, 2015
 Changes to China s Renminbi Exchange Rate Wednesday, August 12, 2015 WHAT HAVE CHINESE POLICY MAKERS DONE IN REGARD TO SETTING THEIR EXCHANGE RATE? Each day at 9.15am in Beijing the People s Bank of China
CESEE DELEVERAGING AND CREDIT MONITOR 1
 CESEE DELEVERAGING AND CREDIT MONITOR 1 November 4, 214 Key Developments in BIS Banks External Positions and Domestic Credit In 214:Q2, BIS reporting banks reduced their external positions to CESEE countries
Presentation on Results for FY 2015. Idemitsu Kosan Co.,Ltd. May 10, 2016
 Presentation on Results for FY 2015 Idemitsu Kosan Co.,Ltd. May 10, 2016 Table of Contents 1. FY 2015 Financials (1) Overview (2) Segment Information 2. Forecast for FY 2016 Performance (1) Overview (2)
Third Quarter 2014 Earnings Conference Call. 13 August 2014
 Third Quarter 2014 Earnings Conference Call 13 August 2014 Safe Harbor Statement & Disclosures The earnings call and accompanying material include forward-looking comments and information concerning the
Enhanced Vessel Traffic Management System Booking Slots Available and Vessels Booked per Day From 12-JAN-2016 To 30-JUN-2017
 From -JAN- To -JUN- -JAN- VIRP Page Period Period Period -JAN- 8 -JAN- 8 9 -JAN- 8 8 -JAN- -JAN- -JAN- 8-JAN- 9-JAN- -JAN- -JAN- -JAN- -JAN- -JAN- -JAN- -JAN- -JAN- 8-JAN- 9-JAN- -JAN- -JAN- -FEB- : days
Recent Developments and Outlook for the Mexican Economy Credit Suisse, 2016 Macro Conference April 19, 2016
 Credit Suisse, Macro Conference April 19, Outline 1 Inflation and Monetary Policy 2 Recent Developments and Outlook for the Mexican Economy 3 Final Remarks 2 In line with its constitutional mandate, the
Monetary Policy in Emerging Markets: Indonesia s s Case
 Monetary Policy in Emerging Markets: Indonesia s s Case Hartadi A. Sarwono, Deputy Governor Paper presented at The OECD-CCBS CCBS Seminar on Monetary Policy in Emerging Markets,, Paris, 28 February 2007.
Presentation on Results for the 2nd Quarter FY 2015. Idemitsu Kosan Co.,Ltd. November 4, 2015
 Presentation on Results for the 2nd Quarter FY 2015 Idemitsu Kosan Co.,Ltd. November 4, 2015 Table of Contents 1. 2 nd Quarter FY 2015 Financials (1) Overview (2) Segment Information (3) Streamlining 2.
Investment Company Institute PERSPECTIVE
 Investment Company Institute PERSPECTIVE Volume 1, Number 1 July 1995 MUTUAL FUND SHAREHOLDER RESPONSE TO MARKET DISRUPTIONS by Richard Marcis, Sandra West, and Victoria Leonard-Chambers 1 Summary With
P A R A G O N CAPITAL MANAGEMENT
 Bond Market Overview July 2013 Bonds declined in value last quarter as interest rates rose by the most in over two years. The increase was a function of economic surprises, Federal Reserve policy confusion,
Robeco High Yield Bonds
 Important Information 1. Robeco High Yield Bonds (the Fund aims to provide long term capital growth. The Fund invests at least two thirds of its total assets in bonds, asset backed securities and similar
P/T 2B: 2 nd Half of Term (8 weeks) Start: 25-AUG-2014 End: 19-OCT-2014 Start: 20-OCT-2014 End: 14-DEC-2014
 Start: 25-AUG-2014 End: 19-OCT-2014 Start: 20-OCT-2014 End: 14-DEC-2014") 2014-2015 SPECIAL TERM ACADEMIC CALENDAR FOR SCRANTON EDUCATION ONLINE (SEOL), MBA ONLINE, HUMAN RESOURCES ONLINE, NURSE ANESTHESIA and ERP PROGRAMS SPECIAL FALL 2014 TERM Key: P/T = Part of Term P/T Description
2014-2015 SPECIAL TERM ACADEMIC CALENDAR FOR SCRANTON EDUCATION ONLINE (SEOL), MBA ONLINE, HUMAN RESOURCES ONLINE, NURSE ANESTHESIA and ERP PROGRAMS SPECIAL FALL 2014 TERM Key: P/T = Part of Term P/T Description
P/T 2B: 2 nd Half of Term (8 weeks) Start: 26-AUG-2013 End: 20-OCT-2013 Start: 21-OCT-2013 End: 15-DEC-2013
 Start: 26-AUG-2013 End: 20-OCT-2013 Start: 21-OCT-2013 End: 15-DEC-2013") 2013-2014 SPECIAL TERM ACADEMIC CALENDAR FOR SCRANTON EDUCATION ONLINE (SEOL), MBA ONLINE, HUMAN RESOURCES ONLINE, NURSE ANESTHESIA and ERP PROGRAMS SPECIAL FALL 2013 TERM Key: P/T = Part of Term P/T Description
2013-2014 SPECIAL TERM ACADEMIC CALENDAR FOR SCRANTON EDUCATION ONLINE (SEOL), MBA ONLINE, HUMAN RESOURCES ONLINE, NURSE ANESTHESIA and ERP PROGRAMS SPECIAL FALL 2013 TERM Key: P/T = Part of Term P/T Description
P/T 2B: 2 nd Half of Term (8 weeks) Start: 24-AUG-2015 End: 18-OCT-2015 Start: 19-OCT-2015 End: 13-DEC-2015
 Start: 24-AUG-2015 End: 18-OCT-2015 Start: 19-OCT-2015 End: 13-DEC-2015") 2015-2016 SPECIAL TERM ACADEMIC CALENDAR For Scranton Education Online (SEOL), Masters of Business Administration Online, Masters of Accountancy Online, Health Administration Online, Health Informatics
2015-2016 SPECIAL TERM ACADEMIC CALENDAR For Scranton Education Online (SEOL), Masters of Business Administration Online, Masters of Accountancy Online, Health Administration Online, Health Informatics
Turkey Domestic Corporate Bond Markets
 Turkey Domestic Corporate Bond Markets April 2011 Corporate Bond Market Development in Turkey Priorities and Changes Istanbul, Turkey G. Meltem Kökden T.İş Bankası A.Ş 1 Domestic Corporate Bond Markets
Assessing Sources of Funding for Insurance Risk Based Capital
 Assessing Sources of Funding for Insurance Risk Based Capital Louis Lee Session Number: (ex. MBR4) AGENDA for Today 1. Motivations of Capital Needs 2. Practical Risk Based Capital Funding Options 3. Types
The 2014 Global Market - Institutional Investors and Austrian Stocks
 Institutional Investors and Austrian Stocks in 2014 Institutional Investors and Austrian Stocks in 2014 International institutional investors remain the largest stakeholders in the ATX prime, having increased
Brazil Economic Overview
 Brazil Economic Overview New York Alexandre Tombini Governor February 2013 1 Macroeconomic Policy and Social Development Macroeconomic fundamentals, combined with adequate prudential policies and strong
Gold back in the spotlight
 Gold back in the spotlight Ani Markova, MBA, LIFA, CIM, CFA Vice-President and Portfolio Manager AGF Investments Inc. IS THIS GOLD RALLY SUSTAINABLE? Since late 2011, gold has been in a steady down trend,
TURKEY BROKERAGE INDUSTRY 2014 ANNUAL REVIEW
 TURKEY BROKERAGE INDUSTRY 2014 ANNUAL REVIEW TURKISH BROKERAGE INDUSTRY 2014 ANNUAL REVIEW EDITED BY Alparslan Budak Ekin Fıkırkoca Asena WRITTEN BY Gökben Altaş Deniz Bayram Mustafa Özer DESIGN Finar
Part F. Reforms in Pensions and in the Taxation of the Capital Market. 1. The Pension Reform
 Part F 1. The Pension Reform Reforms in Pensions and in the Taxation of the Capital Market In May 2003, the Knesset approved a comprehensive reform in pension funds, under which their investment terms
Highlights of 1H FY2015 Results. November 18, 2015
 Highlights of 1H FY2015 Results November 18, 2015 Table of Contents 1. Trend of business results 3. Domestic life insurance Summary of 1H FY2015 results 3 Overview of 1H FY2015 results Himawari Life 27
Q1 14 Global IPO update. January March 2014
 Q1 14 Global IPO update January March 214 Table of contents Section Content Slides 1 214 January March* highlights 4 7 2 Global IPO activity trends Global analysis Regional analysis Industry analysis Stock
Bond Market Perspectives
 LPL FINANCIAL RESEARCH Bond Market Perspectives December 16, 2014 Tempting TIPS Anthony Valeri, CFA Fixed Income & Investment Strategist LPL Financial Highlights Lower inflation expectations as a result
Oil & Gas Market Outlook. 6 th Norwegian Finance Day Marianne Kah, Chief Economist March 2, 2016
 Oil & Gas Market Outlook 6 th Norwegian Finance Day Marianne Kah, Chief Economist March 2, 2016 Challenging Market Environment Concerns that global economic growth will slow and reduce global oil and natural
1. 2015 Gross Borrowing Requirements and Funding Plan
 1 1. 2015 Gross Borrowing Requirements and Funding Plan 1.1 Gross Borrowing requirements The Treasury expects its 2015 gross borrowing requirements to amount to EUR 39.90 billion. This represents an increase
Mexico: The challenges of capital inflows. Manuel Sánchez, Deputy Governor
 Manuel Sánchez, Deputy Governor Adam Smith Seminar, Schloss Spiez, Switzerland, June 26, 2013 Contents 1 Taxonomy of capital inflows 2 Risks and the prevention of problems 3 Economic outlook 2 Like other
ECONOMIC AND MARKET COMMENTARY
 OUR MISSION Smith Shellnut Wilson is a registered investment advisor* specializing in managing investment portfolios for banks, individuals, corporations, foundations and public entities. Smith Shellnut
Monetary Policy and Mortgage Interest rates
 Monetary Policy and Mortgage Interest rates July 2014 Key Points: Monetary policy, which operates through changes in the official cash rate (OCR), is the main lever of macroeconomic management in Australia
Private Banking Global Wrap Up Bank of Ireland Private Banking
 Private Banking Global Wrap Up Bank of Ireland Private Banking 2 nd Quarter 2015 Investor Overview Developed Economies improve but markets ease back in Q2 Last quarter we highlighted a number of factors
MORE UPSIDE FOR THE AUSTRALIAN DOLLAR
 Dec. 23 Jan. 2 ECONOMY AND STRATEGY 51.879.2529 Clément Gignac Strategist and Chief Economist Stéfane Marion Assistant Chief Economist Paul-André Pinsonnault Senior Fixed Income Economist Marc Pinsonneault
BIST STOCK INDICES GROUND RULES CONTENTS
 BIST STOCK INDICES GROUND RULES CONTENTS 1. PURPOSE... 1 2. DEFINITIONS AND GENERAL RULES... 1 3. CALCULATED INDICES... 4 4. CALCULATION METHOD AND ADJUSTMENT... 6 5. SELECTION CRITERIA... 9 6. PERIODIC
FINANCIAL RESULTS Q2 2015
 FINANCIAL RESULTS Q2 2015 CEO CHRISTIAN RYNNING-TØNNESEN CFO HALLVARD GRANHEIM 23 July 2015 Highlights Solid underlying results (EBITDA) - Lower Nordic prices offset by increased production and contribution
Eurozone Economic dashboard
 Eurozone Economic dashboard Our Economic Dashboard is designed to help investors understand the true state of the eurozone economy. It is not meant to serve as a direct prediction regarding the future
EMERGING MARKET CURRENCY PAIRS CURRENCY GUIDE
 EMERGING MARKET CURRENCY PAIRS CURRENCY GUIDE /MXN /Mexico 14.597/12.548 168.8 14.5500 14.2500 13.9500 13.7000 13.4000 13.1000 12.7767 JAN 9 FEB 28 APR 21 JUN 11 JUL 30 SEP 18 NOV 7 12.5500 The /MXN is
Deutsche Global Infrastructure Fund (TOLLX)
") Global Infrastructure Fund (TOLLX) A step beyond MLPs Important risk information Any fund that concentrates in a particular segment of the market will generally be more volatile than a fund that invests
Global Infrastructure Fund (TOLLX) A step beyond MLPs Important risk information Any fund that concentrates in a particular segment of the market will generally be more volatile than a fund that invests
ebrief for freelancers and contractors Contractors guide to investing surplus cash
 ebrief for freelancers and contractors Contractors guide to investing surplus cash Making the most of your Surplus Cash Intouch Accounting, the personal online accountant, looks at this all important question
2Q15 Consolidated Earnings Results
 2Q15 Consolidated Earnings Results IFRS September 2015 Disclaimer Grupo Aval Acciones y Valores S.A. ( Grupo Aval ) is an issuer of securities in Colombia and in the United States, registered with Colombia
Annual Shareholder Meeting. June 2012
 Annual Shareholder Meeting June 2012 Agenda Call to Order; Opening of Polls Introduction of Directors Introduction of Management Introduction of Independent Registered Public Accounting Firm Designation
Financial Statement Consolidation
 Financial Statement Consolidation We will consolidate the previously completed worksheets in this financial plan. In order to complete this section of the plan, you must have already completed all of the
Italy Spain. France Germany. Percent (%)
") March Commentary from Pacific Asset Management, the subadvisor to the Pacific Funds SM Fixed-Income Funds. The Euros Are Coming The gap between U.S. and European bond yields presents an interesting value
March Commentary from Pacific Asset Management, the subadvisor to the Pacific Funds SM Fixed-Income Funds. The Euros Are Coming The gap between U.S. and European bond yields presents an interesting value
Providing Trading Opportunities in a Sound Marketplace
 Providing Trading Opportunities in a Sound Marketplace Dec/2013 Classification of the Information Public USD Billion Million Active Market with Liquid Products Equities Market Market Cap of USD 1 trillion
Working Capital and the Financing Decision C H A P T E R S I X
 Working Capital and the Financing Decision C H A P T E R S I X Limited 2000 Figure 6-1a The nature of asset growth A. Stage I: Limited or no Growth PPT 6-1 Dollars Temporary current assets Capital assets
Second Quarter 2015 Trading Update. 28 September 2015
 Second Quarter 2015 Trading Update 28 September 2015 Disclaimer This communication and the information contained herein has been approved by the Board of Directors of Eurobank Ergasias S.A. ( Eurobank
TURKISH FINANCIAL MARKETS IN PRACTISE
 TURKISH FINANCIAL MARKETS IN PRACTISE SECOND MEETING OF TURKISH-RUSSIAN WORKING GROUP ON BANKING AND FINANCIAL COOPERATION September 2011 EMEL GÜNEŞ HEAD OF TREASURY, DENIZBANK TURKISH FINANCIAL SECTOR:
UPDATE ON CURRENT MACRO ENVIRONMENT
 1 Oct 213 Macro & Strategy Equity Credit Commodities 13 13 #1 Global Strategy #1 Multi Asset Research #3 Global Economics #2 Equity Quant #2 Index Analysis #3 SRI Research 12 sector teams in the Top 1
The table below shows Capita Asset Services forecast of the expected movement in medium term interest rates:
 Annex A Forecast of interest rates as at September 2015 The table below shows Capita Asset Services forecast of the expected movement in medium term interest rates: NOW Sep-15 Dec-15 Mar-16 Jun-16 Sep-16
Institutional Investors and Hungarian Stocks in 2014
 Institutional Investors and Hungarian Stocks in 2014 Institutional Investors and Hungarian Stocks in 2014 Capital markets were generally on a roller-coaster ride in 2014, with increased volatility and
Turkish Arab Economic Forum June 29, 2012. Mehmet Şimşek. Minister of Finance
 Turkish Arab Economic Forum June 29, 2012 Mehmet Şimşek Minister of Finance 1 Outline Turkey: Short Term Outlook Managing a Soft Landing Fallout from the Euro Crisis Turkey & MENA REBALANCING Growing ON
3 rd Brazil - China Capital Markets Forum
 3 rd Brazil - China Capital Markets Forum Ilan Goldfajn Chief Economist, Itaú Unibanco Partner, Itaú BBA August 30 th, 2012 In Brief World: consolidating a scenario of low growth. Slow recovery in the
Economic indicators dashboard
 AS OF NOVEMBER 17, 2015 Economic indicators dashboard Vist www.blog.helpingadvisors.com for the full commentary of the Economic Indicators Dashboard. MOST RECENT 3-MO. trend TYPICAL range EXTREME range
TO OUR SHAREHOLDERS DYNAMIC FIRST HALF YEAR
 HALF YEAR REPORT AS OF JUNE 30, 2015 TO OUR SHAREHOLDERS Patrik Heider, Spokesman of the Executive Board and CFOO The Nemetschek Group maintained its dynamic development from the first quarter of 2015
Monetary Policy Outlook in a Negative Rates Environment Mr. Javier Guzmán Calafell, Deputy Governor, Banco de México J.P. Morgan Investor Seminar
 Mr. Javier Guzmán Calafell, Deputy Governor, Banco de México J.P. Morgan Investor Seminar Washington, DC, 15 April 2016 Outline 1 External Conditions 2 Macroeconomic Policy in Mexico 3 Evolution and Outlook
CAFIS REPORT 2015.10
 CAFIS REPORT 2015.10 INDEX Message CAFIS Inbound 03-06 07-08 CAFIS Arch 09-10 CAFIS Brain 11-12 CAFIS Global 13-14 What We Do 15-16 About CAFIS 17-18 Services for Member Stores 19-34 Services for Card
Q1 2010 Results Analyst Presentation Henk van Dalen, CFO 3 May 2010
 Q1 2010 Results Analyst Presentation Henk van Dalen, CFO 3 May 2010 Overall trading conditions continue to improve GROUP Operating income 251 million ( 163 million in Q1 20); quarter benefited from four
Quest for Growth Results for Q3, January-March 2003
 Quest for Growth Results for Q3, January-March 2003 1 Jan Keuppens joins Quest Management Investment Manager Quoted Portfolio of Quest for Growth Former technology analyst with AXA Investment Managers,
Guide to Risk and Investment
 www.canaccord.com/uk Guide to Risk and Investment Any investment involves a degree of risk and some investments are more risky than others. Whether this is the first time you have considered investing,
Annual Borrowing Plan
 20154 Bosnia and Herzegovina Federation of Bosnia and Herzegovina Federal Ministry of Finance Annual Borrowing Plan 2016 January 2016 www.fmf.gov.ba INTRODUCTION In order to increase transparency, fiscal