MAST ACADEMY OUTREACH. WOW (Weather on Wheels)
|
|
|
- Eleanore Ashley Hill
- 7 years ago
- Views:
Transcription
1 MAST ACADEMY OUTREACH MIDDLE SCHOOL PROGRAM Adventures Aboard WOW (Weather on Wheels) Pre-Site Packet MAST Academy Maritime and Science Technology High School Miami-Dade County Public Schools Miami, Florida 23

2 MAST ACADEMY OUTREACH WOW PRE-SITE PACKAGE TABLE OF CONTENTS Sunshine State Standards FCAT Benchmarks Grade 8 1 Teacher Instructions 3 Temperature 4 Relative Humidity 5 Activity: Paper Weather 7 Clouds and Precipitation 9 Activity: The Answer Lies in the Clouds 10 Air Masses and Fronts 12 Air Pressure 14 Wind and Hurricanes 16 Activity: On the Right Track 18 Answer Keys 21 22

3 WEATHER ON WHEELS SUNSHINE STATE STANDARDS FCAT BENCHMARKS GRADE 8 SCIENCE SUNSHINE STATE STANDARDS BENCHMARKS ASSESSED AT GRADE 8 STRAND A: THE NATURE OF MATTER SC.A The student knows that temperature measures the average energy of motion of the particles that make up the substance. CS STRAND B: ENERGY SC.B The student knows the processes by which thermal energy tends to flow from a system of higher temperature to a system of lower temperature. SC.B The student knows that most events in the universe (e.g. weather changes, moving cars) involve some form of energy transfer and that these changes almost always increase the total disorder of the system and its surroundings, reducing the amount of useful energy. STRAND D: PROCESSES THAT SHAPE THE EARTH SC.D1.3.3 The student knows how conditions that exist in one system influence the conditions that exist in other systems. CS STRAND H: THE NATURE OF SCIENCE SC.H The student recognizes that patterns exist within and across systems. CS SC.H The student knows that computers speed up and extend people s ability to collect, sort, and analyze data; prepare research reports; and share data and ideas with others. MATHEMATICS SUNSHINE STATE STANDARDS BENCHMARKS ASSESSED AT GRADE 8 Big Idea I: Analyze and represent linear functions and solve linear equations and systems of linear equations. MA.8.A.1.1 Create and interpret tables, graphs, and models to represent, analyze, and solve problems related to linear equations, including analysis of domain, range and the difference between discrete and continuous data. MA.8.A.1.3 Use tables, graphs, and models to represent, analyze, and solve real-world problems related to systems of linear equations. MA.8.A.1.5 Translate among verbal, tabular, graphical and algebraic representations of linear functions. Big Idea 3: Analyze and summarize data sets. MA.8.S.3.1 Select, organize and construct appropriate data displays, including box and whisker plots, scatter plots, and lines of best fit to convey information and make conjectures about possible relationships. 1
 involve some form of energy transfer and that these changes almost always increase the total disorder of the system and its surroundings, reducing the amount of useful")
4 READING SUNSHINE STATE STANDARDS BENCHMARKS ASSESSED AT GRADE 8 LA.A Uses a variety of strategies to analyze words and text, draw conclusions, use context and word structure clues, and recognize organizational patterns. LA.A Determines the main idea or essential message in a text and identifies relevant details and facts and patterns of organization. LA.A Locates, organizes, and interprets written information for a variety of purposes, including classroom research, collaborative decision-making, and performing a school or realworld task. WRITING SUNSHINE STATE STANDARDS BENCHMARKS ASSESSED AT GRADE 8 LA.B The student organizes information before writing according to the type and purpose of writing LA.B Clarification The student demonstrates knowledge of effective ways to focus on a central idea or topic. LA.B The student writes text, notes, outlines, comments, and observations that demonstrate comprehension of content and experiences from a variety of media. LA.B The student uses electronic technology, including databases and software, to gather information and communicate new knowledge. 2

5 TEACHER INSTRUCTIONS WEATHER ON WHEELS PRE-SITE ACTIVITIES 1. Show the Weather on Wheels Pre-site DVD for instructions to prepare you and your students for this experience. Please return the video to MAST Academy, Location 7161 after viewing it. 2. Review each pre-site activity to decide which are most appropriate for your students. Make class copies of presite activities and have students complete each one. 3. In addition to the handouts provided in this packet, students will need the following materials to complete the activities: Paper Weather: weather forecast from the Miami Herald colored pencils (blue, green, yellow, orange, red) The Answer Lies in the Clouds: photographs showing clouds magazines with pictures showing clouds scissors glue posterboard Weathering the Weather: colored pencils (red, blue) On the Right Track: Scissors Too Much, Too Little, or Just Right: colored pencils calculators 4. Grade each activity you used (answer keys are provided) and total points. The grade for the pre-site activities should be incorporated into a total grade of pre, on, and post-site activities to be used to award certificates of achievement. 3

6 TEMPERATURE Background Temperature is a measurement of internal energy: of how fast molecules of a substance are moving. For instance, energy from the sun causes molecules of air to move faster. As the moving molecules bump into each other more frequently, friction from the bumping produces heat, which is measured as an increase in temperature. A thermometer is used to measure temperature. Thermometers for measuring air temperature contain mercury or red-colored alcohol, which expands and rises as the temperature increases, and contracts and moves down the tube as the temperature decreases. Temperature can be measured with temperature scales. Two common scales are Fahrenheit, which is used most often in the United States, and Celsius (or Centigrade), which is used in most other countries, as well as by most scientists. On Weather on Wheels, you will use both scales to measure temperature. When measuring relative humidity, you ll need to read Celcius scale thermometers. You'll also measure temperature electronically, using the Weather Monitor. Weather Monitor Thermometer PRACTICE: Using the thermometer on the right: 1. What is the temperature in degrees Celsius? 2. What is the temperature in degrees Fahrenheit? 0 C 0 F 4

7 RELATIVE HUMIDITY Background Humidity refers to the amount of moisture in the air. Warmer air can hold more moisture than colder air. By comparing how much water vapor is in the air to how much water vapor the air can hold, we get a percentage called the relative humidity. When the relative humidity reaches 100%, we say the air is saturated or has reached the dewpoint. At this point if the temperature cools even more, or if more water evaporates and tries to escape into the air as a gas, the moisture that the air cannot hold is forced out as drops of water. These could be in the form of dew, frost, fog, or clouds, depending on where and when the change is taking place. On Weather on Wheels, you will measure relative humidity using two instruments; a hygrometer and a sling psychrometer. A hygrometer consists of a scale with a strand of fiber connected to a pointer. As the humidity decreases, the fiber tightens; increasing humidity loosens the fiber. A sling psychrometer contains two thermometers: one is kept dry (the dry bulb), while the other is kept wet (the wet bulb.) Heat is required for water to change from liquid to vapor - a process called evaporation. Spinning the psychrometer evaporates moisture on the wet bulb thermometer, resulting in a lower reading. By comparing the readings on both thermometers, the relative humidity can be calculated. You will use a relative humidity conversion chart to calculate the relative humidity. Hygrometer Sling Psychrometer 5

8 On the right is a typical relative humidity conversion chart (using Celsius.) The dry bulb temperatures are shown in the first column (on the left), while the difference of dry bulb minus wet bulb temperature is shown in the first row (on top.) Lets say that after spinning the sling psychrometer for one minute, you obtain a wet bulb temperature of 20 o C, and a dry bulb temperature of 25 o C. To calculate the relative humidity from the wet and dry bulb thermometer readings: Find 25 0 C in the dry bulb column. Find the difference of dry bulb minus wet bulb temperature (25 o C minus 20 0 C = 5 o C) in the top row. Read down this column until you reach the row of the dry bulb temperature (25 0 C.) The number where this column and the dry bulb temperature row meet is the relative humidity. In this example, the relative humidity is 63%. PRACTICE: Use the relative humidity conversion chart to solve the following problems. Dry Bulb Temperature Wet Bulb Temperature Relative Humidity C C % C 27 0 C % C 23 0 C % C 25 0 C % 6

9 Activity: Paper Weather Directions: Using the weather forecast from the Miami Herald: 1. What is the warmest city in the country today? What is the coldest city in the country today? 2. What will the high temperature be in Miami today? 3. Using the list of major U.S. cities and the highest temperature expected in each city that day, place the cities on the blank outline map of the United States on the opposite page, and write in their temperatures. (You may need an atlas to help you.) 4. Isotherms are lines connecting points of equal temperature on a map. Draw isotherms connecting cities on your map whose temperatures fall within 10 degrees of each other. In this way you can observe different zones, each with similar temperatures. 5. Use colored pencils to fill in each temperature zone. Choose a color scale ranging from blue to green for the cooler areas and yellow to orange for the warmer areas. Use red for hot areas. 6. Why do temperatures gradually become cooler as you go toward the poles? 7. What was the percent humidity in Miami yesterday morning? % What was the percent humidity in Miami yesterday evening? % 7
 4. Isotherms are lines connecting points of equal temperature on a map.")
10 8

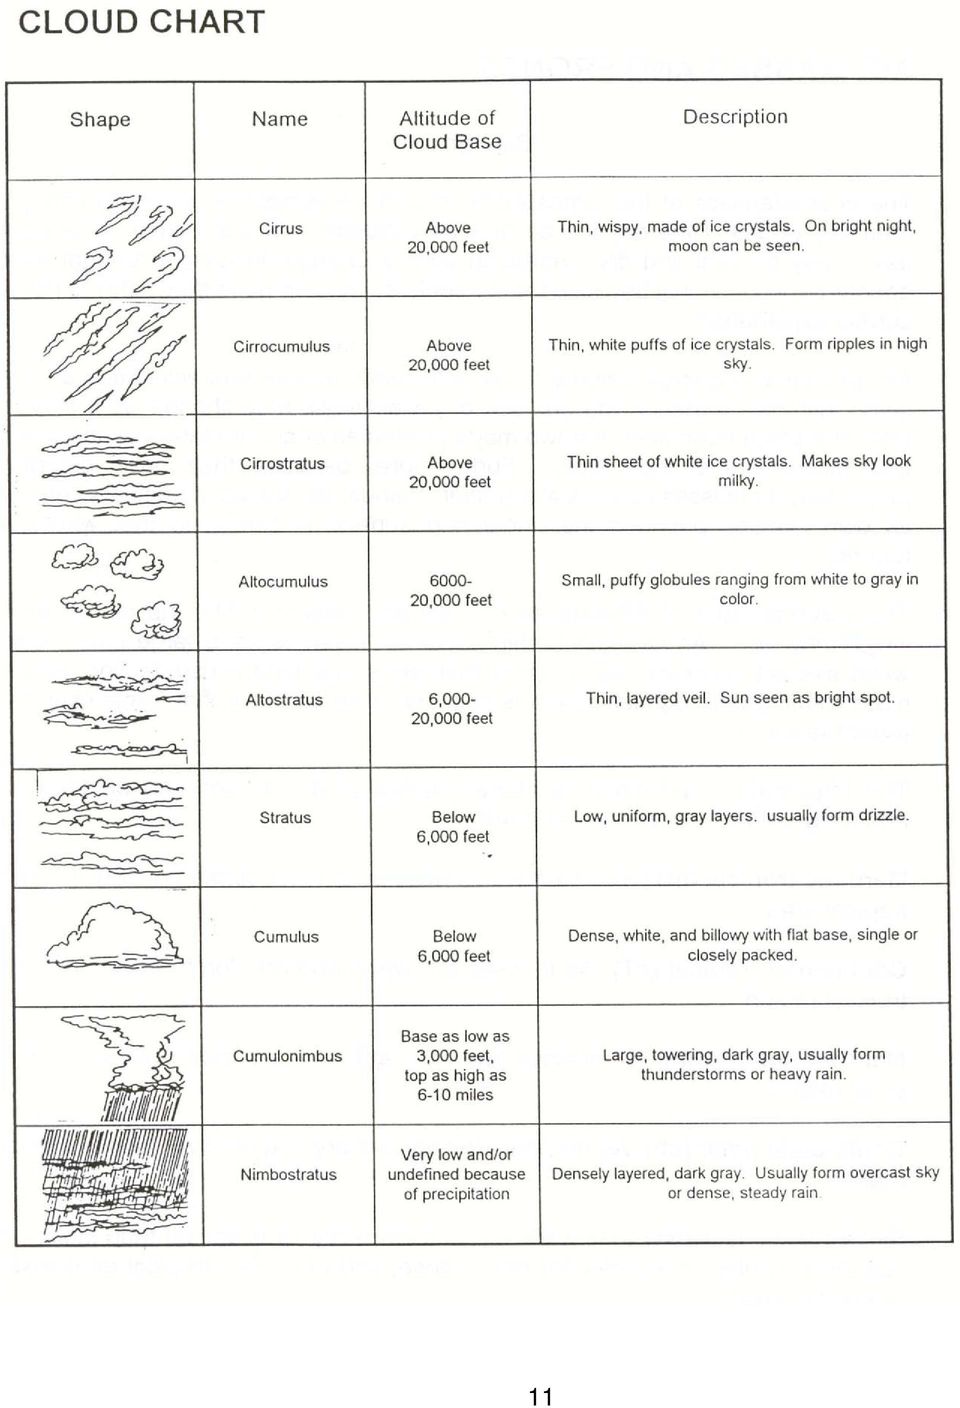
11 CLOUDS AND PRECIPITATION Background When asked to draw a picture of the sky on a typical Florida day, many of us will depict a blue sky dotted with large, cotton-puff clouds. To meteorologists, however, the presence of any cloud in the sky is a sign that weather changes may be on the way. Clouds come in many shapes and sizes, and it takes an understanding of their differences to predict changes in the weather. The structure of a cloud depends on where it develops. In general, clouds form when solar heating of the earth's surface warms air near the ground and it begins to rise. As this air rises, it expands and cools. In the process, water vapor may condense on small dust particles suspended in the air, which then combine to form clouds. Clouds also form when the large masses of air that constantly move above us collide with each other. The denser, colder air forces less dense, warmer or moister air upwards, causing condensation of water vapor on small dust particles. In both cases - the rising of warm, moist, ground-level air and the overriding of one air mass by another - the type of clouds that results can be determined by how fast the air rises. If the air is forced up slowly, stratus clouds are formed. If the air is forced up rapidly and therefore rises higher, cumulus clouds are formed. One way to group clouds is by family characteristic. Stratus clouds are the lowest clouds. They are flat, layered, and can cover the entire sky,giving the appearance of fog. Altostratus clouds are middle altitude clouds. They form thin, layered veils, usually over large areas. Cirrus clouds are high, wispy clouds made of ice crystals. Also in this family are cirrostratus clouds, those high, hazy clouds made of a continuous layer of ice crystals. Cirrocumulus clouds are high clouds made up of thin puffs of ice crystals. Cumulus clouds are thick and fleecy. Their bases are usually flat and low, no matter how tall the clouds themselves are. Altocumulus clouds are small, lumpy patches or globules of clouds that form at altitudes higher than those where cumulus clouds form. Nimbus clouds are clouds that produce precipitation. This precipitation is usually rain, but it can also be mist, hail, sleet or snow. Thus a cumulonimbus cloud is a cumulus cloud with precipitation. A nimbostratus cloud is a stratus cloud with precipitation. Clouds may also be classified by altitude, that is, height of the cloud base above sea level. Low altitude clouds (below 6000 feet) are the stratus, cumulus, and nimbostratus clouds. Middle altitude clouds ( ,000 feet) are the altostratus and altocumulus clouds. 9

12 High altitude clouds (above 20,000 feet) are the cirrus, cirrostratus, and cirrocumulus clouds. Cumulonimbus clouds span all three of these altitudes; their tops may reach up six to ten miles, while their bases may be below 3000 feet. Study the cloud chart on the following page. On Weather on Wheels, you will use a cloud chart to determine the kinds of clouds you see that day. You will also use a rain gauge to measure any precipitation that has fallen that day. Rain Gauge Activity: The Answer Lies in the Clouds Directions: 1. Get your family's permission to bring some photographs with clouds in them to class. Also get permission to bring some magazines that have pictures with clouds in them to class for cutting up. 2. Tell the class where each of the family photos were taken, who is in them, and the types of clouds that are in the sky (use the cloud chart on the following page to help you). When you bring the photos back home, identify the clouds in the photos for your family and describe what they look like. 3. Find pictures of as many different types of clouds as possible in the magazines. Cut the pictures out, glue them on to a posterboard, and write the name of each type of cloud under its picture. Trade magazine pictures with your classmates until you get a good collection for your poster. 10

13 11
14 AIR MASSES AND FRONTS Background The characteristics of the atmosphere around us sometimes seem to change from day to day. One day the air may be extremely hot and humid. The next day it may be cool and dry. Although such a change occuring overnight may appear to occur simply because the air cools as the sun goes down, this is not a correct explanation. An air mass is a large volume of air with fairly uniform characteristics at any given altitude. Although the position of an air mass may change as it moves from one place to another, the two major properties of an air mass - temperature and moisture - change little. Furthermore, because they have different properties, air masses can mix along their bounderies, but each basically retains its own identity, provided the underlying surface is similar to that where it formed. The characteristics of different air masses are determined by the places over which they form. An air mass forming over an ocean contains large amounts of water and is thus moist. An air mass that forms over land is usually dry. An air mass forming over a polar region is cold, while an air mass that forms over the tropics is warm. The temperature and moisture characteristics of air masses can be used to arbitrarily define four types of air masses: Maritime tropical (mt). Air masses are warm and moist; formed over water in a tropical area. Continental tropical (ct). Air masses are warm and dry; formed overland in a tropical region. Maritime polar (mp). Air masses are cool and moist; formed over water in a polar region. Continental polar (cp). Air masses are cool and dry; formed over land in a polar region. Since cold air is denser than warm air, and since dry air is denser than moist air, continental polar air masses are most dense, while maritime tropical air masses are least dense. When different air masses meet, the place where they make contact with each other is known as a front or frontal zone. Clouds often form along the front separating air masses and, many times, some type of precipitation is produced. In the tropics, fronts are much less frequent than at higher latitudes, and then mostly during the winter. 12

15 A cold front is formed when the leading edge of a cool air mass moves into a warm air mass. Because cool air is much denser and therefore heavier, it pushes the lighter, warm air up. The situation causes the warm air to rise rapidly and cumulus or cumulonimbus clouds often form. Thunderstorms may occur along a cold front. A warm front is the leading edge of a warm air mass. It is formed when a warm air mass overtakes and rides up over a cooler air mass. A warm front is not as steep as a cold front. This is because the advancing warm air cannot push the heavy cool air out of its way. Instead, the warm air ascends over the cool air, forming clouds that rise slowly to middle and high altitudes above the front, and also ahead of it. Behind and below come the altostratus clouds. They are followed by the still lower stratus and nimbostratus clouds. Precipitation formed by a warm front usually takes the form of a lingering drizzle or slow, steady rain. Such a weather system moves slowly and may take 12 to 24 hours to pass over an area on Earth. A stationary front is a boundary that separates two different air masses that exhibit little or no movement. The temperature on one side of the front may be much colder than on the other side of the front. Fronts can dissipate if the differences in the densities of the adjacent air masses decreases and essentially vanishes. Below are weather map symbols for cold, warm and stationary fronts. Cold Front Warm Front Stationary Front 13

16 AIR PRESSURE Background The atmosphere, or air, around us exerts a certain amount of pressure that pushes against everyone and everything on Earth. We don t usually notice this pressure because it comes at us equally from all directions. Atmospheric pressure at sea lavel is roughly 14.5 pounds for every square inch of surface. In areas above sea level, the pressure on a clear day will be less. Changes in air pressure can have an enourmous influence on weather because they make the air move around. On a rotating planet, the air flow, or wind around a pressure system always spirals around the center of that area. In a high pressure system, the air sinds, flowing down and spiraling out from the center of the system; this flow is clockwise in the Northern hemisphere and counterclockwise in the Southern Hemisphere. This system is also known as an anticlyclone or high. In a low pressure system, the air rises and the surrounding air moves in toward the center of the system to compensate for the loss of mass and spirals inward, or counterclockwise in the Northern Hemisphere and clockwise in the Southern Hemisphere. This system is also known as a cyclone or low. These clockwise and counterclockwise air motions affect the type of fronts that form when air masses meet. In general, fronts are produced when pressure systems pull air masses with different properties close together. Because the cool, dry air usually pulled from the polar regions does not mix in with the warm, moist air from the tropical regions, two fronts are usually formed. A warm front forms along the leading edge of warmer air, and a cold front forms along the leading edge of colder air. It is along these two fronts that clouds are produced and precipitation occurs. 14

17 On Weather on Wheels, you will measure differences in air pressure using an aneroid barometer. An aneroid barometer consists of a small metal can with some of the air removed. Changes in air pressure will push in or push out the sides of the can; a lever mounted on the can, attached to a pointer, will measure these pressure changes. Air pressure can be measured in inches or millibars (mb). On Weather on Wheels, you will record air pressure in millibars. One mb is equal to about 0.03 inches. If you record at sea level a high pressure reading (above inches or 1015 mb), this usually means that air is sinking. It is therefore exerting great force on the barometer. Generally, high pressure is associated with air that is cool and dry and skies that are clear. If you find yourself in bad weather but notice that the barometer is rising, expect good weather to be on the way. A low pressure reading (below inches or 1015 mb) at sea level means that air at the surface of the Earth is ascending and exerting less downward force on the barometer. With warm air rising, clouds, usually accompanied by some form of precipitation, form. When the weather is nice, but the barometer starts to fall, it means a period of inclement weather is on the way. On a weather map, a line connecting points of equal air pressure is called an isobar. On the map on the right, every point along the isobar labled 1020 has a pressure of 1020 millibars. Isobars are drawn in increments of 4 (996, 1000, 1004, 1008, etc.) Notice that isobars never cross or touch. The more closely isobars are spaced, the stonger winds will be in that area, as air moves from areas of high pressure (above 1015 mb) to areas of low pressure (below 1015 mb). PRACTICE: Use the map above to answer the following questions: 1. What is the pressure along the isobar between 1012 and 1020 mb? 2. What is the pressure along the isobar between 1012 and 1004 mb? 3. The left side of the map is west and the right side is east. In which direction is the wind blowing, from west to east or from east to west? WIND AND HURRICANES 15
, this usually means that air is sinking. It is therefore exerting great force on the barometer.")
18 Background Look about you for the movement of clouds in the sky, or a flag on a pole. Air is moving, sometimes lightly, occasionally strongly. Wind is air in motion. What keeps the air in constant motion around the earth? On a local scale, the most important factor is the incoming solar energy from the sun that is heating the Earth. Since land heats and cools faster than water, on a sunny day, warm air rising from land heated by the sun flows toward the cooler water where the air sinks. The cooler air then moves in toward land again to replace the warm air that is rising. This cycle continues as long as the daytime heating continues from the sun. Since air moves inland from the water, the wind is called a sea breeze. At night, the opposite cycle occurs. Since the land cools quicker than water, air over the warmer water rises and flows toward cooler land where the air sinks. This reverse cycle of wind blowing out to sea is called a land breeze. On a global scale, the tropical regions receive more solar radiation and heating than the poles. Similar to the land and sea breezes, the difference of heating of the earth's surface creates cycles of air movement. Air rises at the equator and sinks as it reaches higher latitudes. Air moving between the two regions is curved by the rotation of the earth to create our wind. The prevailing Westerlies is the wind belt at middle latitudes that generally move weather systems there from west to east. The same difference of the earth's heating that causes the prevailing westerlies also causes a strong "river" of strong winds high above the surface of the earth. The Jet Stream is a narrow band of strong wind in the upper atmosphere. The center of this wind is usually found from 6 to 9 miles above the earth's surface, and flows around the earth at speeds of about 100 to 250 miles per hour. The jet stream is stronger in winter, since the temperature difference at frontal bounderies is greatest in the winter and early spring. During the winter, the jet stream is often the frontal boundary separating cold polar air at higher latitudes from the warm subtropical air of lower latitudes. On Weather on Wheels you will measure wind speed using a Turbometer, a hand-held anemometer. You will measure the wind speed in miles per hour. You will also be able to determine the direction the wind is blowing, using a wind Hurricanes vane, located are at the among weather station. most severe of all wind-driven weather systems. They are extreme low-pressure systems, or cyclones, where the air spirals rapidly into the center of the low. High winds and 16

19 flooding from heavy rain and storm surge often occur, frequently bringing tremendous damage and many deaths in their wake. Hurricane Andrew, which struck South Florida on August 24 of 1992, is considered the most costly natural disaster in the history of the United States, with 35,000 homes destroyed, 300,000 people left temporarily homeless, and property losses exceeding $30 billion. Hurricanes develop over the oceans in the tropical regions, most often in late summer and autumn, when sea surface temperatures are highest. They can range from 50 miles to 1000 miles in diameter, with maximum sustained winds from 74 miles per hour to as high as 200 miles per hour. In a hurricane, thick, water-laden cumulonimbus clouds form a circular spiral structure; the closer the clouds are to the center of the lowpressure system, the stronger the wind and rain. Suprisingly, the very center of the low pressure system, called the "eye" of the hurricane, is a place of relative calm. It contains few, if any, clouds. Sometimes the sun or stars are visible. This pleasant condition is deceptive because high winds and tremendous rains at the edge of the hurricane eye are ravaging Earth's surface. The Atlantic hurricane season is defined as June 1st through November 30th. On the average, six hurricanes a year form in the tropical areas of the Atlantic Ocean, Gulf of Mexico, or the Caribbean, and then move westward. Some storms turn northward, a process called recurvature; storm surges and floods from rainfall in coastal areas sometimes result. The National Weather Service is responsible for warning us about approaching hurricanes. Weather satellites provide the first indications of the enhanced convective cloudiness and cyclonic wind circulations that signal the beginning of a tropical depression. a tropical storm or hurricane. Hurricane conditions are also reported to the National Weather Service by airplanes, weather balloons, and ground radar stations. Although hurricanes normally move slowly, it is difficult to predict their exact path because they can change direction and accelerate very quickly, or can intensify (or weaken) rapidly. The National Weather Service Issues a Hurricane Watch for a coastal area if it looks as if a hurricane may be striking within 24 to 36 hours. A Hurricane Warning is issued when a hurricane appears to be headed directly toward a specific area and is expected to hit the area in 24 hours or less. Action should be taken to protect yourself and your property as soon as you learn that a hurricane may be on its way to your area. On Weather on Wheels, you will be expected to know how to read a hurricane tracking chart, which meteorologists use to plot the movement of a hurricane. The position of a hurricane is detemined by it s latitude and longitude. Lines of latitude run 17

20 east/west on a map or globe (the equator is 0 0 latitude), while lines of longitude rune north/south. Activity: On the Right Track A hurricane has been spotted in the Atlantic Ocean. Every twelve hours, between 7:00 a.m. and 7:00 p.m., you will receive information on the location of the eye of the hurricane and be asked to give the proper warnings to the areas that may be affected. Assume that it is a weak (Category 1) hurricane. You must issue a hurricane warning at least 12 hours of daylight before the hurricane hits so that people have time to evacuate the area. Remember that it is dangerous to evacuate an area at night, too many accidents can occur, and people might panic. Each time you get the location (in latitude North and longitude West) of the hurricane eye, plot its position on the hurricane tracking map. The hurricane, however, is much larger than its eye. Therefore, cut out the drawing of the hurricane on the previous page and place it in the proper position on the map (cut out the hurricane's eye so you can see the proper position). All areas covered by the entire hurricane will experience strong winds and heavy rains. Let's begin: 7:00 a.m., August 1 - Hurricane center at 25 N and 64 W 1. Place the hurricane at that position on your map. 2. Give the new hurricane a name. 7:00 p.m., August 1 - Hurricane center at 26 N and 67 W 3. Will you issue any warnings? Why? 7:00 a.m., August 2 - Hurricane center at 27 N and 70 W 4. Where is the hurricane heading? 5. How far has it traveled in the last 12 hours? 6. Assume that it will be continuing at that same speed and direction. Where will it be in the next 12 hours? 7. Will you issue any warnings? For what areas? 18

21 7:00 p.m., August 2 - Hurricane center at 28 N and 73 W 8. In what direction is the storm moving now? 9. Should you give warnings now to the people in any areas? 10. Has the hurricane speed remained the same? 7:00 a.m., August 3 - Hurricane center at 28 N and 76 W 11. Should you give warnings to any areas now? 12. What areas will be affected? 13. Can you wait until the next location reading to give the warnings? Why? 7:00 p.m., August 3 - Hurricane center at 29 N and 79 W 14. In what direction do you think the hurricane will continue? 15. Should you give out any new warnings? 7:00 a.m., August 4 - Hurricane center at 30 N and 81 W 16. What direction did the hurricane take? 17.What was the approximate time of landfall? 18.How much time did people in warned areas have to evacuate? 19
22 20
23 ANSWER KEYS Temperature Practice (page 5) C F Relative Humidity Practice (page 7) 1. 81% 2. 79% 3. 68% 4. 54% Paper Weather (page 8) 1. Answers will vary. 2. Answers will vary. 6. As one travels from the equator to the poles, the sun's rays shine at more of a slant, and are thus less powerful. 7. Answers will vary. Air Pressure Practice (page 15) mb mb 3. west to east On the Right Track (page 18) 2. Answers will vary. 3. No. The hurricane is more than 12 hours from landfall and is moving W - NW. 4. W - NW (toward the GA - SC border) degree latitude (193 nautical miles) N 73 W 7. Maybe. Northern Bahamas. 8. W - NW 9. No (watches may be issued). Maybe Northern Bahamas. 10. Yes 11. Yes 12. Northern Bahamas, Florida, Southern Georgia 13. No. It is within 12 hours of landfall. 14. W to W - NW 15. Florida West Coast 16. W - NW 17. Midnight to 3 a.m. August hours (12 hours of daylight) 21
24 24
2. The map below shows high-pressure and low-pressure weather systems in the United States.
 1. Which weather instrument has most improved the accuracy of weather forecasts over the past 40 years? 1) thermometer 3) weather satellite 2) sling psychrometer 4) weather balloon 6. Wind velocity is
Name: OBJECTIVES Correctly define: WEATHER BASICS: STATION MODELS: MOISTURE: PRESSURE AND WIND: Weather
 Name: OBJECTIVES Correctly define: air mass, air pressure, anemometer, barometer, cyclone, dew point, front, isobar, isotherm, meteorology, precipitation, psychrometer, relative humidity, saturated, transpiration
Read and study the following information. After reading complete the review questions. Clouds
 Name: Pd: Read and study the following information. After reading complete the review questions. Clouds What are clouds? A cloud is a large collection of very tiny droplets of water or ice crystals. The
Partnerships Implementing Engineering Education Worcester Polytechnic Institute Worcester Public Schools
 Partnerships Implementing Engineering Education Worcester Polytechnic Institute Worcester Public Schools Supported by: National Science Foundation Weather: 4.H.3 Weather and Classical Instruments Grade
7613-1 - Page 1. Weather Unit Exam Pre-Test Questions
 Weather Unit Exam Pre-Test Questions 7613-1 - Page 1 Name: 1) Equal quantities of water are placed in four uncovered containers with different shapes and left on a table at room temperature. From which
Name Period 4 th Six Weeks Notes 2015 Weather
 Name Period 4 th Six Weeks Notes 2015 Weather Radiation Convection Currents Winds Jet Streams Energy from the Sun reaches Earth as electromagnetic waves This energy fuels all life on Earth including the
WEATHER AND CLIMATE practice test
 WEATHER AND CLIMATE practice test Multiple Choice Identify the choice that best completes the statement or answers the question. 1. What role does runoff play in the water cycle? a. It is the process in
FOURTH GRADE WEATHER
 FOURTH GRADE WEATHER 1 WEEK LESSON PLANS AND ACTIVITIES WATER CYCLE OVERVIEW OF FOURTH GRADE WATER WEEK 1. PRE: Comparing different reservoirs of water. LAB: Experimenting with surface tension and capillary
How Do Oceans Affect Weather and Climate?
 How Do Oceans Affect Weather and Climate? In Learning Set 2, you explored how water heats up more slowly than land and also cools off more slowly than land. Weather is caused by events in the atmosphere.
Humidity, Condensation, Clouds, and Fog. Water in the Atmosphere
 Humidity, Condensation, Clouds, and Fog or Water in the Atmosphere The Hydrologic Cycle Where the Water Exists on Earth Evaporation From the Oceans and Land The Source of Water Vapor for the Atmosphere
SIXTH GRADE WEATHER 1 WEEK LESSON PLANS AND ACTIVITIES
 SIXTH GRADE WEATHER 1 WEEK LESSON PLANS AND ACTIVITIES WATER CYCLE OVERVIEW OF SIXTH GRADE WATER WEEK 1. PRE: Evaluating components of the water cycle. LAB: Experimenting with porosity and permeability.
FOR SUBSCRIBERS ONLY! - TRIAL PASSWORD USERS MAY NOT REPRODUCE AND DISTRIBUTE PRINTABLE MATERIALS OFF THE SOLPASS WEBSITE!
 FOR SUBSCRIBERS ONLY! - TRIAL PASSWORD USERS MAY NOT REPRODUCE AND DISTRIBUTE PRINTABLE MATERIALS OFF THE SOLPASS WEBSITE! 1 NAME DATE GRADE 5 SCIENCE SOL REVIEW WEATHER LABEL the 3 stages of the water
Weather Forecasting. DELTA SCIENCE READER Overview... 103 Before Reading... 104 Guide the Reading... 105 After Reading... 114
 Weather Forecasting T ABLE OF CONTENTS ABOUT DELTA SCIENCE MODULES Program Introduction................... iii Teacher s Guide..................... iv Delta Science Readers................ vi Equipment
What Causes Climate? Use Target Reading Skills
 Climate and Climate Change Name Date Class Climate and Climate Change Guided Reading and Study What Causes Climate? This section describes factors that determine climate, or the average weather conditions
Storms Short Study Guide
 Name: Class: Date: Storms Short Study Guide Multiple Choice Identify the letter of the choice that best completes the statement or answers the question. 1. A(n) thunderstorm forms because of unequal heating
Air Masses and Fronts
 Air Masses and Fronts Air Masses The weather of the United States east of the Rocky Mountains is dominated by large masses of air that travel south from the wide expanses of land in Canada, and north from
Basics of weather interpretation
 Basics of weather interpretation Safety at Sea Seminar, April 2 nd 2016 Dr. Gina Henderson Oceanography Dept., USNA ghenders@usna.edu Image source: http://earthobservatory.nasa.gov/naturalhazards/view.php?id=80399,
6 th Grade Science Assessment: Weather & Water Select the best answer on the answer sheet. Please do not make any marks on this test.
 Select the be answer on the answer sheet. Please do not make any marks on this te. 1. Weather is be defined as the A. changes that occur in cloud formations from day to day. B. amount of rain or snow that
Geography affects climate.
 KEY CONCEPT Climate is a long-term weather pattern. BEFORE, you learned The Sun s energy heats Earth s surface unevenly The atmosphere s temperature changes with altitude Oceans affect wind flow NOW, you
Temperature affects water in the air.
 KEY CONCEPT Most clouds form as air rises and cools. BEFORE, you learned Water vapor circulates from Earth to the atmosphere Warm air is less dense than cool air and tends to rise NOW, you will learn How
THIRD GRADE WEATHER 1 WEEK LESSON PLANS AND ACTIVITIES
 THIRD GRADE WEATHER 1 WEEK LESSON PLANS AND ACTIVITIES WATER CYCLE OVERVIEW OF THIRD GRADE WATER WEEK 1. PRE: Comparing the different components of the water cycle. LAB: Contrasting water with hydrogen
8.5 Comparing Canadian Climates (Lab)
") These 3 climate graphs and tables of data show average temperatures and precipitation for each month in Victoria, Winnipeg and Whitehorse: Figure 1.1 Month J F M A M J J A S O N D Year Precipitation 139
These 3 climate graphs and tables of data show average temperatures and precipitation for each month in Victoria, Winnipeg and Whitehorse: Figure 1.1 Month J F M A M J J A S O N D Year Precipitation 139
Chapter Overview. Seasons. Earth s Seasons. Distribution of Solar Energy. Solar Energy on Earth. CHAPTER 6 Air-Sea Interaction
 Chapter Overview CHAPTER 6 Air-Sea Interaction The atmosphere and the ocean are one independent system. Earth has seasons because of the tilt on its axis. There are three major wind belts in each hemisphere.
Hurricanes. Characteristics of a Hurricane
 Hurricanes Readings: A&B Ch. 12 Topics 1. Characteristics 2. Location 3. Structure 4. Development a. Tropical Disturbance b. Tropical Depression c. Tropical Storm d. Hurricane e. Influences f. Path g.
YEAR 1: Seasons and Weather
 YEAR 1: Seasons and Weather Contents Include: The four seasons Tools to record the weather Making graphs Clouds Weather forecasts Weather around the world Please Note: The activities included in this pack
UNIT IV--TEMPERATURE-MOISTURE RELATIONSHIP
 UNIT IV--TEMPERATURE-MOISTURE RELATIONSHIP Weather is the most variable and often the most critical determinant of fire behavior. This is the first of several units that will deal with weather and its
WEATHER THEORY Temperature, Pressure And Moisture
 WEATHER THEORY Temperature, Pressure And Moisture Air Masses And Fronts Weather Theory- Page 77 Every physical process of weather is a result of a heat exchange. The standard sea level temperature is 59
Description: This competition will test the student's knowledge of meteorological terms, techniques, and events.
 Weather or Not Description: This competition will test the student's knowledge of meteorological terms, techniques, and events. Number of Participants: 2 Approximate Time: 45 minutes The Competition: 1.
Sample Cooperative Learning Lesson Plan
 1 Sample Cooperative Learning Lesson Plan OVERVIEW Subject Grade Level Topic Brief Overview and Explanation PLANNING Objectives Assessment Pre / Diagnostic Formative (informal and/or formal) Summative
WeatherBug Vocabulary Bingo
 Type of Activity: Game: Interactive activity that is competitive, and allows students to learn at the same time. Activity Overview: WeatherBug Bingo is a fun and engaging game for you to play with students!
CGC1D1: Interactions in the Physical Environment Factors that Affect Climate
 Name: Date: Day/Period: CGC1D1: Interactions in the Physical Environment Factors that Affect Climate Chapter 12 in the Making Connections textbook deals with Climate Connections. Use pages 127-144 to fill
barometer 1 of 5 For the complete encyclopedic entry with media resources, visit: http://education.nationalgeographic.com/encyclopedia/barometer/
 This website would like to remind you: Your browser (Apple Safari 4) is out of date. Update your browser for more security, comfort and the best experience on this site. Encyclopedic Entry For the complete
Lecture 4: Pressure and Wind
 Lecture 4: Pressure and Wind Pressure, Measurement, Distribution Forces Affect Wind Geostrophic Balance Winds in Upper Atmosphere Near-Surface Winds Hydrostatic Balance (why the sky isn t falling!) Thermal
Analyze Weather in Cold Regions and Mountainous Terrain
 Analyze Weather in Cold Regions and Mountainous Terrain Terminal Learning Objective Action: Analyze weather of cold regions and mountainous terrain Condition: Given a training mission that involves a specified
UNIT VII--ATMOSPHERIC STABILITY AND INSTABILITY
 UNIT VII--ATMOSPHERIC STABILITY AND INSTABILITY The stability or instability of the atmosphere is a concern to firefighters. This unit discusses how changes in the atmosphere affect fire behavior, and
COMMON CORE Lessons & Activities
 T E AC H I T SA M PL E COMMON CORE Lessons & Activities DAY! O T Common Core Lessons & Activities: Weather By Carole Marsh Published by Gallopade International, Inc. Carole Marsh/Gallopade Printed in the
Activity 8 Drawing Isobars Level 2 http://www.uni.edu/storm/activities/level2/index.shtml
 Activity 8 Drawing Isobars Level 2 http://www.uni.edu/storm/activities/level2/index.shtml Objectives: 1. Students will be able to define and draw isobars to analyze air pressure variations. 2. Students
Lecture 7a: Cloud Development and Forms Why Clouds Form?
 Lecture 7a: Cloud Development and Forms Why Clouds Form? Clouds form when air rises and becomes saturated in response to adiabatic cooling. Why Clouds Form Cloud Types (from The Blue Planet ) Four Ways
How to analyze synoptic-scale weather patterns Table of Contents
 How to analyze synoptic-scale weather patterns Table of Contents Before You Begin... 2 1. Identify H and L pressure systems... 3 2. Locate fronts and determine frontal activity... 5 3. Determine surface
5. Why does the weather near cities tend to be cloudier and wetter than in rural areas?
 Name: Date: 1. Today weather forecasting is better because of the use of A. barometers. B. telescopes. C. satellites. D. anemometers. 2. The letter H is the weather symbol for A. hail storms. B. humidity.
UNIT 6a TEST REVIEW. 1. A weather instrument is shown below.
 UNIT 6a TEST REVIEW 1. A weather instrument is shown below. Which weather variable is measured by this instrument? 1) wind speed 3) cloud cover 2) precipitation 4) air pressure 2. Which weather station
CHAPTER 5 Lectures 10 & 11 Air Temperature and Air Temperature Cycles
 CHAPTER 5 Lectures 10 & 11 Air Temperature and Air Temperature Cycles I. Air Temperature: Five important factors influence air temperature: A. Insolation B. Latitude C. Surface types D. Coastal vs. interior
Lab Activity on Global Wind Patterns
 Lab Activity on Global Wind Patterns 2002 Ann Bykerk-Kauffman, Dept. of Geological and Environmental Sciences, California State University, Chico * Objectives When you have completed this lab you should
Formation & Classification
 CLOUDS Formation & Classification DR. K. K. CHANDRA Department of forestry, Wildlife & Environmental Sciences, GGV, Bilaspur What is Cloud It is mass of tiny water droplets or ice crystals or both of size
FIRST GRADE 1 WEEK LESSON PLANS AND ACTIVITIES
 FIRST GRADE 1 WEEK LESSON PLANS AND ACTIVITIES UNIVERSE CYCLE OVERVIEW OF FIRST GRADE UNIVERSE WEEK 1. PRE: Describing the Universe. LAB: Comparing and contrasting bodies that reflect light. POST: Exploring
Southern AER Atmospheric Education Resource
 Southern AER Atmospheric Education Resource Vol. 9 No. 5 Spring 2003 Editor: Lauren Bell In this issue: g Climate Creations exploring mother nature s remote control for weather and Climate. g Crazy Climate
CLIMATE, WATER & LIVING PATTERNS THINGS
 CLIMATE, WATER & LIVING PATTERNS NAME THE SIX MAJOR CLIMATE REGIONS DESCRIBE EACH CLIMATE REGION TELL THE FIVE FACTORS THAT AFFECT CLIMATE EXPLAIN HOW THOSE FACTORS AFFECT CLIMATE DESCRIBE HOW CLIMATES
Heat Energy FORMS OF ENERGY LESSON PLAN 2.7. Public School System Teaching Standards Covered
 FORMS OF ENERGY LESSON PLAN 2.7 Heat Energy This lesson is designed for 3rd 5th grade students in a variety of school settings (public, private, STEM schools, and home schools) in the seven states served
Clouds: What They Are and What They Mean. Susannah Lopez. Introduction to Meteorology. 2 December 2008
 Clouds: What They 1 Clouds: What They Are and What They Mean Susannah Lopez Introduction to Meteorology 2 December 2008 Clouds: What They 2 Clouds: What They Are and What They Mean Clouds are composed
6. Base your answer to the following question on the graph below, which shows the average monthly temperature of two cities A and B.
 1. Which single factor generally has the greatest effect on the climate of an area on the Earth's surface? 1) the distance from the Equator 2) the extent of vegetative cover 3) the degrees of longitude
Exploring Florida: Teaching Resources for Science 1 of 6
 Exploring Florida: Teaching Resources for Science 1 of 6 Tropical Cyclones This document describes tropical cyclones and the dangers they pose to coastal populations. It is intended to help teachers improve
The Atmosphere and Winds
 Oceanography 10, T. James Noyes, El Camino College 8A-1 The Atmosphere and Winds We need to learn about the atmosphere, because the ocean and atmosphere are tightly interconnected with one another: you
A Teaching Unit for Years 3 6 children
 A Teaching Unit for Years 3 6 children 1 SEREAD and ARGO: Concept Overview for Years 3-6 Teaching Programme This is the overview for the first part of the SEREAD programme link with ARGO. The overview
Assignment Discovery Online Curriculum. Lesson title: Weather Maps. Grade level: 4-6. Subject area: Earth Science. Duration: Two class periods
 Assignment Discovery Online Curriculum Lesson title: Weather Maps Grade level: 4-6 Subject area: Earth Science Duration: Two class periods Objectives: Students will do the following: Understand basic information
Characteristics of the. thermosphere
 Characteristics of the Atmosphere. If you were lost in the desert, you could survive for a few days without food and water. But you wouldn't last more than five minutes without the ' Objectives Describe
HUMIDITY AND PRECIPITATION
 12 HUMIDITY AND PRECIPITATION In our previous lesson while discussing the composition of the atmosphere, we noted that water vapour, though a minor component, is a very important constituent of the atmosphere.
EXPLANATION OF WEATHER ELEMENTS AND VARIABLES FOR THE DAVIS VANTAGE PRO 2 MIDSTREAM WEATHER STATION
 EXPLANATION OF WEATHER ELEMENTS AND VARIABLES FOR THE DAVIS VANTAGE PRO 2 MIDSTREAM WEATHER STATION The Weather Envoy consists of two parts: the Davis Vantage Pro 2 Integrated Sensor Suite (ISS) and the
This chapter discusses: 1. Definitions and causes of stable and unstable atmospheric air. 2. Processes that cause instability and cloud development
 Stability & Cloud Development This chapter discusses: 1. Definitions and causes of stable and unstable atmospheric air 2. Processes that cause instability and cloud development Stability & Movement A rock,
Ocean in Motion 2: What Causes Ocean Currents and How Do We Measure Them?
 Ocean in Motion 2: What Causes Ocean Currents and How Do We Measure Them? A. Overview 1. The Ocean in Motion -- Circulation In this program, students will learn about the driving forces responsible for
How do I measure the amount of water vapor in the air?
 How do I measure the amount of water vapor in the air? Materials 2 Centigrade Thermometers Gauze Fan Rubber Band Tape Overview Water vapor is a very important gas in the atmosphere and can influence many
ENVIRONMENTAL STRUCTURE AND FUNCTION: CLIMATE SYSTEM Vol. II - Low-Latitude Climate Zones and Climate Types - E.I. Khlebnikova
 LOW-LATITUDE CLIMATE ZONES AND CLIMATE TYPES E.I. Khlebnikova Main Geophysical Observatory, St. Petersburg, Russia Keywords: equatorial continental climate, ITCZ, subequatorial continental (equatorial
Severe Weather. www.readinga-z.com. Visit www.readinga-z.com for thousands of books and materials.
 Severe Weather A Reading A Z Level T Leveled Reader Word Count: 1,801 LEVELED READER T Written by Bruce D. Cooper Illustrations by Cende Hill Visit www.readinga-z.com for thousands of books and materials.
Heat Transfer and the Movement of Air
 LESSON 4 Heat Transfer and the Movement of Air INTRODUCTION How can a hang glider stay up in the air for hours without a motor? How can a bird soar over an open field without flapping its wings? They can
ES 106 Laboratory # 3 INTRODUCTION TO OCEANOGRAPHY. Introduction The global ocean covers nearly 75% of Earth s surface and plays a vital role in
 ES 106 Laboratory # 3 INTRODUCTION TO OCEANOGRAPHY 3-1 Introduction The global ocean covers nearly 75% of Earth s surface and plays a vital role in the physical environment of Earth. For these reasons,
Perth Academy. Geography Department
 Perth Academy Geography Department Natural Hazards Tropical Storms Natural Hazards Natural Hazards affect a large percentage of the world s population. Despite the damage and destruction caused, there
[7] SD3.1 The student demonstrates an understanding of cycles influenced by energy from the
![[7] SD3.1 The student demonstrates an understanding of cycles influenced by energy from the](/thumbs/27/12373649.jpg "[7] SD3.1 The student demonstrates an understanding of cycles influenced by energy from the") Cloud Types Levels Overview: During this project, students learn about different types of clouds and determine which type of cloud is most commonly overhead in their area over a period of four weeks. Objectives:
Cloud Types Levels Overview: During this project, students learn about different types of clouds and determine which type of cloud is most commonly overhead in their area over a period of four weeks. Objectives:
Climate of Illinois Narrative Jim Angel, state climatologist. Introduction. Climatic controls
 Climate of Illinois Narrative Jim Angel, state climatologist Introduction Illinois lies midway between the Continental Divide and the Atlantic Ocean, and the state's southern tip is 500 miles north of
Georgia Performance Standards Framework for Natural Disasters 6 th Grade
 The following instructional plan is part of a GaDOE collection of Unit Frameworks, Performance Tasks, examples of Student Work, and Teacher Commentary. Many more GaDOE approved instructional plans are
How do Scientists Forecast Thunderstorms?
 How do Scientists Forecast Thunderstorms? Objective In the summer, over the Great Plains, weather predictions often call for afternoon thunderstorms. While most of us use weather forecasts to help pick
Chapter 3: Weather Map. Weather Maps. The Station Model. Weather Map on 7/7/2005 4/29/2011
 Chapter 3: Weather Map Weather Maps Many variables are needed to described weather conditions. Local weathers are affected by weather pattern. We need to see all the numbers describing weathers at many
Temperature and Humidity
 Temperature and Humidity Overview Water vapor is a very important gas in the atmosphere and can influence many things like condensation and the formation of clouds and rain, as well as how hot or cold
Content Guide & Five Items Resource
 Content Guide & Five Items Resource Introduction The following information should be used as a companion to the CPI Links. It provides clarifications concerning the content and skills contained in the
(Walter Glogowski, Chaz Shapiro & Reid Sherman) INTRODUCTION
 INTRODUCTION") Convection (Walter Glogowski, Chaz Shapiro & Reid Sherman) INTRODUCTION You know from common experience that when there's a difference in temperature between two places close to each other, the temperatures
Convection (Walter Glogowski, Chaz Shapiro & Reid Sherman) INTRODUCTION You know from common experience that when there's a difference in temperature between two places close to each other, the temperatures
Weather Map Symbols, Abbreviations, and Features
 Weather Map Symbols, Abbreviations, and Features Table of Contents 1. Symbols... 2 Pressure Systems/Fronts... 2 Precipitation... 3 Wind Speed... 4 Center pressures (on Surface Maps)... 4 2. Abbreviations...
Climates are described by the same conditions used to describe
 58 The Causes of Climate R E A D I N G Climates are described by the same conditions used to describe weather, such as temperature, precipitation, and wind. You now know that oceans have an important effect
SECOND GRADE 1 WEEK LESSON PLANS AND ACTIVITIES
 SECOND GRADE 1 WEEK LESSON PLANS AND ACTIVITIES WATER CYCLE OVERVIEW OF SECOND GRADE WATER WEEK 1. PRE: Exploring the properties of water. LAB: Experimenting with different soap mixtures. POST: Analyzing
Grade 4 Standard 1 Unit Test Water Cycle. Multiple Choice. 1. Where is most water found on Earth? A. in glaciers B. in lakes C. in rivers D.
 Grade 4 Standard 1 Unit Test Water Cycle Multiple Choice 1. Where is most water found on Earth? A. in glaciers B. in lakes C. in rivers D. in oceans 2. What source of energy evaporates the most water from
Weather Instruments, Maps and Charts
 Chapter 8 Weather Instruments, Maps and Charts Weather denotes the atmospheric conditions of weather elements at a particular place and time. The weather elements include temperature, pressure, wind, humidity
Education and Outreach Lesson Plan
 Education and Outreach Lesson Plan Visit our online activities collection http://education.arm.gov/ Grade levels K 2 Common Covering Clouds Common Covering Clouds Approximate Time 1 1/2 hours, or two 45-minute
Order of the Weather Experiments
 Order of the Weather Experiments 1. Staying Dry Towel in bottle--student i. Magic Air Pushing the stick down-- Student ii. Air Power Water in funnel--teacher 2. Tipping the Scale Weighing air--student
5 th Grade Science Vocabulary Words
 5 th Grade Science Vocabulary Words abiotic factor A nonliving part of an ecosystem. acceleration Change in velocity with respect to time. action The force one object applies to a second, as in Newton
Shadows, Angles, and the Seasons
 Shadows, Angles, and the Seasons If it's cold in winter, why is Earth closer to the Sun? This activity shows the relationship between Earth-Sun positions and the seasons. From The WSU Fairmount Center
Seasonal Temperature Variations
 Seasonal and Daily Temperatures Fig. 3-CO, p. 54 Seasonal Temperature Variations What causes the seasons What governs the seasons is the amount of solar radiation reaching the ground What two primary factors
Chapter 3: Weather Map. Station Model and Weather Maps Pressure as a Vertical Coordinate Constant Pressure Maps Cross Sections
 Chapter 3: Weather Map Station Model and Weather Maps Pressure as a Vertical Coordinate Constant Pressure Maps Cross Sections Weather Maps Many variables are needed to described dweather conditions. Local
ATM S 111, Global Warming: Understanding the Forecast
 ATM S 111, Global Warming: Understanding the Forecast DARGAN M. W. FRIERSON DEPARTMENT OF ATMOSPHERIC SCIENCES DAY 1: OCTOBER 1, 2015 Outline How exactly the Sun heats the Earth How strong? Important concept
TEACHER BACKGROUND INFORMATION THERMAL ENERGY
 TEACHER BACKGROUND INFORMATION THERMAL ENERGY In general, when an object performs work on another object, it does not transfer all of its energy to that object. Some of the energy is lost as heat due to
Purpose: To determine the dew and point and relative humidity in the classroom, and find the current relative humidity outside.
 Lab Exercise: Dew Point and Relative Humidity Purpose: To determine the dew and point and relative humidity in the classroom, and find the current relative humidity outside. Relative humidity is a measure
1. Which weather station model for a New York State location indicates that snow may be about to fall?
 1. Which weather station model for a New York State location indicates that snow may be about to fall? 4. Weather-station measurements indicate that the dewpoint temperature and air temperature are getting
1. The Kinetic Theory of Matter states that all matter is composed of atoms and molecules that are in a constant state of constant random motion
 Physical Science Period: Name: ANSWER KEY Date: Practice Test for Unit 3: Ch. 3, and some of 15 and 16: Kinetic Theory of Matter, States of matter, and and thermodynamics, and gas laws. 1. The Kinetic
Weather Issue. current water info f or schools A publication of the Southwest Florida Water Management District
 Weather Issue current water info f or schools A publication of the Southwest Florida Water Management District The WaterWeb Query QUESTION: What is the dew point and how can it be used to predict the weather?
The Ideal Gas Law. Gas Constant. Applications of the Gas law. P = ρ R T. Lecture 2: Atmospheric Thermodynamics
 Lecture 2: Atmospheric Thermodynamics Ideal Gas Law (Equation of State) Hydrostatic Balance Heat and Temperature Conduction, Convection, Radiation Latent Heating Adiabatic Process Lapse Rate and Stability
Convection, Conduction & Radiation
 Convection, Conduction & Radiation There are three basic ways in which heat is transferred: convection, conduction and radiation. In gases and liquids, heat is usually transferred by convection, in which
Humidity the story for teachers
 Humidity the story for teachers As we have learned earlier, water may exist as a gas (water vapour). Even in the driest desert there is some water vapour in the air. Water vapour is the most important
Seasonal & Daily Temperatures. Seasons & Sun's Distance. Solstice & Equinox. Seasons & Solar Intensity
 Seasonal & Daily Temperatures Seasons & Sun's Distance The role of Earth's tilt, revolution, & rotation in causing spatial, seasonal, & daily temperature variations Please read Chapter 3 in Ahrens Figure
Mid latitude Cyclonic Storm System. 08 _15 ab. jpg
 Mid latitude Cyclonic Storm System 08 _15 ab. jpg Mid Latitude Cyclone Storm System (MLCSS) It has several names. Cyclone, Cyclonic Storm, Cyclonic System, Depression. Cyclonic Storms are the weather maker
Anticyclones, depressions, hot & drought, cold & snow
 AS/A2-Level Geography Anticyclones, depressions, hot & drought, cold & snow Learning Objectives: To describe and explain the weather associated with high and low pressure systems and their links to extreme
Please be sure to save a copy of this activity to your computer!
 Thank you for your purchase Please be sure to save a copy of this activity to your computer! This activity is copyrighted by AIMS Education Foundation. All rights reserved. No part of this work may be
Clouds, Clouds, Everywhere
 1 Clouds, Clouds, Everywhere Grade Level 1 st Grade_ Standards Connection(s): Earth Science: Weather can be observed, measured, and described. Physical Science: States of Materials. Solids, liquids, gases
Clouds. A simple scientific explanation for the weather-curious. By Kira R. Erickson
 Clouds A simple scientific explanation for the weather-curious By Kira R. Erickson Table of Contents 1 3 4 INTRO 2 Page 3 How Clouds Are Formed Types of Clouds Clouds and Weather More Information Page
The Water Cycle Now You See It, Now You Don t
 The Water Cycle Now You See It, Now You Don t Unit: Salinity Patterns & the Water Cycle l Grade Level: Elementary l Time Required: Introduction - 30 min. - Activity as groups 45min Wrap Up 20 min l Content