Statistical Tests for Multiple Forecast Comparison
|
|
|
- Eustacia Hicks
- 9 years ago
- Views:
Transcription
1 Statistical Tests for Multiple Forecast Comparison Roberto S. Mariano (Singapore Management University & University of Pennsylvania) Daniel Preve (Uppsala University) June 6-7, 2008 T.W. Anderson Conference, Stanford University
 Daniel Preve (Uppsala University) June")
2 Why Test for Predictive Ability?

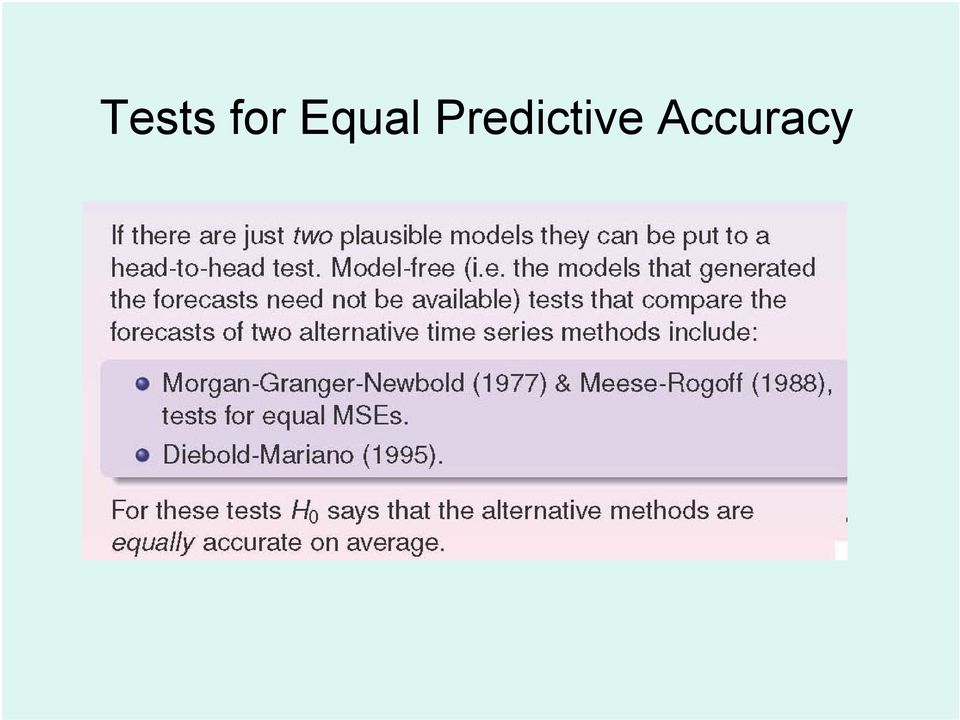
3 Tests for Equal Predictive Accuracy
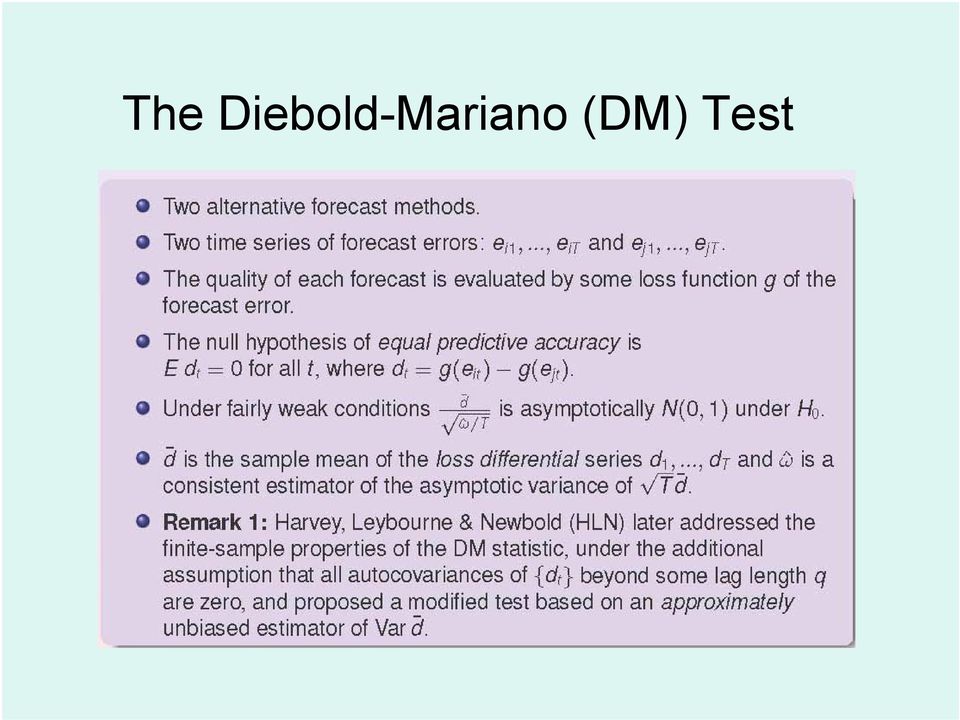
4 The Diebold-Mariano (DM) Test
5 Introductory Remarks Obvious desirability of formal testing procedures But earlier efforts at assessing forecast accuracy revolved around calculation of summary error statistics-mainly due to complexities in dealing with sampling uncertainties and correlations present in forecast errors

6 Introductory Remarks... continue Formal testing approaches started with loss functions that are quadratic in forecast errors; & forecast errors are assumed to be Gaussian and serially uncorrelated More recent efforts much more relaxed conditions Loss functions may be nonquadratic and asymmetric Forecast errors need not be Gaussian Generally based on large-sample asymtotic analysis With limited experimental studies on small-sample properties

7 Significance Tests of Forecast Accuracy Model-based tests Assumes an econometric model, typically parametric Model is estimated from a given data sample Data and model are both available for testing forecast accuracy Applied in large macroeconometric models, using deterministic and stochastic simulations of the estimated model

8 Significance Tests of Forecast Accuracy... continue Model-free tests Limited information set: set of forecasts and actual values of the predictand

9 Preliminaries (1) Available information: t=1,2,3, T Actual values y t Forecast i: ŷ it, i=1,2 Forecast errors: e it = ŷ it -y t Loss depends on forecast and actual values only through the forecast error: g(y t, ŷ it ) = g(ŷ it -y t ) = g(e it ) Loss differential between the two forecasts d(t) = g(e 1t ) g(e 2t )
 Loss differential between the two forecasts d(t) = g(e 1t ) g(e 2t )")
10 Preliminaries (2) Two forecasts have equal accuracy if and only if the loss differential has zero expectation for all t Hence, test H 0 : E(d t ) = 0 for all t versus the alternative hypothesis H 1 : E(d t ) = μ, different from zero
 = μ, different")
11 Morgan-Granger-Newbold (MGN) Test (1977) Assume A(1) Loss is quadratic A(2) Forecast errors are (a) zero mean, (b) Gaussian, ( c ) serially uncorrelated Let x t = e 1t + e 2t z t = e 1t e 2t Here, H 0 is equivalent to equality of the two forecast error variances, or, equivalently, zero correlation between x t and z t

12 Variations of MGN Test Harvey, Leybourne and Newbold (1997) regression set up x t = β z t + ε t The MGN test statistic is exactly the same as that for testing the null hypothesis that β = 0 in this regression.

13 Variations of MGN Test... continue When the forecast errors come from a heavytailed distribution, HLN argue that the estimate of the variance of b is biased and suggest utilizing a White-correction for heteroskedasticity to estimate the variance of b. Another HLN variation: Spearman s rank test for zero correlation between x and z

14 Variations of MGN Test... continue Real drawback of all these tests: limitation of applicability to one-step predictions and to squared error loss

15 Meese-Rogoff (MR) Test (1988) Now, forecast errors can be serially and contemporaneously correlated Still maintain assumptions A1, A2a, and A2b and assume squared error loss The MR test is based on the sample covariance between x t and z t

16 Diebold-Mariano (DM) Test (1995) Applicable to nonquadratic loss functions, multi-period forecasts, and forecast errors that are non-gaussian, nonzero-mean, serially correlated, and contemporaneously correlated. Basis of the test: sample mean of the observed loss differential series {d t : t=1, 2, }

17 DM Test (2) Assuming covariance stationarity and other regularity conditions on the process {d t }, then T 1/2 ( d μ) converges in distribution to N(0, 2 π f d (0)), f d (.) is the spectral density of {d t } d is the sample mean loss differential
 is the spectral density of {d t } d is the sample mean loss")
18 DM Test Statistic DM = d /[2 π fˆ (0)/ T] d 1/2 ˆ (0) where f d is a consistent estimate of f d (0).

19 Small-Sample Modification of DM Test HLN (1997) :use an approximately unbiased estimate of the variance of the mean loss differential Forecast accuracy is measured in terms of mean squared prediction error

20 Small-Sample Modification of DM Test... continue H-step ahead forecast errors are assumed to have zero autocorrelations at order h and beyond Small-sample modification DM* = DM/{[T+1-2h+h(h-1)/T]/T} 1/2 t-distribution with T-1 df..
/T]/T}")
21 Applications Predictability of nominal exchange rates (Mark 1995) Comparing predictive ability of flexiblespecification, fixed-specification, linear and nonlinear econometric models of macroeconomic variables (Swanson & White 1997)
22 Applications Predictive ability with cointegrated variables (Corradi, Swanson & Olivetti 2001) Predictive ability in the presence of structural breaks (Clark & McCracken 2003) Forecast comparison of volatility models versus GARCH (1,1) (Hansen & Lunde 2005)
23 Applications Forecast comparison of volatility models versus GARCH (1,1) (Hansen & Lunde 2005)
24 A Multivariate Test
25 Invariance and Bias
26 Two Modified Tests
27 Monte Carlo Setup
28
29 Multivariate Case Monte Carlo Results The proposed test can be oversized in moderate samples The test benefits noticeably from the finitesample correction, even in moderately large samples However, the finite-sample correction provides only a partial adjustment
30 Multivariate Case Follow-up Work Consider alternative types of weak stationarity Extensions to Panel data (Pesaran) High frequency data Qualitative and limited dependent variable Semiparametric approaches Compare with White / Hansen's data snooping reality test Relation to Ken West s test for predictive ability Semiparametric approaches to multivariate tests of forecasting performance Power considerations
31 The End
Lesson19: Comparing Predictive Accuracy of two Forecasts: Th. Diebold-Mariano Test
 Lesson19: Comparing Predictive Accuracy of two Forecasts: The Diebold-Mariano Test Dipartimento di Ingegneria e Scienze dell Informazione e Matematica Università dell Aquila, [email protected]
Department of Economics
 Department of Economics On Testing for Diagonality of Large Dimensional Covariance Matrices George Kapetanios Working Paper No. 526 October 2004 ISSN 1473-0278 On Testing for Diagonality of Large Dimensional
Comparing Predictive Accuracy
 Diebold, F.X. and Mariano, R. (1995), Comparing Predictive Accuracy, Journal of Business and Economic Statistics, 13, 253-265. Comparing Predictive Accuracy Francis X. Diebold and Roberto S. Mariano Department
Forecasting Chilean Industrial Production and Sales with Automated Procedures 1
 Forecasting Chilean Industrial Production and Sales with Automated Procedures 1 Rómulo A. Chumacero 2 February 2004 1 I thank Ernesto Pastén, Klaus Schmidt-Hebbel, and Rodrigo Valdés for helpful comments
Is the Forward Exchange Rate a Useful Indicator of the Future Exchange Rate?
 Is the Forward Exchange Rate a Useful Indicator of the Future Exchange Rate? Emily Polito, Trinity College In the past two decades, there have been many empirical studies both in support of and opposing
Approximately normal tests for equal predictive accuracy in nested models
 Journal of Econometrics 138 (2007) 291 311 www.elsevier.com/locate/jeconom Approximately normal tests for equal predictive accuracy in nested models Todd E. Clark a,, Kenneth D. West b a Economic Research
How To Understand The Theory Of Probability
 Graduate Programs in Statistics Course Titles STAT 100 CALCULUS AND MATR IX ALGEBRA FOR STATISTICS. Differential and integral calculus; infinite series; matrix algebra STAT 195 INTRODUCTION TO MATHEMATICAL
FULLY MODIFIED OLS FOR HETEROGENEOUS COINTEGRATED PANELS
 FULLY MODIFIED OLS FOR HEEROGENEOUS COINEGRAED PANELS Peter Pedroni ABSRAC his chapter uses fully modified OLS principles to develop new methods for estimating and testing hypotheses for cointegrating
IAPRI Quantitative Analysis Capacity Building Series. Multiple regression analysis & interpreting results
 IAPRI Quantitative Analysis Capacity Building Series Multiple regression analysis & interpreting results How important is R-squared? R-squared Published in Agricultural Economics 0.45 Best article of the
MISSING DATA TECHNIQUES WITH SAS. IDRE Statistical Consulting Group
 MISSING DATA TECHNIQUES WITH SAS IDRE Statistical Consulting Group ROAD MAP FOR TODAY To discuss: 1. Commonly used techniques for handling missing data, focusing on multiple imputation 2. Issues that could
Note 2 to Computer class: Standard mis-specification tests
 Note 2 to Computer class: Standard mis-specification tests Ragnar Nymoen September 2, 2013 1 Why mis-specification testing of econometric models? As econometricians we must relate to the fact that the
Overview of Violations of the Basic Assumptions in the Classical Normal Linear Regression Model
 Overview of Violations of the Basic Assumptions in the Classical Normal Linear Regression Model 1 September 004 A. Introduction and assumptions The classical normal linear regression model can be written
Financial Risk Management Exam Sample Questions/Answers
 Financial Risk Management Exam Sample Questions/Answers Prepared by Daniel HERLEMONT 1 2 3 4 5 6 Chapter 3 Fundamentals of Statistics FRM-99, Question 4 Random walk assumes that returns from one time period
Financial Risk Management Exam Sample Questions
 Financial Risk Management Exam Sample Questions Prepared by Daniel HERLEMONT 1 PART I - QUANTITATIVE ANALYSIS 3 Chapter 1 - Bunds Fundamentals 3 Chapter 2 - Fundamentals of Probability 7 Chapter 3 Fundamentals
1 Teaching notes on GMM 1.
 Bent E. Sørensen January 23, 2007 1 Teaching notes on GMM 1. Generalized Method of Moment (GMM) estimation is one of two developments in econometrics in the 80ies that revolutionized empirical work in
Sales forecasting # 2
 Sales forecasting # 2 Arthur Charpentier [email protected] 1 Agenda Qualitative and quantitative methods, a very general introduction Series decomposition Short versus long term forecasting
Additional sources Compilation of sources: http://lrs.ed.uiuc.edu/tseportal/datacollectionmethodologies/jin-tselink/tselink.htm
 Mgt 540 Research Methods Data Analysis 1 Additional sources Compilation of sources: http://lrs.ed.uiuc.edu/tseportal/datacollectionmethodologies/jin-tselink/tselink.htm http://web.utk.edu/~dap/random/order/start.htm
Multivariate normal distribution and testing for means (see MKB Ch 3)
") Multivariate normal distribution and testing for means (see MKB Ch 3) Where are we going? 2 One-sample t-test (univariate).................................................. 3 Two-sample t-test (univariate).................................................
Multivariate normal distribution and testing for means (see MKB Ch 3) Where are we going? 2 One-sample t-test (univariate).................................................. 3 Two-sample t-test (univariate).................................................
Practical. I conometrics. data collection, analysis, and application. Christiana E. Hilmer. Michael J. Hilmer San Diego State University
 Practical I conometrics data collection, analysis, and application Christiana E. Hilmer Michael J. Hilmer San Diego State University Mi Table of Contents PART ONE THE BASICS 1 Chapter 1 An Introduction
EE 570: Location and Navigation
 EE 570: Location and Navigation On-Line Bayesian Tracking Aly El-Osery 1 Stephen Bruder 2 1 Electrical Engineering Department, New Mexico Tech Socorro, New Mexico, USA 2 Electrical and Computer Engineering
Introduction to Regression and Data Analysis
 Statlab Workshop Introduction to Regression and Data Analysis with Dan Campbell and Sherlock Campbell October 28, 2008 I. The basics A. Types of variables Your variables may take several forms, and it
Introduction to General and Generalized Linear Models
 Introduction to General and Generalized Linear Models General Linear Models - part I Henrik Madsen Poul Thyregod Informatics and Mathematical Modelling Technical University of Denmark DK-2800 Kgs. Lyngby
Masters in Financial Economics (MFE)
") Masters in Financial Economics (MFE) Admission Requirements Candidates must submit the following to the Office of Admissions and Registration: 1. Official Transcripts of previous academic record 2. Two
Masters in Financial Economics (MFE) Admission Requirements Candidates must submit the following to the Office of Admissions and Registration: 1. Official Transcripts of previous academic record 2. Two
Simple Linear Regression Inference
 Simple Linear Regression Inference 1 Inference requirements The Normality assumption of the stochastic term e is needed for inference even if it is not a OLS requirement. Therefore we have: Interpretation
Auxiliary Variables in Mixture Modeling: 3-Step Approaches Using Mplus
 Auxiliary Variables in Mixture Modeling: 3-Step Approaches Using Mplus Tihomir Asparouhov and Bengt Muthén Mplus Web Notes: No. 15 Version 8, August 5, 2014 1 Abstract This paper discusses alternatives
The VAR models discussed so fare are appropriate for modeling I(0) data, like asset returns or growth rates of macroeconomic time series.
 data, like asset returns or growth rates of macroeconomic time series.") Cointegration The VAR models discussed so fare are appropriate for modeling I(0) data, like asset returns or growth rates of macroeconomic time series. Economic theory, however, often implies equilibrium
Cointegration The VAR models discussed so fare are appropriate for modeling I(0) data, like asset returns or growth rates of macroeconomic time series. Economic theory, however, often implies equilibrium
Service courses for graduate students in degree programs other than the MS or PhD programs in Biostatistics.
 Course Catalog In order to be assured that all prerequisites are met, students must acquire a permission number from the education coordinator prior to enrolling in any Biostatistics course. Courses are
MULTIPLE REGRESSION AND ISSUES IN REGRESSION ANALYSIS
 MULTIPLE REGRESSION AND ISSUES IN REGRESSION ANALYSIS MSR = Mean Regression Sum of Squares MSE = Mean Squared Error RSS = Regression Sum of Squares SSE = Sum of Squared Errors/Residuals α = Level of Significance
The Power of the KPSS Test for Cointegration when Residuals are Fractionally Integrated
 The Power of the KPSS Test for Cointegration when Residuals are Fractionally Integrated Philipp Sibbertsen 1 Walter Krämer 2 Diskussionspapier 318 ISNN 0949-9962 Abstract: We show that the power of the
Cost implications of no-fault automobile insurance. By: Joseph E. Johnson, George B. Flanigan, and Daniel T. Winkler
 Cost implications of no-fault automobile insurance By: Joseph E. Johnson, George B. Flanigan, and Daniel T. Winkler Johnson, J. E., G. B. Flanigan, and D. T. Winkler. "Cost Implications of No-Fault Automobile
Optimization of technical trading strategies and the profitability in security markets
 Economics Letters 59 (1998) 249 254 Optimization of technical trading strategies and the profitability in security markets Ramazan Gençay 1, * University of Windsor, Department of Economics, 401 Sunset,
Wooldridge, Introductory Econometrics, 3d ed. Chapter 12: Serial correlation and heteroskedasticity in time series regressions
 Wooldridge, Introductory Econometrics, 3d ed. Chapter 12: Serial correlation and heteroskedasticity in time series regressions What will happen if we violate the assumption that the errors are not serially
Total Credits: 32 credits are required for master s program graduates and 53 credits for undergraduate program.
 Middle East Technical University Graduate School of Social Sciences Doctor of Philosophy in Business Administration In the Field of Quantitative Methods Aim of the PhD Program: Quantitative Methods is
What s New in Econometrics? Lecture 8 Cluster and Stratified Sampling
 What s New in Econometrics? Lecture 8 Cluster and Stratified Sampling Jeff Wooldridge NBER Summer Institute, 2007 1. The Linear Model with Cluster Effects 2. Estimation with a Small Number of Groups and
Testing for Granger causality between stock prices and economic growth
 MPRA Munich Personal RePEc Archive Testing for Granger causality between stock prices and economic growth Pasquale Foresti 2006 Online at http://mpra.ub.uni-muenchen.de/2962/ MPRA Paper No. 2962, posted
Least Squares Estimation
 Least Squares Estimation SARA A VAN DE GEER Volume 2, pp 1041 1045 in Encyclopedia of Statistics in Behavioral Science ISBN-13: 978-0-470-86080-9 ISBN-10: 0-470-86080-4 Editors Brian S Everitt & David
A Subset-Continuous-Updating Transformation on GMM Estimators for Dynamic Panel Data Models
 Article A Subset-Continuous-Updating Transformation on GMM Estimators for Dynamic Panel Data Models Richard A. Ashley 1, and Xiaojin Sun 2,, 1 Department of Economics, Virginia Tech, Blacksburg, VA 24060;
WORKING PAPER NO. 11-31 OUT-OF-SAMPLE FORECAST TESTS ROBUST TO THE CHOICE OF WINDOW SIZE
 WORKING PAPER NO. 11-31 OUT-OF-SAMPLE FORECAST TESTS ROBUST TO THE CHOICE OF WINDOW SIZE Barbara Rossi Duke University and Visiting Scholar, Federal Reserve Bank of Philadelphia Atsushi Inoue North Carolina
Power and sample size in multilevel modeling
 Snijders, Tom A.B. Power and Sample Size in Multilevel Linear Models. In: B.S. Everitt and D.C. Howell (eds.), Encyclopedia of Statistics in Behavioral Science. Volume 3, 1570 1573. Chicester (etc.): Wiley,
Master programme in Statistics
 Master programme in Statistics Björn Holmquist 1 1 Department of Statistics Lund University Cramérsällskapets årskonferens, 2010-03-25 Master programme Vad är ett Master programme? Breddmaster vs Djupmaster
Univariate and Multivariate Methods PEARSON. Addison Wesley
 Time Series Analysis Univariate and Multivariate Methods SECOND EDITION William W. S. Wei Department of Statistics The Fox School of Business and Management Temple University PEARSON Addison Wesley Boston
Integrated Resource Plan
 Integrated Resource Plan March 19, 2004 PREPARED FOR KAUA I ISLAND UTILITY COOPERATIVE LCG Consulting 4962 El Camino Real, Suite 112 Los Altos, CA 94022 650-962-9670 1 IRP 1 ELECTRIC LOAD FORECASTING 1.1
16 : Demand Forecasting
 16 : Demand Forecasting 1 Session Outline Demand Forecasting Subjective methods can be used only when past data is not available. When past data is available, it is advisable that firms should use statistical
Non-Stationary Time Series andunitroottests
 Econometrics 2 Fall 2005 Non-Stationary Time Series andunitroottests Heino Bohn Nielsen 1of25 Introduction Many economic time series are trending. Important to distinguish between two important cases:
171:290 Model Selection Lecture II: The Akaike Information Criterion
 171:290 Model Selection Lecture II: The Akaike Information Criterion Department of Biostatistics Department of Statistics and Actuarial Science August 28, 2012 Introduction AIC, the Akaike Information
Out-of-Sample Forecast Tests Robust to the Choice of Window Size
 Out-of-Sample Forecast Tests Robust to the Choice of Window Size Barbara Rossi and Atsushi Inoue (ICREA,UPF,CREI,BGSE,Duke) (NC State) April 1, 2012 Abstract This paper proposes new methodologies for evaluating
SYSTEMS OF REGRESSION EQUATIONS
 SYSTEMS OF REGRESSION EQUATIONS 1. MULTIPLE EQUATIONS y nt = x nt n + u nt, n = 1,...,N, t = 1,...,T, x nt is 1 k, and n is k 1. This is a version of the standard regression model where the observations
ADVANCED FORECASTING MODELS USING SAS SOFTWARE
 ADVANCED FORECASTING MODELS USING SAS SOFTWARE Girish Kumar Jha IARI, Pusa, New Delhi 110 012 [email protected] 1. Transfer Function Model Univariate ARIMA models are useful for analysis and forecasting
Examining the Relationship between ETFS and Their Underlying Assets in Indian Capital Market
 2012 2nd International Conference on Computer and Software Modeling (ICCSM 2012) IPCSIT vol. 54 (2012) (2012) IACSIT Press, Singapore DOI: 10.7763/IPCSIT.2012.V54.20 Examining the Relationship between
Analysis of Financial Time Series
 Analysis of Financial Time Series Analysis of Financial Time Series Financial Econometrics RUEY S. TSAY University of Chicago A Wiley-Interscience Publication JOHN WILEY & SONS, INC. This book is printed
2. Linear regression with multiple regressors
 2. Linear regression with multiple regressors Aim of this section: Introduction of the multiple regression model OLS estimation in multiple regression Measures-of-fit in multiple regression Assumptions
Fixed Effects Bias in Panel Data Estimators
 DISCUSSION PAPER SERIES IZA DP No. 3487 Fixed Effects Bias in Panel Data Estimators Hielke Buddelmeyer Paul H. Jensen Umut Oguzoglu Elizabeth Webster May 2008 Forschungsinstitut zur Zukunft der Arbeit
FORECASTING DEPOSIT GROWTH: Forecasting BIF and SAIF Assessable and Insured Deposits
 Technical Paper Series Congressional Budget Office Washington, DC FORECASTING DEPOSIT GROWTH: Forecasting BIF and SAIF Assessable and Insured Deposits Albert D. Metz Microeconomic and Financial Studies
Vector Time Series Model Representations and Analysis with XploRe
 0-1 Vector Time Series Model Representations and Analysis with plore Julius Mungo CASE - Center for Applied Statistics and Economics Humboldt-Universität zu Berlin [email protected] plore MulTi Motivation
SIMULATION STUDIES IN STATISTICS WHAT IS A SIMULATION STUDY, AND WHY DO ONE? What is a (Monte Carlo) simulation study, and why do one?
 simulation study, and why do one?") SIMULATION STUDIES IN STATISTICS WHAT IS A SIMULATION STUDY, AND WHY DO ONE? What is a (Monte Carlo) simulation study, and why do one? Simulations for properties of estimators Simulations for properties
SIMULATION STUDIES IN STATISTICS WHAT IS A SIMULATION STUDY, AND WHY DO ONE? What is a (Monte Carlo) simulation study, and why do one? Simulations for properties of estimators Simulations for properties
From the help desk: Bootstrapped standard errors
 The Stata Journal (2003) 3, Number 1, pp. 71 80 From the help desk: Bootstrapped standard errors Weihua Guan Stata Corporation Abstract. Bootstrapping is a nonparametric approach for evaluating the distribution
Econometrics Simple Linear Regression
 Econometrics Simple Linear Regression Burcu Eke UC3M Linear equations with one variable Recall what a linear equation is: y = b 0 + b 1 x is a linear equation with one variable, or equivalently, a straight
A Fuel Cost Comparison of Electric and Gas-Powered Vehicles
 $ / gl $ / kwh A Fuel Cost Comparison of Electric and Gas-Powered Vehicles Lawrence V. Fulton, McCoy College of Business Administration, Texas State University, [email protected] Nathaniel D. Bastian, University
Implied volatility transmissions between Thai and selected advanced stock markets
 MPRA Munich Personal RePEc Archive Implied volatility transmissions between Thai and selected advanced stock markets Supachok Thakolsri and Yuthana Sethapramote and Komain Jiranyakul Public Enterprise
Statistics Graduate Courses
 Statistics Graduate Courses STAT 7002--Topics in Statistics-Biological/Physical/Mathematics (cr.arr.).organized study of selected topics. Subjects and earnable credit may vary from semester to semester.
Examples. David Ruppert. April 25, 2009. Cornell University. Statistics for Financial Engineering: Some R. Examples. David Ruppert.
 Cornell University April 25, 2009 Outline 1 2 3 4 A little about myself BA and MA in mathematics PhD in statistics in 1977 taught in the statistics department at North Carolina for 10 years have been in
Advanced Forecasting Techniques and Models: ARIMA
 Advanced Forecasting Techniques and Models: ARIMA Short Examples Series using Risk Simulator For more information please visit: www.realoptionsvaluation.com or contact us at: [email protected]
11. Time series and dynamic linear models
 11. Time series and dynamic linear models Objective To introduce the Bayesian approach to the modeling and forecasting of time series. Recommended reading West, M. and Harrison, J. (1997). models, (2 nd
Permutation Tests for Comparing Two Populations
 Permutation Tests for Comparing Two Populations Ferry Butar Butar, Ph.D. Jae-Wan Park Abstract Permutation tests for comparing two populations could be widely used in practice because of flexibility of
Chapter 3: The Multiple Linear Regression Model
 Chapter 3: The Multiple Linear Regression Model Advanced Econometrics - HEC Lausanne Christophe Hurlin University of Orléans November 23, 2013 Christophe Hurlin (University of Orléans) Advanced Econometrics
Module 5: Multiple Regression Analysis
 Using Statistical Data Using to Make Statistical Decisions: Data Multiple to Make Regression Decisions Analysis Page 1 Module 5: Multiple Regression Analysis Tom Ilvento, University of Delaware, College
The comovement of US and German bond markets
 The comovement of US and German bond markets Tom Engsted and Carsten Tanggaard The Aarhus School of Business, Fuglesangs alle 4, DK-8210 Aarhus V. E-mails: [email protected] (Engsted); [email protected] (Tanggaard).
Econometric Forecasting Models
 Econometric Forecasting Models presented at THE MIDDLE ATLANTIC ACTUARIAL CLUB, INC. 2006 Annual Meeting, September 12, 2006 Four Points by Sheraton BWI Airport Frederick L. Joutz, Professor Research Program
Solución del Examen Tipo: 1
 Solución del Examen Tipo: 1 Universidad Carlos III de Madrid ECONOMETRICS Academic year 2009/10 FINAL EXAM May 17, 2010 DURATION: 2 HOURS 1. Assume that model (III) verifies the assumptions of the classical
Chapter 1 Introduction. 1.1 Introduction
 Chapter 1 Introduction 1.1 Introduction 1 1.2 What Is a Monte Carlo Study? 2 1.2.1 Simulating the Rolling of Two Dice 2 1.3 Why Is Monte Carlo Simulation Often Necessary? 4 1.4 What Are Some Typical Situations
Regression III: Advanced Methods
 Lecture 16: Generalized Additive Models Regression III: Advanced Methods Bill Jacoby Michigan State University http://polisci.msu.edu/jacoby/icpsr/regress3 Goals of the Lecture Introduce Additive Models
Dynamic Relationship between Interest Rate and Stock Price: Empirical Evidence from Colombo Stock Exchange
 International Journal of Business and Social Science Vol. 6, No. 4; April 2015 Dynamic Relationship between Interest Rate and Stock Price: Empirical Evidence from Colombo Stock Exchange AAMD Amarasinghe
Please follow the directions once you locate the Stata software in your computer. Room 114 (Business Lab) has computers with Stata software
 has computers with Stata software") STATA Tutorial Professor Erdinç Please follow the directions once you locate the Stata software in your computer. Room 114 (Business Lab) has computers with Stata software 1.Wald Test Wald Test is used
STATA Tutorial Professor Erdinç Please follow the directions once you locate the Stata software in your computer. Room 114 (Business Lab) has computers with Stata software 1.Wald Test Wald Test is used
Web-based Supplementary Materials for Bayesian Effect Estimation. Accounting for Adjustment Uncertainty by Chi Wang, Giovanni
 1 Web-based Supplementary Materials for Bayesian Effect Estimation Accounting for Adjustment Uncertainty by Chi Wang, Giovanni Parmigiani, and Francesca Dominici In Web Appendix A, we provide detailed
Non Linear Dependence Structures: a Copula Opinion Approach in Portfolio Optimization
 Non Linear Dependence Structures: a Copula Opinion Approach in Portfolio Optimization Jean- Damien Villiers ESSEC Business School Master of Sciences in Management Grande Ecole September 2013 1 Non Linear
Maximum likelihood estimation of mean reverting processes
 Maximum likelihood estimation of mean reverting processes José Carlos García Franco Onward, Inc. [email protected] Abstract Mean reverting processes are frequently used models in real options. For
A Trading Strategy Based on the Lead-Lag Relationship of Spot and Futures Prices of the S&P 500
 A Trading Strategy Based on the Lead-Lag Relationship of Spot and Futures Prices of the S&P 500 FE8827 Quantitative Trading Strategies 2010/11 Mini-Term 5 Nanyang Technological University Submitted By:
Nonparametric Tests for Randomness
 ECE 461 PROJECT REPORT, MAY 2003 1 Nonparametric Tests for Randomness Ying Wang ECE 461 PROJECT REPORT, MAY 2003 2 Abstract To decide whether a given sequence is truely random, or independent and identically
Chapter 10 Introduction to Time Series Analysis
 Chapter 1 Introduction to Time Series Analysis A time series is a collection of observations made sequentially in time. Examples are daily mortality counts, particulate air pollution measurements, and
Chapter 3 RANDOM VARIATE GENERATION
 Chapter 3 RANDOM VARIATE GENERATION In order to do a Monte Carlo simulation either by hand or by computer, techniques must be developed for generating values of random variables having known distributions.
STA 4273H: Statistical Machine Learning
 STA 4273H: Statistical Machine Learning Russ Salakhutdinov Department of Statistics! [email protected]! http://www.cs.toronto.edu/~rsalakhu/ Lecture 6 Three Approaches to Classification Construct
1.5 Oneway Analysis of Variance
 Statistics: Rosie Cornish. 200. 1.5 Oneway Analysis of Variance 1 Introduction Oneway analysis of variance (ANOVA) is used to compare several means. This method is often used in scientific or medical experiments
TEMPORAL CAUSAL RELATIONSHIP BETWEEN STOCK MARKET CAPITALIZATION, TRADE OPENNESS AND REAL GDP: EVIDENCE FROM THAILAND
 I J A B E R, Vol. 13, No. 4, (2015): 1525-1534 TEMPORAL CAUSAL RELATIONSHIP BETWEEN STOCK MARKET CAPITALIZATION, TRADE OPENNESS AND REAL GDP: EVIDENCE FROM THAILAND Komain Jiranyakul * Abstract: This study
Multiple Regression: What Is It?
 Multiple Regression Multiple Regression: What Is It? Multiple regression is a collection of techniques in which there are multiple predictors of varying kinds and a single outcome We are interested in
Introduction to Fixed Effects Methods
 Introduction to Fixed Effects Methods 1 1.1 The Promise of Fixed Effects for Nonexperimental Research... 1 1.2 The Paired-Comparisons t-test as a Fixed Effects Method... 2 1.3 Costs and Benefits of Fixed
Statistical Machine Learning
 Statistical Machine Learning UoC Stats 37700, Winter quarter Lecture 4: classical linear and quadratic discriminants. 1 / 25 Linear separation For two classes in R d : simple idea: separate the classes
ECON 142 SKETCH OF SOLUTIONS FOR APPLIED EXERCISE #2
 University of California, Berkeley Prof. Ken Chay Department of Economics Fall Semester, 005 ECON 14 SKETCH OF SOLUTIONS FOR APPLIED EXERCISE # Question 1: a. Below are the scatter plots of hourly wages
Part 2: Analysis of Relationship Between Two Variables
 Part 2: Analysis of Relationship Between Two Variables Linear Regression Linear correlation Significance Tests Multiple regression Linear Regression Y = a X + b Dependent Variable Independent Variable