Advanced Forecasting Techniques and Models: ARIMA
|
|
|
- Piers Brown
- 9 years ago
- Views:
Transcription
1 Advanced Forecasting Techniques and Models: ARIMA Short Examples Series using Risk Simulator For more information please visit: or contact us at:

2 Forecasting Time-Series ARIMA File Name: Forecasting Time-Series ARIMA Location: Modeling Toolkit Forecasting ARIMA Brief Description: This sample model illustrates how to run an econometric model called the Box- Jenkins ARIMA, which stands for autoregressive integrated moving average, an advanced forecasting technique that takes into account historical fluctuations, trends, seasonality, cycles, prediction errors, and nonstationarity of the data Requirements: Modeling Toolkit, Risk Simulator The Data worksheet in the model contains some historical time-series data on money supply in the United States, denoted M1, M2, and M3. M1 is the most liquid form of money (cash, coins, savings accounts, and so forth); M2 and M3 are less liquid forms of money (bearer bonds, certificates of deposit, and so forth). These data sets are useful examples of long-term historical time-series data where ARIMA can be applied. Briefly, ARIMA econometric modeling takes into account historical data and decomposes it into an Autoregressive (AR) process, where there is a memory of past events (e.g., the interest rate this month is related to the interest rate last month, and so forth, with a decreasing memory lag); an Integrated (I) process, which accounts for stabilizing or making the data stationary and ergodic, making it easier to forecast; and a Moving Average (MA) of the forecast errors, such that the longer the historical data, the more accurate the forecasts will be, as it learns over time. ARIMA models therefore have three model parameters, one for the AR(p) process, one for the I(d) process, and one for the MA(q) process, all combined and interacting among each other and recomposed into the ARIMA (p,d,q) model. There are many reasons why an ARIMA model is superior to common time-series analysis and multivariate regressions. The common finding in time series analysis and multivariate regression is that the error residuals are correlated with their own lagged values. This serial correlation violates the standard assumption of regression theory that disturbances are not correlated with other disturbances. The primary problems associated with serial correlation are: Regression analysis and basic time-series analysis are no longer efficient among the different linear estimators. However, as the error residuals can help to predict current error residuals, we can take advantage of this information to form a better prediction of the dependent variable using ARIMA.

3 Standard errors computed using the regression and time-series formula are not correct and are generally understated. If there are lagged dependent variables set as the regressors, regression estimates are biased and inconsistent but can be fixed using ARIMA. Autoregressive Integrated Moving Average or ARIMA(p,d,q) models are the extension of the AR model that uses three components for modeling the serial correlation in the time series data. The first component is the autoregressive (AR) term. The AR(p) model uses the p lags of the time series in the equation. An AR(p) model has the form: y t = a 1 y t a p y t-p + e t. The second component is the integration (d) order term. Each integration order corresponds to differencing the time series. I(1) means differencing the data once. I (d) means differencing the data d times. The third component is the moving average (MA) term. The MA(q) model uses the q lags of the forecast errors to improve the forecast. An MA(q) model has the form: y t = e t + b 1 e t b q e t-q. Finally, an ARMA(p,q) model has the combined form: y t = a 1 y t a p y t-p + e t + b 1 e t b q e t-q. In interpreting the results of an ARIMA model, most of the specifications are identical to the multivariate regression analysis. However, there are several additional sets of results specific to the ARIMA analysis. The first is the addition of Akaike Information Criterion (AIC) and Schwarz Criterion (SC), which are often used in ARIMA model selection and identification. That is, AIC and SC are used to determine if a particular model with a specific set of p, d, and q parameters is a good statistical fit. SC imposes a greater penalty for additional coefficients than the AIC but generally, the model with the lowest AIC and SC values should be chosen. Finally, an additional set of results called the autocorrelation (AC) and partial autocorrelation (PAC) statistics are provided in the ARIMA report. For instance, if autocorrelation AC(1) is nonzero, it means that the series is first order serially correlated. If AC dies off more or less geometrically with increasing lags, it implies that the series follows a loworder autoregressive process. If AC drops to zero after a small number of lags, it implies that the series follows a low-order moving-average process. In contrast, PAC measures the correlation of values that are k periods apart after removing the correlation from the intervening lags. If the pattern of autocorrelation can be captured by an autoregression of order less than k, then the partial autocorrelation at lag k will be close to zero. The Ljung-Box Q-statistics and their p-values at lag k are also provided, where the null hypothesis being tested is such that there is no autocorrelation up to order k. The dotted lines in the plots of the autocorrelations are the approximate two standard error bounds. If the autocorrelation is within these bounds, it is not significantly different from zero at approximately the 5% significance level.
 term. The AR(p) model uses the p lags of the time series in the equation. An AR(p) model has the form: y t = a 1 y t-1 +... + a p y t-p + e t.")
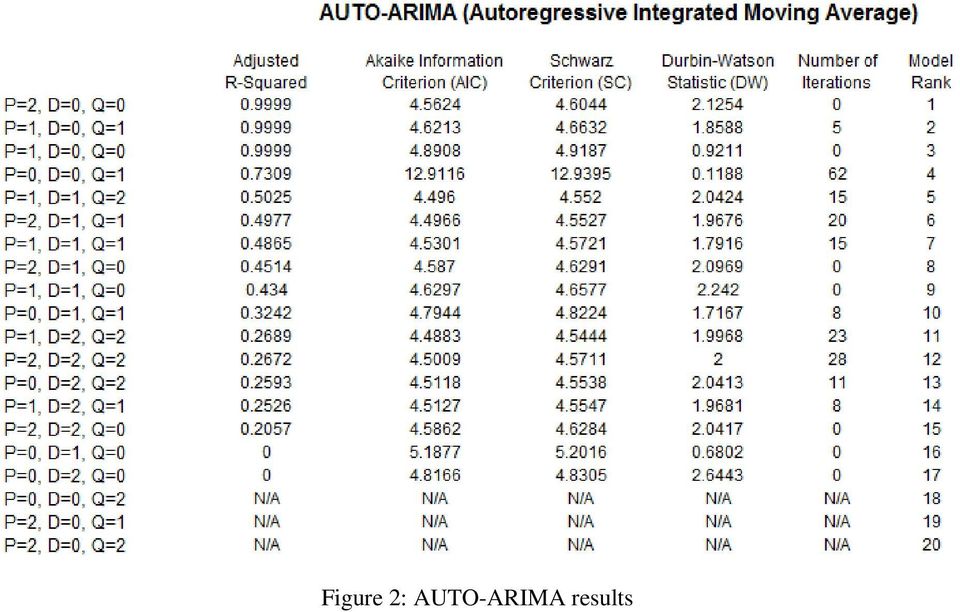
4 Finding the right ARIMA model takes practice and experience. These AC, PAC, SC, and AIC are highly useful diagnostic tools to help identify the correct model specification. Finally, the ARIMA parameter results are obtained using sophisticated optimization and iterative algorithms, which means that although the functional forms look like those of a multivariate regression, they are not the same. ARIMA is a much more computationally intensive and advanced econometric approach. Running an ARIMA Forecast To run this model, simply: 1. Go to the Data worksheet and select Risk Simulator Forecasting ARIMA. 2. Click on the LINK icon beside the Time Series Variable input box, and link in C7:C Enter in the relevant P, D, Q inputs, forecast periods, maximum iterations, and so forth (Figure 1) and click OK. Figure 1: Running a Box-Jenkins ARIMA model The nice thing about using Risk Simulator is the ability to run its AUTO-ARIMA module. That is, instead of needing advanced econometric knowledge, the AUTO-ARIMA module can automatically test all most commonly used models and rank them from the best fit to the worst fit. Figure 2 illustrates the results generated from an AUTO-ARIMA module in Risk Simulator and Figure 3 shows the best-fitting ARIMA model report.

5 Figure 2: AUTO-ARIMA results
6

7

8 Figure 3: Best-Fitting AUTO-ARIMA results

TIME SERIES ANALYSIS
 TIME SERIES ANALYSIS L.M. BHAR AND V.K.SHARMA Indian Agricultural Statistics Research Institute Library Avenue, New Delhi-0 02 [email protected]. Introduction Time series (TS) data refers to observations
Time Series - ARIMA Models. Instructor: G. William Schwert
 APS 425 Fall 25 Time Series : ARIMA Models Instructor: G. William Schwert 585-275-247 [email protected] Topics Typical time series plot Pattern recognition in auto and partial autocorrelations
Forecasting of Paddy Production in Sri Lanka: A Time Series Analysis using ARIMA Model
 Tropical Agricultural Research Vol. 24 (): 2-3 (22) Forecasting of Paddy Production in Sri Lanka: A Time Series Analysis using ARIMA Model V. Sivapathasundaram * and C. Bogahawatte Postgraduate Institute
Software Review: ITSM 2000 Professional Version 6.0.
 Lee, J. & Strazicich, M.C. (2002). Software Review: ITSM 2000 Professional Version 6.0. International Journal of Forecasting, 18(3): 455-459 (June 2002). Published by Elsevier (ISSN: 0169-2070). http://0-
9th Russian Summer School in Information Retrieval Big Data Analytics with R
 9th Russian Summer School in Information Retrieval Big Data Analytics with R Introduction to Time Series with R A. Karakitsiou A. Migdalas Industrial Logistics, ETS Institute Luleå University of Technology
Forecasting Using Eviews 2.0: An Overview
 Forecasting Using Eviews 2.0: An Overview Some Preliminaries In what follows it will be useful to distinguish between ex post and ex ante forecasting. In terms of time series modeling, both predict values
TIME SERIES ANALYSIS
 TIME SERIES ANALYSIS Ramasubramanian V. I.A.S.R.I., Library Avenue, New Delhi- 110 012 [email protected] 1. Introduction A Time Series (TS) is a sequence of observations ordered in time. Mostly these
How To Model A Series With Sas
 Chapter 7 Chapter Table of Contents OVERVIEW...193 GETTING STARTED...194 TheThreeStagesofARIMAModeling...194 IdentificationStage...194 Estimation and Diagnostic Checking Stage...... 200 Forecasting Stage...205
Forecasting the US Dollar / Euro Exchange rate Using ARMA Models
 Forecasting the US Dollar / Euro Exchange rate Using ARMA Models LIUWEI (9906360) - 1 - ABSTRACT...3 1. INTRODUCTION...4 2. DATA ANALYSIS...5 2.1 Stationary estimation...5 2.2 Dickey-Fuller Test...6 3.
Time Series Analysis: Basic Forecasting.
 Time Series Analysis: Basic Forecasting. As published in Benchmarks RSS Matters, April 2015 http://web3.unt.edu/benchmarks/issues/2015/04/rss-matters Jon Starkweather, PhD 1 Jon Starkweather, PhD [email protected]
Time Series Analysis
 Time Series Analysis Identifying possible ARIMA models Andrés M. Alonso Carolina García-Martos Universidad Carlos III de Madrid Universidad Politécnica de Madrid June July, 2012 Alonso and García-Martos
Integrated Resource Plan
 Integrated Resource Plan March 19, 2004 PREPARED FOR KAUA I ISLAND UTILITY COOPERATIVE LCG Consulting 4962 El Camino Real, Suite 112 Los Altos, CA 94022 650-962-9670 1 IRP 1 ELECTRIC LOAD FORECASTING 1.1
(More Practice With Trend Forecasts)
") Stats for Strategy HOMEWORK 11 (Topic 11 Part 2) (revised Jan. 2016) DIRECTIONS/SUGGESTIONS You may conveniently write answers to Problems A and B within these directions. Some exercises include special
Stats for Strategy HOMEWORK 11 (Topic 11 Part 2) (revised Jan. 2016) DIRECTIONS/SUGGESTIONS You may conveniently write answers to Problems A and B within these directions. Some exercises include special
Analysis of algorithms of time series analysis for forecasting sales
 SAINT-PETERSBURG STATE UNIVERSITY Mathematics & Mechanics Faculty Chair of Analytical Information Systems Garipov Emil Analysis of algorithms of time series analysis for forecasting sales Course Work Scientific
Analysis and Computation for Finance Time Series - An Introduction
 ECMM703 Analysis and Computation for Finance Time Series - An Introduction Alejandra González Harrison 161 Email: [email protected] Time Series - An Introduction A time series is a sequence of observations
Time Series Analysis
 Time Series Analysis [email protected] Informatics and Mathematical Modelling Technical University of Denmark DK-2800 Kgs. Lyngby 1 Outline of the lecture Identification of univariate time series models, cont.:
ITSM-R Reference Manual
 ITSM-R Reference Manual George Weigt June 5, 2015 1 Contents 1 Introduction 3 1.1 Time series analysis in a nutshell............................... 3 1.2 White Noise Variance.....................................
Modeling and forecasting regional GDP in Sweden. using autoregressive models
 MASTER THESIS IN MICRODATA ANALYSIS Modeling and forecasting regional GDP in Sweden using autoregressive models Author: Haonan Zhang Supervisor: Niklas Rudholm 2013 Business Intelligence Program School
JOHANNES TSHEPISO TSOKU NONOFO PHOKONTSI DANIEL METSILENG FORECASTING SOUTH AFRICAN GOLD SALES: THE BOX-JENKINS METHODOLOGY
 DOI: 0.20472/IAC.205.08.3 JOHANNES TSHEPISO TSOKU North West University, South Africa NONOFO PHOKONTSI North West University, South Africa DANIEL METSILENG Department of Health, South Africa FORECASTING
16 : Demand Forecasting
 16 : Demand Forecasting 1 Session Outline Demand Forecasting Subjective methods can be used only when past data is not available. When past data is available, it is advisable that firms should use statistical
Time Series Analysis and Forecasting
 Time Series Analysis and Forecasting Math 667 Al Nosedal Department of Mathematics Indiana University of Pennsylvania Time Series Analysis and Forecasting p. 1/11 Introduction Many decision-making applications
The SAS Time Series Forecasting System
 The SAS Time Series Forecasting System An Overview for Public Health Researchers Charles DiMaggio, PhD College of Physicians and Surgeons Departments of Anesthesiology and Epidemiology Columbia University
Graphical Tools for Exploring and Analyzing Data From ARIMA Time Series Models
 Graphical Tools for Exploring and Analyzing Data From ARIMA Time Series Models William Q. Meeker Department of Statistics Iowa State University Ames, IA 50011 January 13, 2001 Abstract S-plus is a highly
Studying Achievement
 Journal of Business and Economics, ISSN 2155-7950, USA November 2014, Volume 5, No. 11, pp. 2052-2056 DOI: 10.15341/jbe(2155-7950)/11.05.2014/009 Academic Star Publishing Company, 2014 http://www.academicstar.us
THE IMPACT OF EXCHANGE RATE VOLATILITY ON BRAZILIAN MANUFACTURED EXPORTS
 THE IMPACT OF EXCHANGE RATE VOLATILITY ON BRAZILIAN MANUFACTURED EXPORTS ANTONIO AGUIRRE UFMG / Department of Economics CEPE (Centre for Research in International Economics) Rua Curitiba, 832 Belo Horizonte
Sales forecasting # 2
 Sales forecasting # 2 Arthur Charpentier [email protected] 1 Agenda Qualitative and quantitative methods, a very general introduction Series decomposition Short versus long term forecasting
TIME-SERIES ANALYSIS, MODELLING AND FORECASTING USING SAS SOFTWARE
 TIME-SERIES ANALYSIS, MODELLING AND FORECASTING USING SAS SOFTWARE Ramasubramanian V. IA.S.R.I., Library Avenue, Pusa, New Delhi 110 012 [email protected] 1. Introduction Time series (TS) data refers
THE UNIVERSITY OF CHICAGO, Booth School of Business Business 41202, Spring Quarter 2014, Mr. Ruey S. Tsay. Solutions to Homework Assignment #2
 THE UNIVERSITY OF CHICAGO, Booth School of Business Business 41202, Spring Quarter 2014, Mr. Ruey S. Tsay Solutions to Homework Assignment #2 Assignment: 1. Consumer Sentiment of the University of Michigan.
COMP6053 lecture: Time series analysis, autocorrelation. [email protected]
 COMP6053 lecture: Time series analysis, autocorrelation [email protected] Time series analysis The basic idea of time series analysis is simple: given an observed sequence, how can we build a model that
Promotional Forecast Demonstration
 Exhibit 2: Promotional Forecast Demonstration Consider the problem of forecasting for a proposed promotion that will start in December 1997 and continues beyond the forecast horizon. Assume that the promotion
Time Series Analysis
 JUNE 2012 Time Series Analysis CONTENT A time series is a chronological sequence of observations on a particular variable. Usually the observations are taken at regular intervals (days, months, years),
Some useful concepts in univariate time series analysis
 Some useful concepts in univariate time series analysis Autoregressive moving average models Autocorrelation functions Model Estimation Diagnostic measure Model selection Forecasting Assumptions: 1. Non-seasonal
Univariate and Multivariate Methods PEARSON. Addison Wesley
 Time Series Analysis Univariate and Multivariate Methods SECOND EDITION William W. S. Wei Department of Statistics The Fox School of Business and Management Temple University PEARSON Addison Wesley Boston
Using JMP Version 4 for Time Series Analysis Bill Gjertsen, SAS, Cary, NC
 Using JMP Version 4 for Time Series Analysis Bill Gjertsen, SAS, Cary, NC Abstract Three examples of time series will be illustrated. One is the classical airline passenger demand data with definite seasonal
Time Series Analysis
 Time Series 1 April 9, 2013 Time Series Analysis This chapter presents an introduction to the branch of statistics known as time series analysis. Often the data we collect in environmental studies is collected
IBM SPSS Forecasting 22
 IBM SPSS Forecasting 22 Note Before using this information and the product it supports, read the information in Notices on page 33. Product Information This edition applies to version 22, release 0, modification
Optimization: Optimal Pricing with Elasticity
 Optimization: Optimal Pricing with Elasticity Short Examples Series using Risk Simulator For more information please visit: www.realoptionsvaluation.com or contact us at: [email protected]
Chapter 6: Multivariate Cointegration Analysis
 Chapter 6: Multivariate Cointegration Analysis 1 Contents: Lehrstuhl für Department Empirische of Wirtschaftsforschung Empirical Research and und Econometrics Ökonometrie VI. Multivariate Cointegration
Univariate Time Series Analysis; ARIMA Models
 Econometrics 2 Spring 25 Univariate Time Series Analysis; ARIMA Models Heino Bohn Nielsen of4 Outline of the Lecture () Introduction to univariate time series analysis. (2) Stationarity. (3) Characterizing
Testing The Quantity Theory of Money in Greece: A Note
 ERC Working Paper in Economic 03/10 November 2003 Testing The Quantity Theory of Money in Greece: A Note Erdal Özmen Department of Economics Middle East Technical University Ankara 06531, Turkey [email protected]
Forecasting areas and production of rice in India using ARIMA model
 International Journal of Farm Sciences 4(1) :99-106, 2014 Forecasting areas and production of rice in India using ARIMA model K PRABAKARAN and C SIVAPRAGASAM* Agricultural College and Research Institute,
Readers will be provided a link to download the software and Excel files that are used in the book after payment. Please visit http://www.xlpert.
 Readers will be provided a link to download the software and Excel files that are used in the book after payment. Please visit http://www.xlpert.com for more information on the book. The Excel files are
SPSS TRAINING SESSION 3 ADVANCED TOPICS (PASW STATISTICS 17.0) Sun Li Centre for Academic Computing [email protected]
 Sun Li Centre for Academic Computing lsun@smu.edu.sg") SPSS TRAINING SESSION 3 ADVANCED TOPICS (PASW STATISTICS 17.0) Sun Li Centre for Academic Computing [email protected] IN SPSS SESSION 2, WE HAVE LEARNT: Elementary Data Analysis Group Comparison & One-way
SPSS TRAINING SESSION 3 ADVANCED TOPICS (PASW STATISTICS 17.0) Sun Li Centre for Academic Computing [email protected] IN SPSS SESSION 2, WE HAVE LEARNT: Elementary Data Analysis Group Comparison & One-way
Luciano Rispoli Department of Economics, Mathematics and Statistics Birkbeck College (University of London)
") Luciano Rispoli Department of Economics, Mathematics and Statistics Birkbeck College (University of London) 1 Forecasting: definition Forecasting is the process of making statements about events whose
Luciano Rispoli Department of Economics, Mathematics and Statistics Birkbeck College (University of London) 1 Forecasting: definition Forecasting is the process of making statements about events whose
Booth School of Business, University of Chicago Business 41202, Spring Quarter 2015, Mr. Ruey S. Tsay. Solutions to Midterm
 Booth School of Business, University of Chicago Business 41202, Spring Quarter 2015, Mr. Ruey S. Tsay Solutions to Midterm Problem A: (30 pts) Answer briefly the following questions. Each question has
Lecture 2: ARMA(p,q) models (part 3)
 models (part 3)") Lecture 2: ARMA(p,q) models (part 3) Florian Pelgrin University of Lausanne, École des HEC Department of mathematics (IMEA-Nice) Sept. 2011 - Jan. 2012 Florian Pelgrin (HEC) Univariate time series Sept.
Lecture 2: ARMA(p,q) models (part 3) Florian Pelgrin University of Lausanne, École des HEC Department of mathematics (IMEA-Nice) Sept. 2011 - Jan. 2012 Florian Pelgrin (HEC) Univariate time series Sept.
IBM SPSS Forecasting 21
 IBM SPSS Forecasting 21 Note: Before using this information and the product it supports, read the general information under Notices on p. 107. This edition applies to IBM SPSS Statistics 21 and to all
Univariate Time Series Analysis; ARIMA Models
 Econometrics 2 Fall 25 Univariate Time Series Analysis; ARIMA Models Heino Bohn Nielsen of4 Univariate Time Series Analysis We consider a single time series, y,y 2,..., y T. We want to construct simple
Promotional Analysis and Forecasting for Demand Planning: A Practical Time Series Approach Michael Leonard, SAS Institute Inc.
 Promotional Analysis and Forecasting for Demand Planning: A Practical Time Series Approach Michael Leonard, SAS Institute Inc. Cary, NC, USA Abstract Many businesses use sales promotions to increase the
Analysis of the Volatility of the Electricity Price in Kenya Using Autoregressive Integrated Moving Average Model
 Science Journal of Applied Mathematics and Statistics 2015; 3(2): 47-57 Published online March 28, 2015 (http://www.sciencepublishinggroup.com/j/sjams) doi: 10.11648/j.sjams.20150302.14 ISSN: 2376-9491
Threshold Autoregressive Models in Finance: A Comparative Approach
 University of Wollongong Research Online Applied Statistics Education and Research Collaboration (ASEARC) - Conference Papers Faculty of Informatics 2011 Threshold Autoregressive Models in Finance: A Comparative
Chapter 9: Univariate Time Series Analysis
 Chapter 9: Univariate Time Series Analysis In the last chapter we discussed models with only lags of explanatory variables. These can be misleading if: 1. The dependent variable Y t depends on lags of
MULTIPLE REGRESSION AND ISSUES IN REGRESSION ANALYSIS
 MULTIPLE REGRESSION AND ISSUES IN REGRESSION ANALYSIS MSR = Mean Regression Sum of Squares MSE = Mean Squared Error RSS = Regression Sum of Squares SSE = Sum of Squared Errors/Residuals α = Level of Significance
Time Series Analysis of Aviation Data
 Time Series Analysis of Aviation Data Dr. Richard Xie February, 2012 What is a Time Series A time series is a sequence of observations in chorological order, such as Daily closing price of stock MSFT in
Chapter 4: Vector Autoregressive Models
 Chapter 4: Vector Autoregressive Models 1 Contents: Lehrstuhl für Department Empirische of Wirtschaftsforschung Empirical Research and und Econometrics Ökonometrie IV.1 Vector Autoregressive Models (VAR)...
Wooldridge, Introductory Econometrics, 3d ed. Chapter 12: Serial correlation and heteroskedasticity in time series regressions
 Wooldridge, Introductory Econometrics, 3d ed. Chapter 12: Serial correlation and heteroskedasticity in time series regressions What will happen if we violate the assumption that the errors are not serially
Energy Load Mining Using Univariate Time Series Analysis
 Energy Load Mining Using Univariate Time Series Analysis By: Taghreed Alghamdi & Ali Almadan 03/02/2015 Caruth Hall 0184 Energy Forecasting Energy Saving Energy consumption Introduction: Energy consumption.
Module 5: Multiple Regression Analysis
 Using Statistical Data Using to Make Statistical Decisions: Data Multiple to Make Regression Decisions Analysis Page 1 Module 5: Multiple Regression Analysis Tom Ilvento, University of Delaware, College
FORECASTING AND TIME SERIES ANALYSIS USING THE SCA STATISTICAL SYSTEM
 FORECASTING AND TIME SERIES ANALYSIS USING THE SCA STATISTICAL SYSTEM VOLUME 2 Expert System Capabilities for Time Series Modeling Simultaneous Transfer Function Modeling Vector Modeling by Lon-Mu Liu
FORECAST MODEL USING ARIMA FOR STOCK PRICES OF AUTOMOBILE SECTOR. Aloysius Edward. 1, JyothiManoj. 2
 FORECAST MODEL USING ARIMA FOR STOCK PRICES OF AUTOMOBILE SECTOR Aloysius Edward. 1, JyothiManoj. 2 Faculty, Kristu Jayanti College, Autonomous, Bengaluru. Abstract There has been a growing interest in
TEMPORAL CAUSAL RELATIONSHIP BETWEEN STOCK MARKET CAPITALIZATION, TRADE OPENNESS AND REAL GDP: EVIDENCE FROM THAILAND
 I J A B E R, Vol. 13, No. 4, (2015): 1525-1534 TEMPORAL CAUSAL RELATIONSHIP BETWEEN STOCK MARKET CAPITALIZATION, TRADE OPENNESS AND REAL GDP: EVIDENCE FROM THAILAND Komain Jiranyakul * Abstract: This study
Performing Unit Root Tests in EViews. Unit Root Testing
 Página 1 de 12 Unit Root Testing The theory behind ARMA estimation is based on stationary time series. A series is said to be (weakly or covariance) stationary if the mean and autocovariances of the series
Introduction to Regression and Data Analysis
 Statlab Workshop Introduction to Regression and Data Analysis with Dan Campbell and Sherlock Campbell October 28, 2008 I. The basics A. Types of variables Your variables may take several forms, and it
AUTOMATION OF ENERGY DEMAND FORECASTING. Sanzad Siddique, B.S.
 AUTOMATION OF ENERGY DEMAND FORECASTING by Sanzad Siddique, B.S. A Thesis submitted to the Faculty of the Graduate School, Marquette University, in Partial Fulfillment of the Requirements for the Degree
Forecasting Stock Market Series. with ARIMA Model
 Journal of Statistical and Econometric Methods, vol.3, no.3, 2014, 65-77 ISSN: 2241-0384 (print), 2241-0376 (online) Scienpress Ltd, 2014 Forecasting Stock Market Series with ARIMA Model Fatai Adewole
Chapter 1. Vector autoregressions. 1.1 VARs and the identi cation problem
 Chapter Vector autoregressions We begin by taking a look at the data of macroeconomics. A way to summarize the dynamics of macroeconomic data is to make use of vector autoregressions. VAR models have become
Time Series Analysis and Forecasting Methods for Temporal Mining of Interlinked Documents
 Time Series Analysis and Forecasting Methods for Temporal Mining of Interlinked Documents Prasanna Desikan and Jaideep Srivastava Department of Computer Science University of Minnesota. @cs.umn.edu
USE OF ARIMA TIME SERIES AND REGRESSORS TO FORECAST THE SALE OF ELECTRICITY
 Paper PO10 USE OF ARIMA TIME SERIES AND REGRESSORS TO FORECAST THE SALE OF ELECTRICITY Beatrice Ugiliweneza, University of Louisville, Louisville, KY ABSTRACT Objectives: To forecast the sales made by
Vector Time Series Model Representations and Analysis with XploRe
 0-1 Vector Time Series Model Representations and Analysis with plore Julius Mungo CASE - Center for Applied Statistics and Economics Humboldt-Universität zu Berlin [email protected] plore MulTi Motivation
2.2 Elimination of Trend and Seasonality
 26 CHAPTER 2. TREND AND SEASONAL COMPONENTS 2.2 Elimination of Trend and Seasonality Here we assume that the TS model is additive and there exist both trend and seasonal components, that is X t = m t +
Predicting Indian GDP. And its relation with FMCG Sales
 Predicting Indian GDP And its relation with FMCG Sales GDP A Broad Measure of Economic Activity Definition The monetary value of all the finished goods and services produced within a country's borders
Dynamics of Real Investment and Stock Prices in Listed Companies of Tehran Stock Exchange
 Dynamics of Real Investment and Stock Prices in Listed Companies of Tehran Stock Exchange Farzad Karimi Assistant Professor Department of Management Mobarakeh Branch, Islamic Azad University, Mobarakeh,
Rob J Hyndman. Forecasting using. 11. Dynamic regression OTexts.com/fpp/9/1/ Forecasting using R 1
 Rob J Hyndman Forecasting using 11. Dynamic regression OTexts.com/fpp/9/1/ Forecasting using R 1 Outline 1 Regression with ARIMA errors 2 Example: Japanese cars 3 Using Fourier terms for seasonality 4
Is the Forward Exchange Rate a Useful Indicator of the Future Exchange Rate?
 Is the Forward Exchange Rate a Useful Indicator of the Future Exchange Rate? Emily Polito, Trinity College In the past two decades, there have been many empirical studies both in support of and opposing
Application of ARIMA models in soybean series of prices in the north of Paraná
 78 Application of ARIMA models in soybean series of prices in the north of Paraná Reception of originals: 09/24/2012 Release for publication: 10/26/2012 Israel José dos Santos Felipe Mestrando em Administração
Time Series Analysis
 Time Series Analysis Forecasting with ARIMA models Andrés M. Alonso Carolina García-Martos Universidad Carlos III de Madrid Universidad Politécnica de Madrid June July, 2012 Alonso and García-Martos (UC3M-UPM)
State Space Time Series Analysis
 State Space Time Series Analysis p. 1 State Space Time Series Analysis Siem Jan Koopman http://staff.feweb.vu.nl/koopman Department of Econometrics VU University Amsterdam Tinbergen Institute 2011 State
Forecasting the PhDs-Output of the Higher Education System of Pakistan
 Forecasting the PhDs-Output of the Higher Education System of Pakistan Ghani ur Rehman, Dr. Muhammad Khalil Shahid, Dr. Bakhtiar Khan Khattak and Syed Fiaz Ahmed Center for Emerging Sciences, Engineering
96 PROC. OF THE 10th PYTHON IN SCIENCE CONF. (SCIPY 2011) Time Series Analysis in Python with statsmodels
 Time Series Analysis in Python with statsmodels") 96 PROC. OF HE 10th PYHON IN SCIENCE CONF. (SCIPY 2011) ime Series Analysis in Python with statsmodels Wes McKinney, Josef Perktold, Skipper Seabold Abstract We introduce the new time series analysis features
96 PROC. OF HE 10th PYHON IN SCIENCE CONF. (SCIPY 2011) ime Series Analysis in Python with statsmodels Wes McKinney, Josef Perktold, Skipper Seabold Abstract We introduce the new time series analysis features
PITFALLS IN TIME SERIES ANALYSIS. Cliff Hurvich Stern School, NYU
 PITFALLS IN TIME SERIES ANALYSIS Cliff Hurvich Stern School, NYU The t -Test If x 1,..., x n are independent and identically distributed with mean 0, and n is not too small, then t = x 0 s n has a standard
5. Multiple regression
 5. Multiple regression QBUS6840 Predictive Analytics https://www.otexts.org/fpp/5 QBUS6840 Predictive Analytics 5. Multiple regression 2/39 Outline Introduction to multiple linear regression Some useful
SPC Data Visualization of Seasonal and Financial Data Using JMP WHITE PAPER
 SPC Data Visualization of Seasonal and Financial Data Using JMP WHITE PAPER SAS White Paper Table of Contents Abstract.... 1 Background.... 1 Example 1: Telescope Company Monitors Revenue.... 3 Example
Do Electricity Prices Reflect Economic Fundamentals?: Evidence from the California ISO
 Do Electricity Prices Reflect Economic Fundamentals?: Evidence from the California ISO Kevin F. Forbes and Ernest M. Zampelli Department of Business and Economics The Center for the Study of Energy and
Granger Causality between Government Revenues and Expenditures in Korea
 Volume 23, Number 1, June 1998 Granger Causality between Government Revenues and Expenditures in Korea Wan Kyu Park ** 2 This paper investigates the Granger causal relationship between government revenues
Chapter 25 Specifying Forecasting Models
 Chapter 25 Specifying Forecasting Models Chapter Table of Contents SERIES DIAGNOSTICS...1281 MODELS TO FIT WINDOW...1283 AUTOMATIC MODEL SELECTION...1285 SMOOTHING MODEL SPECIFICATION WINDOW...1287 ARIMA
Overview of Violations of the Basic Assumptions in the Classical Normal Linear Regression Model
 Overview of Violations of the Basic Assumptions in the Classical Normal Linear Regression Model 1 September 004 A. Introduction and assumptions The classical normal linear regression model can be written
THE SVM APPROACH FOR BOX JENKINS MODELS
 REVSTAT Statistical Journal Volume 7, Number 1, April 2009, 23 36 THE SVM APPROACH FOR BOX JENKINS MODELS Authors: Saeid Amiri Dep. of Energy and Technology, Swedish Univ. of Agriculture Sciences, P.O.Box
Econometric Modelling for Revenue Projections
 Econometric Modelling for Revenue Projections Annex E 1. An econometric modelling exercise has been undertaken to calibrate the quantitative relationship between the five major items of government revenue
Chapter 9: Serial Correlation
 Chapter 9: Serial Correlation In this chapter: 1. Creating a residual series from a regression model 2. Plotting the error term to detect serial correlation (UE, pp. 313-315) 3. Using regression to estimate
MGT 267 PROJECT. Forecasting the United States Retail Sales of the Pharmacies and Drug Stores. Done by: Shunwei Wang & Mohammad Zainal
 MGT 267 PROJECT Forecasting the United States Retail Sales of the Pharmacies and Drug Stores Done by: Shunwei Wang & Mohammad Zainal Dec. 2002 The retail sale (Million) ABSTRACT The present study aims
Forecasting methods applied to engineering management
 Forecasting methods applied to engineering management Áron Szász-Gábor Abstract. This paper presents arguments for the usefulness of a simple forecasting application package for sustaining operational
Forecasting model of electricity demand in the Nordic countries. Tone Pedersen
 Forecasting model of electricity demand in the Nordic countries Tone Pedersen 3/19/2014 Abstract A model implemented in order to describe the electricity demand on hourly basis for the Nordic countries.
3.1 Stationary Processes and Mean Reversion
 3. Univariate Time Series Models 3.1 Stationary Processes and Mean Reversion Definition 3.1: A time series y t, t = 1,..., T is called (covariance) stationary if (1) E[y t ] = µ, for all t Cov[y t, y t
Examining the effects of exchange rates on Australian domestic tourism demand: A panel generalized least squares approach
 19th International Congress on Modelling and Simulation, Perth, Australia, 12 16 December 2011 http://mssanz.org.au/modsim2011 Examining the effects of exchange rates on Australian domestic tourism demand:
Time Series Laboratory
 Time Series Laboratory Computing in Weber Classrooms 205-206: To log in, make sure that the DOMAIN NAME is set to MATHSTAT. Use the workshop username: primesw The password will be distributed during the