Lesson 3: Constructing Circle Graphs. Selected Content Standards. Translating Content Standards into Instruction
|
|
|
- Jody Harrington
- 9 years ago
- Views:
Transcription
1 Lesson 3: Constructing Circle Graphs Selected Content Standards Benchmarks Addressed: D-1-M Systematically collecting, organizing, describing, and displaying data in charts, tables, plots, graphs, and/or spreadsheets D-2-M Analyzing, interpreting, evaluating, drawing inferences, and making estimations, predictions, decisions, and convincing arguments based on organized data (e.g., analyze data using concepts of mean, median, mode, range, random samples, sample size, bias, and data extremes) GLEs Addressed: Grade Analyze and interpret circle graphs, and determine when a circle graph is the most appropriate type of graph to use (D-2-M) Grade Organize and display data using circle graphs (D-1-M) GEE 21 Connection Students will be required to Construct circle graphs from given sets of data. Interpret and summarize a set of experimental data presented in a circle graph in context. Draw conclusions from a variety of circle graphs. Translating Content Standards into Instruction A. Circle graphs A circle graph is used to show the relationship of parts to a whole and to each other. Each pie-shaped wedge represents a fractional part of a whole. Data that lend themselves well to circle graphs are family budgets, percentage of time students study each academic subject, or how a student spends a typical day. On Student Worksheet #1 students are expected to construct a circle graph on how they spend their day. Student Worksheet #2 has a completed circle graph with questions for students to answer. Student Worksheet #1 will not have an answer sheet, but it should look like the example below. Student Worksheet #2 has an answer sheet. 28
 GEE 21 Connection Students will be required to Construct circle graphs from given sets of data.")
2 Steps to constructing a circle graph: These instructions are found on the Student Worksheet #2. What you see below is also on a Teacher Blackline master. 1. Set up a table, giving to each category the fractional part of a whole each category represents, and the number of degrees of each category found, by multiplying the fractional part by 360. The sum of the parts should add up to 360 degrees. 2. Draw a large circle with the compass or with a pattern. Locate the center of the circle. 3. Use a protractor to draw central angles, with the number of degrees representing each category. 4. Label each wedge, or color them and show the legend for the colors. 5. Give the circle graph a title. Example: Mrs. Johnson s class decided to construct circle graphs showing how each student spent a typical school day. Kristen s day went as follows: 8.5 hours of sleep, 1.5 hours eating, 2 hours homework, 2 hours volleyball practice, 6.5 hours in school, 1 hour miscellaneous activities, and 2.5 hours for friends and family. She set up a table as shown below: Using her calculator she divided the number of hours in each category by 24 and then multiplied that by 360 degrees. Category Hours Fractional part of 24 hours Number of degrees Sleep 9 9/ Eating 1 1/24 15 Homework 2 2/24 30 Volleyball practice 2 2/24 30 School /24 98 Friends and family /24 37 Miscellaneous 1 1/24 15 Finally, she drew a circle and located the center. With her protractor, she constructed successive central angles, using the number of degrees representing each part. She labeled each pie-shaped wedge with the category. She gave the graph a title above the circle. How I Spend My Day Misc. Friends and family School Volleyball practice Sleep Eating Homework 29

3 Sources of Evidence of Student Learning GEE 21 Connection These benchmarks may be assessed either by multiple-choice questions or a free response question. Below are four examples of what students might see in a multiple-choice question. These were taken from the Illinois and Massachusetts state tests, either of which can be accessed on the Department of Education Web site. 1. Mr. Brown makes $350 a week. How much money does he spend on entertainment each week? A. $13.00 B. $42.00 C. $45.50* D. $87.50 E. $ The circle graph represents sales of five different types of automobiles. Which automobile accounted for about 25% of the sales? Sales of Automobiles A. K B. L* C. M D. X E. Z 3. Consider a school of 2000 students. Based on the data in the graph, about how many of the 2000 students would you expect to choose fruit as their favorite snack? A. 750 B. 400* C. 150 D

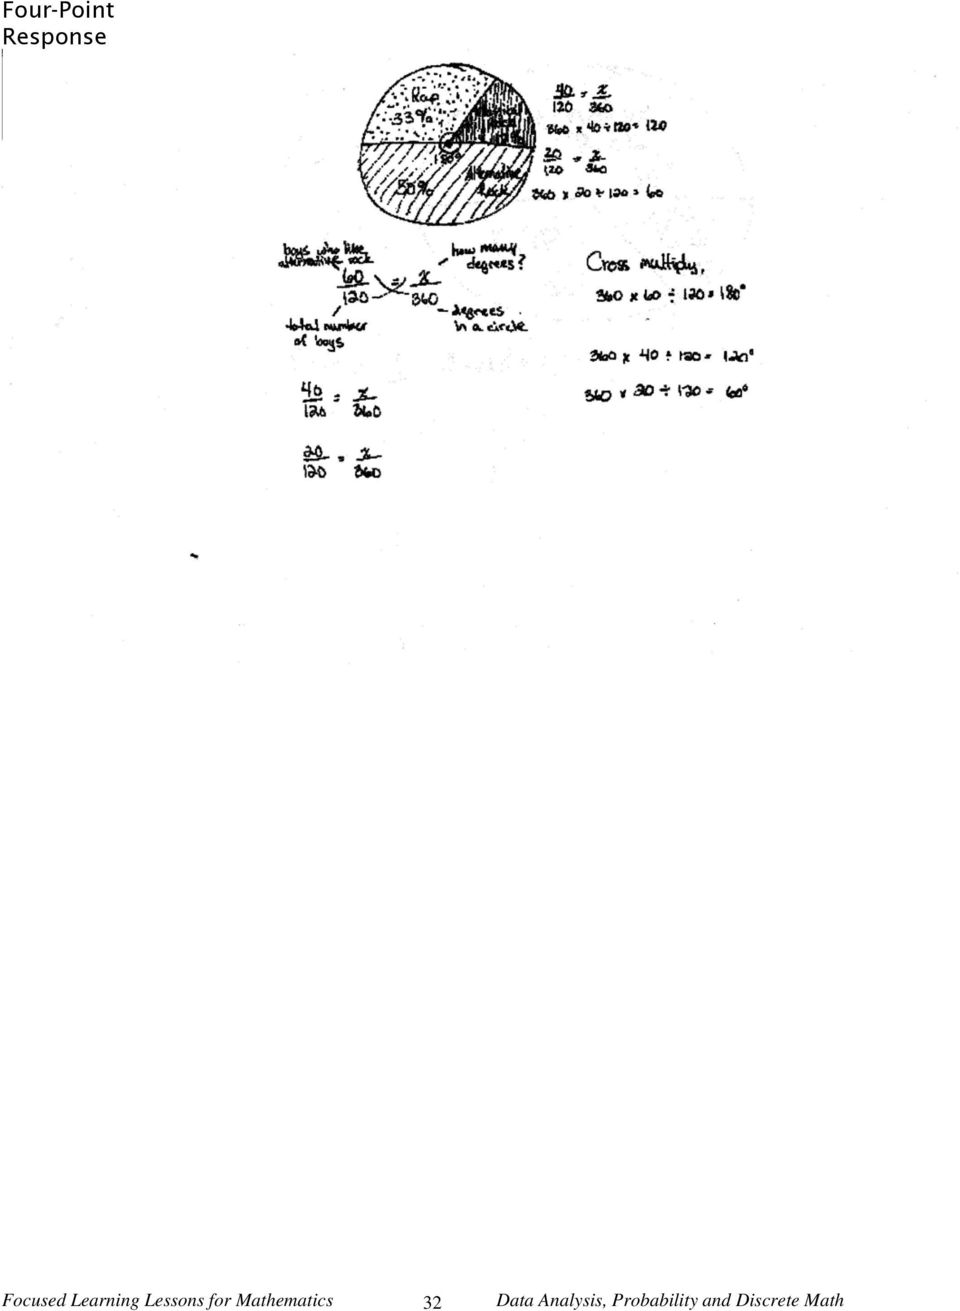
4 4. According to the 1990 U.S. Census, 27.2% of Massachusetts residents over the age of 25 had graduated from a 4-year college. In a circle graph representing all Massachusetts residents over the age of 25, about how many degrees should be in the sector representing these 4-year college graduates? A. 27 o B. 17 o C. 98 o * D. 68 o The Massachusetts Comprehensive Assessment System Attributes of Student Work at the Got-It level Most questions related to circle graphs on the GEE 21 involve the analysis of a circle graph such as the one on Worksheet #2. However, it is very important that a student knows how a circle graph is constructed before he/she begins to analyze such a graph. This is an open response problem from the Massachusetts Comprehensive Assessment System. A tenth grade class took a survey and found that the most popular types of music in their school were alternative rock, rap, and classic rock. They took a second survey to find out the student s preference among these three types of music. These are the results for 120 students. Favorite Types of Music Alternative Rock Rap Classic Rock a. Make a rough sketch of a circle graph displaying these data. Tell how many degrees should be in each sector of the graph. b. Explain how you found the number of degrees for each sector. Sample Student Work One-Point Response 31

5 Four-Point Response 32
6 Lesson 3: Constructing Circle Graphs Teacher Blackline Master Making a circle graph. Category Hours Fractional part of 24 hours Number of degrees Sleep 9 Eating 1 Homework 2 Volleyball practice 2 School 6.5 Friends and family 2.5 Miscellaneous 1 33

7 Lesson 3: Constructing Circle Graphs Student Worksheet #1 Begin by filling in the table below listing your activities in the left column. Three categories have been filled in for you. How do you spend the rest of your day? Sports? Watching TV? Doing homework? Visiting with friends? Working? Category Hours Fractional part of 24 hours Sleep Number of degrees Eating School 34

8 Lesson 3: Constructing Circle Graphs Student Worksheet #2 1) To the right is a pie chart showing how John plans to spend his money each month. If John s take home salary is $ each month, how much does he spend on the following: a) rent b) clothes c) his automobile Recreation 8% Clothes 14% John's Monthly Budget Savings 6% Rent 38% d) recreation e) food Food 12% f) savings Auto 22% 2) Suppose John received a monthly raise of $50; would that change any of the percentages? 3) Suppose he decided to spend the $50 on recreation only; how would that change the percentages? Recreation, rent, clothes, automobile, food, savings Lesson 3: Constructing Circle Graphs Student Worksheet #2 Answers 1) (a) $ (b) $ (c) $ (d) $64.40 (e) $96.60 (f) $ ) No This would change the amount of money spent in each category but would not change the percentages. 3) Recreation 13%; rent 36%; clothes 13%; auto 21%; food 11%; savings 6% 35
 Suppose he decided to spend the $50 on recreation only; how would that change the percentages?")
Lesson 2: Constructing Line Graphs and Bar Graphs
 Lesson 2: Constructing Line Graphs and Bar Graphs Selected Content Standards Benchmarks Assessed: D.1 Designing and conducting statistical experiments that involve the collection, representation, and analysis
Mathematics Content: Pie Charts; Area as Probability; Probabilities as Percents, Decimals & Fractions
 Title: Using the Area on a Pie Chart to Calculate Probabilities Mathematics Content: Pie Charts; Area as Probability; Probabilities as Percents, Decimals & Fractions Objectives: To calculate probability
Lesson 1: Fractions, Decimals and Percents
 Lesson 1: Fractions, Decimals and Percents Selected Content Standards Benchmarks Addressed: N-2-H Demonstrating that a number can be expressed in many forms, and selecting an appropriate form for a given
Comparing Sets of Data Grade Eight
 Ohio Standards Connection: Data Analysis and Probability Benchmark C Compare the characteristics of the mean, median, and mode for a given set of data, and explain which measure of center best represents
Creating Bar Graphs and Pie Charts
 8.4 Creating Bar Graphs and Pie Charts 8.4 OBJECTIVES 1. Use a table to create a bar graph 2. Read a pie chart 3. Use a table to create a pie chart As we have seen, it is frequently easier to read information
Lesson 4: Solving and Graphing Linear Equations
 Lesson 4: Solving and Graphing Linear Equations Selected Content Standards Benchmarks Addressed: A-2-M Modeling and developing methods for solving equations and inequalities (e.g., using charts, graphs,
Economics analyzing the impact of the scarcity of productive resources and examining the choices and opportunity cost that result
 TITLE: Choice, Opportunity Cost, and Decisions PRIMARY SUBJECT AREAS: High School Economics GRADE LEVELS: 9-12 OVERVIEW: Scarcity, choice, and cost are sometimes referred to as a basic trilogy of economics,
Lesson 3: Using Inequalities to Problem Solve
 Lesson 3: Using Inequalities to Problem Solve Selected Content Standards Benchmarks Addressed: N-1-M Demonstrating that a rational number can be expressed in many forms, and selecting an appropriate form
Charts, Tables, and Graphs
 Charts, Tables, and Graphs The Mathematics sections of the SAT also include some questions about charts, tables, and graphs. You should know how to (1) read and understand information that is given; (2)
MoneyAndStuff.info Budgeting Lesson Plan
 AndStuff.info Budgeting Lesson Plan Grade Level: 3 5 Time Duration: 1 hour/class period Overview & Purpose: This activity is designed to help students develop the attitudes and skills needed to achieve
Discovering Math: Using and Collecting Data Teacher s Guide
 Teacher s Guide Grade Level: 3-5 Curriculum Focus: Mathematics Lesson Duration: Four class periods Program Description Discovering Math: Using and Collecting Data From data points and determining spread
Computer Skills Microsoft Excel Creating Pie & Column Charts
 Computer Skills Microsoft Excel Creating Pie & Column Charts In this exercise, we will learn how to display data using a pie chart and a column chart, color-code the charts, and label the charts. Part
Progress Check 6. Objective To assess students progress on mathematical content through the end of Unit 6. Looking Back: Cumulative Assessment
 Progress Check 6 Objective To assess students progress on mathematical content through the end of Unit 6. Looking Back: Cumulative Assessment The Mid-Year Assessment in the Assessment Handbook is a written
Lesson 5: Percent Change Bellringer
 Lesson 5: Percent Change Bellringer Find 88% of your class! Lesson 5: Percent Change Classwork Let s Think: Mrs. Accordino had you do a new sprint today on converting numbers in to percents! You compare
What is a Box and Whisker Plot?
 Algebra/Geometry Institute Summer 2006 Faculty Name: Archie Mitchell School: Walter C. Robinson Achievement Center (Cleveland, Ms) Grade Level: 8 th Grade What is a Box and Whisker Plot? 1) Teaching objective(s):
Standard 1: Students can understand and apply a variety of math concepts.
 Grade Level: 4th Teacher: Pelzer/Reynolds Math Standard/Benchmark: A. understand and apply number properties and operations. Grade Level Objective: 1.A.4.1: develop an understanding of addition, subtraction,
Spreadsheets Hop-around Cards
 Spreadsheets Hop-around Cards Visit us online at HOP-AROUND CARDS Preparation Print the cards out using a high quality colour printer Laminate each sheet and then cut out the individual cards to make a
How Do You Manage Money? Lesson 3a: How Do People Make Good Spending Decisions?
 How Do You Manage Money? Lesson 3a: How Do People Make Good Spending Decisions? Adopted from lesson plans created by Jennifer Raeder for the San Francisco Unified School District s Kindergarten to College
Grade. 8 th Grade. 2011 SM C Curriculum
 OREGON FOCUS ON MATH OAKS HOT TOPICS TEST PREPARATION WORKBOOK 200-204 8 th Grade TO BE USED AS A SUPPLEMENT FOR THE OREGON FOCUS ON MATH MIDDLE SCHOOL CURRICULUM FOR THE 200-204 SCHOOL YEARS WHEN THE
My Media LESSON PLAN UNIT 2. Essential Question What are your personal media habits, and how much time do you spend with different forms of media?
 LESSON PLAN My Media UNIT 2 Essential Question What are your personal media habits, and how much time do you spend with different forms of media? Lesson Overview Students review their media habits and
Favorite Book, Movie, and TV Show Survey
 and TV Show Survey Objectives Each student will utilize the Google Docs form application to create a simple survey to gather information about his or her classmates favorite books, movies, and TV shows.
Statistics and Probability
 Statistics and Probability TABLE OF CONTENTS 1 Posing Questions and Gathering Data. 2 2 Representing Data. 7 3 Interpreting and Evaluating Data 13 4 Exploring Probability..17 5 Games of Chance 20 6 Ideas
Step 3: Go to Column C. Use the function AVERAGE to calculate the mean values of n = 5. Column C is the column of the means.
 EXAMPLES - SAMPLING DISTRIBUTION EXCEL INSTRUCTIONS This exercise illustrates the process of the sampling distribution as stated in the Central Limit Theorem. Enter the actual data in Column A in MICROSOFT
Lesson 9: To Rent-to-Own or Not to Rent-to-Own?
 All About Credit Lesson 9: To Rent-to-Own or Not to Rent-to-Own? Standards and Benchmarks (see page C-61) Lesson Description Students review the elements of a contract. They discuss the characteristics
The Utah Basic Skills Competency Test Framework Mathematics Content and Sample Questions
 The Utah Basic Skills Competency Test Framework Mathematics Content and Questions Utah law (53A-1-611) requires that all high school students pass The Utah Basic Skills Competency Test in order to receive
LESSON 2 -- RENTING A PLACE TO LIVE
 LESSON 2 -- RENTING A PLACE TO LIVE LESSON DESCRIPTION AND BACKGROUND This lesson uses the Better Money Habits video The True Cost of Renting a Place (www.bettermoneyhabits.com) to help students will learn
Lesson 4: Surface Area
 Lesson 4: Surface Area Selected Content Standards Benchmarks Addressed: M-1-M Applying the concepts of length, area, surface area, volume, capacity, weight, mass, money, time, temperature, and rate to
EXCEL EXERCISE #8: Consolidating and Linking Spreadsheets
 EXCEL EXERCISE #: Consolidating and Linking Spreadsheets. Enter the following information onto Sheet. Double click on the tab for the worksheet and rename it: East. (It represents sales in $000.) 0 Record
The students will gather, organize, and display data in an appropriate pie (circle) graph.
 graph.") Algebra/Geoetry Institute Suer 2005 Lesson Plan 3: Pie Graphs Faculty Nae: Leslie Patten School: Cypress Park Eleentary Grade Level: 5 th grade PIE GRAPHS 1 Teaching objective(s) The students will gather,
Algebra/Geoetry Institute Suer 2005 Lesson Plan 3: Pie Graphs Faculty Nae: Leslie Patten School: Cypress Park Eleentary Grade Level: 5 th grade PIE GRAPHS 1 Teaching objective(s) The students will gather,
Models of a Vending Machine Business
 Math Models: Sample lesson Tom Hughes, 1999 Models of a Vending Machine Business Lesson Overview Students take on different roles in simulating starting a vending machine business in their school that
Pet Responsibility Lesson Plan
 Pet Responsibility Lesson Plan Grades: 6-9 Ages: Time: 11-14 years These six lessons can be modified to meet various time constraints. Character Pillars: Standards: Responsibility Fairness Standard Area
(1): 50 minutes None Whole Class N/A 03.SC.TE.04 3-5.TE.2.2 Bar Graph, Graph, Line graph, Pie Graph
: 50 minutes None Whole Class N/A 03.SC.TE.04 3-5.TE.2.2 Bar Graph, Graph, Line graph, Pie Graph") 3.G.1 What is a Graph? Creation and interpretation of various graph types Grade Level 3 Sessions Seasonality Instructional Mode(s) Team Size WPS Benchmarks MA Frameworks Key Words (1): 50 minutes Whole
3.G.1 What is a Graph? Creation and interpretation of various graph types Grade Level 3 Sessions Seasonality Instructional Mode(s) Team Size WPS Benchmarks MA Frameworks Key Words (1): 50 minutes Whole
Graph it! Grade Six. Estimated Duration: Three hours
 Ohio Standards Connection Data Analysis and Probability Benchmark A Read, Create and use line graphs, histograms, circle graphs, box-and whisker plots, stem-and-leaf plots, and other representations when
Lesson 1: Linear Measurement
 Lesson 1: Linear Selected Content Standards Benchmarks Addressed: M-1-M Applying the concepts of length, area, surface area, volume, capacity, weight, mass, money, time, temperature, and rate to real-world
Making Money by Teaching Music Lessons
 Making Money by Teaching Music Lessons GRADE 11 Professional musicians often need to rely on more than performances alone to generate income. The aim of this lesson is to demonstrate the entrepreneurial
7 th Grade Integer Arithmetic 7-Day Unit Plan by Brian M. Fischer Lackawanna Middle/High School
 7 th Grade Integer Arithmetic 7-Day Unit Plan by Brian M. Fischer Lackawanna Middle/High School Page 1 of 20 Table of Contents Unit Objectives........ 3 NCTM Standards.... 3 NYS Standards....3 Resources
Making a Chart Using Excel
 Name Date Section Making a Chart Using Excel In this activity you will use an Excel spreadsheet to find the total number of students in a survey, and then you will create a graph to display the results
Applied. Grade 9 Assessment of Mathematics LARGE PRINT RELEASED ASSESSMENT QUESTIONS
 Applied Grade 9 Assessment of Mathematics 2014 RELEASED ASSESSMENT QUESTIONS Record your answers to multiple-choice questions on the Student Answer Sheet (2014, Applied). LARGE PRINT Please note: The format
Lab 11: Budgeting with Excel
 Lab 11: Budgeting with Excel This lab exercise will have you track credit card bills over a period of three months. You will determine those months in which a budget was met for various categories. You
One-Inch Graph Paper
 One-Inch Graph Paper Classroom Strategies Blackline Master II - 1 49 Half-Inch Graph Paper 50 Classroom Strategies Blackline Master II - 2 Two-Centimeter Graph Paper Classroom Strategies Blackline Master
PROBABILITY AND STATISTICS
 PROBABILITY AND STATISTICS Grade Level: Written by: Length of Unit: Middle School, Science and Math Monica Edwins, Twin Peaks Charter Academy, Longmont, Colorado Four Lessons, plus a Culminating Activity
Popular Sports Survey
 Sports Survey Objectives Each student will utilize the Google Docs form application to create a survey about his or her classmates favorite sports. He or she will then analyze the results. Benchmarks for
NEW MEXICO Grade 6 MATHEMATICS STANDARDS
 PROCESS STANDARDS To help New Mexico students achieve the Content Standards enumerated below, teachers are encouraged to base instruction on the following Process Standards: Problem Solving Build new mathematical
Rational Number Project
 Rational Number Project Initial Fraction Ideas Lesson : Overview Students observe with circles that as the unit is divided into more and more equal parts, the unit parts become smaller. Materials Fraction
MATHS LEVEL DESCRIPTORS
 MATHS LEVEL DESCRIPTORS Number Level 3 Understand the place value of numbers up to thousands. Order numbers up to 9999. Round numbers to the nearest 10 or 100. Understand the number line below zero, and
Comparing Fractions Objective To provide practice ordering sets of fractions.
 Comparing Fractions Objective To provide practice ordering sets of fractions. www.everydaymathonline.com epresentations etoolkit Algorithms Practice EM Facts Workshop Game Family Letters Assessment Management
Grade 5 Mathematics Curriculum Guideline Scott Foresman - Addison Wesley 2008. Chapter 1: Place, Value, Adding, and Subtracting
 Grade 5 Math Pacing Guide Page 1 of 9 Grade 5 Mathematics Curriculum Guideline Scott Foresman - Addison Wesley 2008 Test Preparation Timeline Recommendation: September - November Chapters 1-5 December
In this example, Mrs. Smith is looking to create graphs that represent the ethnic diversity of the 24 students in her 4 th grade class.
 Creating a Pie Graph Step-by-step directions In this example, Mrs. Smith is looking to create graphs that represent the ethnic diversity of the 24 students in her 4 th grade class. 1. Enter Data A. Open
School Improvement Surveys
 School Improvement Surveys SURVEY 1: STUDENT VIEWS OF SCHOOL Step 1. Students complete the survey. Step 2. Students cut out the rectangles and make bar graphs to show the results of their survey. (They
Discovering Math: Data and Graphs Teacher s Guide
 Teacher s Guide Grade Level: K 2 Curriculum Focus: Mathematics Lesson Duration: Two class periods Program Description Discovering Math: Data and Graphs From simple graphs to sampling to determining what
6 Worksheet on Statistics: Tables, Graphs, Charts
 6 Worksheet on Statistics: Tables, Graphs, Charts Text: websites containing relevant statistics Source 1: http://www.who.int/countries/ind/en/ Source 2: http://www.who.int/countries/deu/en/ (Please copy
Andrew T. Hill, Ph.D., Federal Reserve Bank of Philadelphia
 By Peter H. Reynolds/ISBN: 076362623-6 Lesson by: Andrew T. Hill, Ph.D., Federal Reserve Bank of Philadelphia Lesson Description In this lesson, students learn about scarcity, alternatives, choices and
Multiplying Integers. Lesson Plan
 Lesson Plan Video: 12 minutes Lesson: 38 minutes Pre-viewing :00 Warm up: Write 5 + 5 + 5 + 5 = on the board. Ask students for the answer. Then write 5 x 4 = on the board. Ask the students for the answer.
A financial statement captures a person s overall wealth at a specific point in time. In this lesson, students will:
 PROJECT 3 CASH FLOW AND BALANCE SHEETS INSTRUCTOR OVERVIEW Financial statements are compilations of personal financial data that describe an individual s current financial condition. Financial statements
A financial statement captures a person s overall wealth at a specific point in time. In this lesson, students will:
 PROJECT 3 CASH FLOW AND BALANC E SHEETS INSTRUCTOR OVERVIEW Financial statements are compilations of personal financial data that describe an individual s current financial condition. Financial statements
Creating Graphs. Learning Objective-To create graphs that show data.
 Creating Graphs Summary- Key Words- Students will be able to identify graphs, components of graphs, interpret graphs, and construct various types of graphs. Pictograph Bar Graph Circle Graph Background
Year 6 Mathematics - Student Portfolio Summary
 Year 6 - Student Portfolio Summary WORK SAMPLE PORTFOLIOS These work sample portfolios have been designed to illustrate satisfactory achievement in the relevant aspects of the achievement standard. The
Diving Into Spending Plans Grade Level 7-9
 2.15.1 Diving Into Spending Plans Grade Level 7-9 Get Ready to Take Charge of Your Finances Time to complete: 60 minutes National Content Standards Family and Consumer Science Standards: 1.1.6, 2.1.1,
Section 1.1 Exercises (Solutions)
") Section 1.1 Exercises (Solutions) HW: 1.14, 1.16, 1.19, 1.21, 1.24, 1.25*, 1.31*, 1.33, 1.34, 1.35, 1.38*, 1.39, 1.41* 1.14 Employee application data. The personnel department keeps records on all employees
Section 1.1 Exercises (Solutions) HW: 1.14, 1.16, 1.19, 1.21, 1.24, 1.25*, 1.31*, 1.33, 1.34, 1.35, 1.38*, 1.39, 1.41* 1.14 Employee application data. The personnel department keeps records on all employees
This unit is designed to take place over 7-10, 45 minute class periods. Students should have working knowledge of the following skills:
 Title: How Will I Survive? Brief Overview: Middle school students need practical application to experience the ups and downs of finance that plays an integral part of our adult lives. Students will use
Five daily lessons. Page 23. Page 25. Page 29. Pages 31
 Unit 4 Fractions and decimals Five daily lessons Year 5 Spring term Unit Objectives Year 5 Order a set of fractions, such as 2, 2¾, 1¾, 1½, and position them on a number line. Relate fractions to division
Spreadsheets and Databases For Information Literacy
 Spreadsheets and Databases For Information Literacy What are students expected to do with data? Read & Interpret Collect, Analyze Make Predictions Compare & Contrast Describe Draw Conclusions Make Inferences
Mathematics standards
 Mathematics standards Grade 6 Summary of students performance by the end of Grade 6 Reasoning and problem solving Students represent and interpret routine and non-routine mathematical problems in a range
GRAPHS/TABLES. (line plots, bar graphs pictographs, line graphs)
") GRAPHS/TABLES (line plots, bar graphs pictographs, line graphs) Standard: 3.D.1.2 Represent data using tables and graphs (e.g., line plots, bar graphs, pictographs, and line graphs). Concept Skill: Graphs
GRAPHS/TABLES (line plots, bar graphs pictographs, line graphs) Standard: 3.D.1.2 Represent data using tables and graphs (e.g., line plots, bar graphs, pictographs, and line graphs). Concept Skill: Graphs
NEFE High School Financial Planning Program Unit Two Budgeting: Making the Most of Your Money. Unit 4 - Budgeting: Making the Most of Your Money
 Unit 4 - Budgeting: Making the Most of Your Money ? 2-A-1 Chart Recommendations Housing 30% Food 20% Clothing 10% Transportation 10% Savings 10% Misc. 20% 2-A-2 2-B-1 1 2 3 Some Money Facts The average
Name Date Class Period. How can you use the box method to factor a quadratic trinomial?
 Name Date Class Period Activity 9.6 Factoring Using the Box Method MATERIALS QUESTION EXPLORE 1 activity worksheet How can you use the box method to factor a quadratic trinomial? Factor 3x 2 + 16x + 5
Diagrams and Graphs of Statistical Data
 Diagrams and Graphs of Statistical Data One of the most effective and interesting alternative way in which a statistical data may be presented is through diagrams and graphs. There are several ways in
Lesson C3. page 1 of 3
 Lesson C page of Reality Check Career Exploration AND PORTALS TEKS Objectives. The student analyzes personal interests and aptitudes regarding education and career planning. The student is expected to:
Representing Data Using Frequency Graphs
 Lesson 25 Mathematics Assessment Project Formative Assessment Lesson Materials Representing Data Using Graphs MARS Shell Center University of Nottingham & UC Berkeley Alpha Version If you encounter errors
Getting started in Excel
 Getting started in Excel Disclaimer: This guide is not complete. It is rather a chronicle of my attempts to start using Excel for data analysis. As I use a Mac with OS X, these directions may need to be
Numeracy Targets. I can count at least 20 objects
 Targets 1c I can read numbers up to 10 I can count up to 10 objects I can say the number names in order up to 20 I can write at least 4 numbers up to 10. When someone gives me a small number of objects
LESSON 4 Missing Numbers in Multiplication Missing Numbers in Division LESSON 5 Order of Operations, Part 1 LESSON 6 Fractional Parts LESSON 7 Lines,
 Saxon Math 7/6 Class Description: Saxon mathematics is based on the principle of developing math skills incrementally and reviewing past skills daily. It also incorporates regular and cumulative assessments.
Math Common Core Sampler Test
 Math Common Core Sampler Test The grade 6 sampler covers the most common questions that we see on the Common Core tests and test samples. We have reviewed over 40 different past exams and samples to create
Middle School Interactive Websites
 Middle School Interactive Websites Math I Know That http://www.iknowthat.com This web site has interactive activities and games for pre-k-6 th grade. A great place to start is Leon s Math Dojo. It is great
Where is all the freshwater on Earth?
 Where is all the freshwater on Earth? Subject/ target grade: Middle School (8 th grade) Earth Science Duration: Three 50 minute period Setting: Classroom and computer lab Materials and Equipment Needed:
Grade 1 Level. Math Common Core Sampler Test
 Grade 1 Level Math Common Core Sampler Test This test has been compiled to give you a basic idea of the types of questions and formats that are being taken nationally. All the work is based on the Common
Equivalent Conversions
 Grades 6 8 Part 1 of 2 Poster/Teaching Guide Math Lessons & Worksheets to Build Skills in Equivalent Conversions Aligned with NCTM Standards Math Grants Available (details inside) Dear Teacher: Welcome
7.S.8 Interpret data to provide the basis for predictions and to establish
 7 th Grade Probability Unit 7.S.8 Interpret data to provide the basis for predictions and to establish experimental probabilities. 7.S.10 Predict the outcome of experiment 7.S.11 Design and conduct an
EXCEL Tutorial: How to use EXCEL for Graphs and Calculations.
 EXCEL Tutorial: How to use EXCEL for Graphs and Calculations. Excel is powerful tool and can make your life easier if you are proficient in using it. You will need to use Excel to complete most of your
TEKS TAKS 2010 STAAR RELEASED ITEM STAAR MODIFIED RELEASED ITEM
 7 th Grade Math TAKS-STAAR-STAAR-M Comparison Spacing has been deleted and graphics minimized to fit table. (1) Number, operation, and quantitative reasoning. The student represents and uses numbers in
Time needed. Before the lesson Assessment task:
 Formative Assessment Lesson Materials Alpha Version Beads Under the Cloud Mathematical goals This lesson unit is intended to help you assess how well students are able to identify patterns (both linear
Current Standard: Mathematical Concepts and Applications Shape, Space, and Measurement- Primary
 Shape, Space, and Measurement- Primary A student shall apply concepts of shape, space, and measurement to solve problems involving two- and three-dimensional shapes by demonstrating an understanding of:
Assessment Support. This guide explores envisionmath Texas 2.0 assessment support.
 Assessment Support Introduction This guide explores envisionmath Texas 2.0 assessment support. Placement Test It examines the variety of formal and informal assessments built into the program, explains
CAMI Education linked to CAPS: Mathematics
 - 1 - TOPIC 1.1 Whole numbers _CAPS curriculum TERM 1 CONTENT Mental calculations Revise: Multiplication of whole numbers to at least 12 12 Ordering and comparing whole numbers Revise prime numbers to
Convert between units of area and determine the scale factor of two similar figures.
 CHAPTER 5 Units of Area c GOAL Convert between units of area and determine the scale factor of two. You will need a ruler centimetre grid paper a protractor a calculator Learn about the Math The area of
Algebra II EOC Practice Test
 Algebra II EOC Practice Test Name Date 1. Suppose point A is on the unit circle shown above. What is the value of sin? (A) 0.736 (B) 0.677 (C) (D) (E) none of these 2. Convert to radians. (A) (B) (C) (D)
Turn Off TV Turn On the Possibilities. TV Turn-Off Week. What is TV Turn-Off Week?
 Turn Off TV Turn On the Possibilities TV Turn-Off Week I really didn t like TV Turn-off week except I did notice that my grades went up and I was in a good mood all week Drew Henderson, 2 nd Grader, Pennsylvania
Fun with Fractions: A Unit on Developing the Set Model: Unit Overview www.illuminations.nctm.org
 Fun with Fractions: A Unit on Developing the Set Model: Unit Overview www.illuminations.nctm.org Number of Lessons: 7 Grades: 3-5 Number & Operations In this unit plan, students explore relationships among
Probability and Statistics
 Activity: TEKS: Overview: Problems Kids Care About (K.12) Probability and statistics. The student constructs and uses graphs of real objects or pictures to answer questions. The student is expected to:
Teens and Budgeting. { http://youth.macu.com }
 Teens and Budgeting { http://youth.macu.com } Mountain America Credit Union knows that it s never too early to start learning critical money management skills. That s why we ve put this information together
Fractions as Numbers INTENSIVE INTERVENTION. National Center on. at American Institutes for Research
 National Center on INTENSIVE INTERVENTION at American Institutes for Research Fractions as Numbers 000 Thomas Jefferson Street, NW Washington, DC 0007 E-mail: [email protected] While permission to reprint this
Data Analysis Tools. Tools for Summarizing Data
 Data Analysis Tools This section of the notes is meant to introduce you to many of the tools that are provided by Excel under the Tools/Data Analysis menu item. If your computer does not have that tool
This document contains Chapter 2: Statistics, Data Analysis, and Probability strand from the 2008 California High School Exit Examination (CAHSEE):
:") This document contains Chapter 2:, Data Analysis, and strand from the 28 California High School Exit Examination (CAHSEE): Mathematics Study Guide published by the California Department of Education. The
This document contains Chapter 2:, Data Analysis, and strand from the 28 California High School Exit Examination (CAHSEE): Mathematics Study Guide published by the California Department of Education. The
Chapter 1: Data and Statistics GBS221, Class 20640 January 28, 2013 Notes Compiled by Nicolas C. Rouse, Instructor, Phoenix College
 Chapter Objectives 1. Obtain an appreciation for the breadth of statistical applications in business and economics. 2. Understand the meaning of the terms elements, variables, and observations as they
Adding and Subtracting
 Positive and Negative Integers 1 A 7 th Grade Unit on Adding and Subtracting Positive and Negative Integers Developed by: Nicole Getman December 1, 2006 Buffalo State: I 2 T 2 Positive and Negative Integers
What qualities are employers looking for in teen workers? How can you prove your own skills?
 Sell Yourself 4 Finding a job The BIG Idea What qualities are employers looking for in teen workers? How can you prove your own skills? AGENDA Approx. 45 minutes I. Warm Up: Employer Survey Review (15
1. The principal asked each classroom to report the number of bags of newspapers collected for the recycling project. Bags of Newspapers Collected
 . The principal asked each classroom to report the number of bags of newspapers collected for the recycling project. ags of Newspapers ollected. Professor Smith is doing a study on the number of geese
Saving and Creating a Personal Budget
 Grade Five Saving and Creating a Personal Budget Overview Students share several chapters of the book From the Mixed-Up Files of Mrs. Basil E. Frankweiler, by E.L. Konigsburg, to learn about the role of
Consultant: Lynn T. Havens. Director of Project CRISS Kalispell, Montana
 Teacher Annotated Edition Study Notebook Consultant: Lynn T. Havens SM Director of Project CRISS Kalispell, Montana i_sn_c1fmtwe_893629.indd i 3/16/09 9:17:03 PM Copyright by The McGraw-Hill Companies,
Media. Copyright 2005 Literacy Volunteers of DuPage
 Media INTRODUCTION Before tutors and students can begin planning lessons, goals need to be set according to those expressed by the student and his/her existing level of English. Once the goals have been