Fundamentals of modern UV-visible spectroscopy. Presentation Materials
|
|
|
- Augusta Smith
- 9 years ago
- Views:
Transcription
1 Fundamentals of modern UV-visible spectroscopy Presentation Materials

2 The Electromagnetic Spectrum E = hν ν = c / λ 1

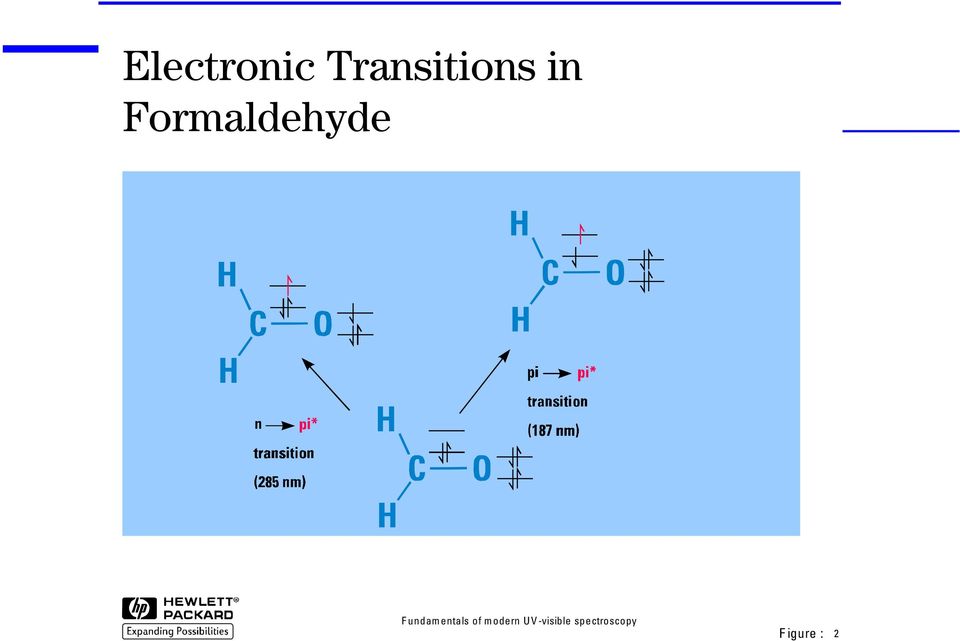
3 Electronic Transitions in Formaldehyde 2
4 Electronic Transitions and Spectra of Atoms 3

5 Electronic Transitions and UV-visible Spectra in Molecules 4

6 Derivative Spectra of a Gaussian Absorbance Band Absorbance: A = f (λ) 1st Derivative: da = dλ f ( λ) 2nd Derivative: 2 d A 2 dλ = f ( λ) 5

7 Resolution Enhancement Overlay of 2 Gaussian bands with a NBW of 40 nm separated by 30 nm Separated by 4th derivative 6

8 Transmission and Color The human eye sees the complementary color to that which is absorbed 7

9 Absorbance and Complementary Colors 8

10 Transmittance and Concentration The Bouguer-Lambert Law T = I / I0 = e Const Pathlength 9

11 Transmittance and Path Length Beer s Law Concentration T = I / I0 = e Const Concentration 10

12 The Beer-Bouguer-Lambert Law A ( I / I ) = log( I / I) = b c = log T = log 0 0 ε 11
 = b c =")
13 Two-Component Mixture Example of a two-component mixture with little spectral overlap 12

14 Two-Component Mixture Example of a two-component mixture with significant spectral overlap 13

15 Influence of 10% Random Error Influence on the calculated concentrations Little spectral overlap: 10% Error Significant spectral overlap: Depends on similarity, can be much higher (e.g. 100%) 14
 14")
16 Absorption Spectra of Hemoglobin Derivatives 15

17 Intensity Spectrum of the Deuterium Arc Lamp Good intensity in UV range Useful intensity in visible range Low noise Intensity decreases over lifetime 16

18 Intensity Spectrum of the Tungsten- Halogen Lamp Weak intensity in UV range Good intensity in visible range Very low noise Low drift 17

19 Intensity Spectrum of the Xenon Lamp High intensity in UV range High intensity in visible range Medium noise 18

20 Dispersion Devices Non-linear dispersion Temperature sensitive Linear Dispersion Different orders 19

21 Photomultiplier Tube Detector High sensitivity at low light levels Cathode material determines spectral sensitivity Good signal/noise Shock sensitive Anode 20
22 The Photodiode Detector Wide dynamic range Very good signal/noise at high light levels Solid-state device 21
23 Schematic Diagram of a Photodiode Array Same characteristics as photodiodes Solid-state device Fast read-out cycles 22
24 Conventional Spectrophotometer Schematic of a conventional single-beam spectrophotometer 23
25 Diode-Array Spectrophotometer Schematic of a diode-array spectrophotometer 24
26 Diode-Array Spectrophotometer Optical diagram of the HP 8453 diode-array spectrophotometer 25
27 Conventional Spectrophotometer Optical system of a double-beam spectrophotometer 26
28 Diode-Array Spectrophotometer Optical system of the HP 8450A diode-array spectrophotometer 27
29 Conventional Spectrophotometer Optical system of a split-beam spectrophotometer 28
30 Definition of Resolution Spectral resolution is a measure of the ability of an instrument to differentiate between two adjacent wavelengths 29
31 Instrumental Spectral Bandwidth The SBW is defined as the width, at half the maximum intensity, of the band of light leaving the monochromator 30
32 Natural Spectral Bandwidth The NBW is the width of the sample absorption band at half the absorption maximum 31
33 Effect of SBW on Band Shape The SBW/NBW ratio should be 0.1 or better to yield an absorbance measurement with an accuracy of 99.5% or better 32
34 Effect of Digital Sampling The sampling interval used to digitize the spectrum for computer evaluation and storage also effects resolution 33
35 Wavelength Resettability Influence of wavelength resettability on measurements at the maximum and slope of an absorption band 34
36 Effect of Stray Light Effect of various levels of stray light on measured absorbance compared with actual absorbance 35
37 Theoretical Absorbance Error The total error at any absorbance is the sum of the errors due to stray light and noise (photon noise and electronic noise) 36
38 Effect of Drift Drift is a potential cause of photometric error and results from variations between the measurement of I 0 and I 37
39 Transmission Characteristics of Cell Materials Note that all materials exhibit at least approximately 10% loss in transmittance at all wavelengths 38
40 Cell Types I Open-topped rectangular standard cell (a) and apertured cell (b) for limited sample volume 39
41 Cell Types II Micro cell (a) for very small volumes and flow-through cell (b) for automated applications 40
42 Effect of Refractive Index Changes in the refractive index of reference and sample measurement can cause wrong absorbance measurements 41
43 Non-planar Sample Geometry Some sample can act as an active optical component in the system and deviate or defocus the light beam 42
44 Effect of Integration Time Averaging of data points reduces noise by the square root of the number of points averaged 43
45 Effect of Wavelength Averaging Wavelength averaging reduces also the noise (square root of data points) Amplitude of the signal is affected 44
46 Increasing Dynamic Range Selection of a wavelength in the slope of a absorption band can increase the dynamic range and avoid sample preparation like dilution 45
47 Scattering Scattering causes an apparent absorbance because less light reaches the detector 46
48 Scatter Spectra Rayleigh scattering: Tyndall scattering: Particles small relative to wavelength Particles large relative to wavelength 47
49 Isoabsorbance Corrections Absorbance at the reference wavelength must be equivalent to the interference at the analytical wavelength 48
50 Background Modeling Background modeling can be done if the interference is due to a physical process 49
51 Internal Referencing Corrects for constant background absorbance over a range 50
52 Three-Point Correction Uses two reference wavelengths Corrects for sloped linear background absorbance 51
53 Discrimination of Broad Bands Derivatives can eliminate background absorption Derivatives discriminate against broad absorbance bands 52
54 Scatter Correction by Derivative Spectroscopy Scatter is discriminated like a broad-band absorbance band 53
55 Effect of Fluorescence The emitted light of a fluorescing sample causes an error in the absorbance measurement 54
56 Acceptance Angles and Magnitude of Fluorescence Error Forward optics: Absorbance at the excitation wavelengths are too low Reversed optics: Absorbance at the emission wavelengths are too low 55
57 Inadequate Calibration Theoretically only one standard is required to calibrate In practice, deviations from Beer s law can cause wrong results 56
58 Calibration Data Sets Forward optics: Reversed optics: Absorbance at the excitation wavelengths are too low Absorbance at the emission wavelengths are too low 57
59 Wavelength(s) for Best Linearity A linear calibration curve is calculated at each wavelength The correlation coefficient gives an estimate on the linearity 58
60 Wavelength(s) for Best Accuracy The quantification results are calculated at each wavelength The calculated concentration are giving an estimate of the accuracy 59
61 Precision of an Analysis Precision of a method is the degree of agreement among individual test results when the procedure is applied repeatedly to multiple samplings 60
62 Wavelength(s) for Best Sensitivity Calculation of relative standard deviation of the measured values at each wavelength The wavelength with lowest %RSD likely will yield the best sensitivity 61
63 Wavelength(s) for Best Selectivity Selectivity is the ability of a method to quantify accurately and specifically the analyte or analytes in the presence of other compounds 62
64 Ideal Absorbance and Wavelength Standards An ideal absorbance standard would have a constant absorbance at all wavelengths An ideal wavelength standard would have very narrow, well-defined peaks 63
65 Ideal Stray Light Filter An ideal stray light filter would transmit all wavelengths except the wavelength used to measure the stray light 64
66 Holmium Perchlorate Solution The most common wavelength accuracy standard is a holmium perchlorate solution 65
67 Potassium Dichromate Solution The photometric accuracy standard required by several pharmacopoeias is a potassium dichromate solution 66
68 Stray Light Standard Solutions The most common stray light standard and the respectively used wavelengths 67
69 Toluene in Hexane (0.02% v/v) The resolution is estimated by taking the ratio of the absorbance of the maximum near 269 nm and minimum near 266 nm 68
70 Confirmation Analysis In confirmation analysis, the absorbance at one or more additional wavelengths are used to quantify a sample 69
71 Spectral Similarity Comparative plots of similar and dissimilar spectra 70
72 Precision and Accuracy Precision Precision + Precision Precision + Accuracy Accuracy Accuracy + Accuracy + 71
73 Hydrolysis of Sultone Absorbance [AU] Wavelength [nm] 72
Problem Set 6 UV-Vis Absorption Spectroscopy. 13-1. Express the following absorbances in terms of percent transmittance:
 Problem Set 6 UV-Vis Absorption Spectroscopy 13-1. Express the following absorbances in terms of percent transmittance: a 0.051 b 0.918 c 0.379 d 0.261 e 0.485 f 0.072 A = log P o /P = log1/t = - log T
Spectroscopy. Biogeochemical Methods OCN 633. Rebecca Briggs
 Spectroscopy Biogeochemical Methods OCN 633 Rebecca Briggs Definitions of Spectrometry Defined by the method used to prepare the sample 1. Optical spectrometry Elements are converted to gaseous atoms or
Uses of Derivative Spectroscopy
 Uses of Derivative Spectroscopy Application Note UV-Visible Spectroscopy Anthony J. Owen Derivative spectroscopy uses first or higher derivatives of absorbance with respect to wavelength for qualitative
EXPERIMENT 11 UV/VIS Spectroscopy and Spectrophotometry: Spectrophotometric Analysis of Potassium Permanganate Solutions.
 EXPERIMENT 11 UV/VIS Spectroscopy and Spectrophotometry: Spectrophotometric Analysis of Potassium Permanganate Solutions. Outcomes After completing this experiment, the student should be able to: 1. Prepare
UV/VIS/IR SPECTROSCOPY ANALYSIS OF NANOPARTICLES
 UV/VIS/IR SPECTROSCOPY ANALYSIS OF NANOPARTICLES SEPTEMBER 2012, V 1.1 4878 RONSON CT STE K SAN DIEGO, CA 92111 858-565 - 4227 NANOCOMPOSIX.COM Note to the Reader: We at nanocomposix have published this
Copyright 1999 2010 by Mark Brandt, Ph.D. 12
 Introduction to Absorbance Spectroscopy A single beam spectrophotometer is comprised of a light source, a monochromator, a sample holder, and a detector. An ideal instrument has a light source that emits
Experiment #5: Qualitative Absorption Spectroscopy
 Experiment #5: Qualitative Absorption Spectroscopy One of the most important areas in the field of analytical chemistry is that of spectroscopy. In general terms, spectroscopy deals with the interactions
Reprint (R22) Avoiding Errors in UV Radiation Measurements. By Thomas C. Larason July 2001. Reprinted from Photonics Spectra, Laurin Publishing
 Avoiding Errors in UV Radiation Measurements. By Thomas C. Larason July 2001. Reprinted from Photonics Spectra, Laurin Publishing") Reprint (R22) Avoiding Errors in UV Radiation Measurements By Thomas C. Larason July 2001 Reprinted from Photonics Spectra, Laurin Publishing Gooch & Housego 4632 36 th Street, Orlando, FL 32811 Tel: 1
Reprint (R22) Avoiding Errors in UV Radiation Measurements By Thomas C. Larason July 2001 Reprinted from Photonics Spectra, Laurin Publishing Gooch & Housego 4632 36 th Street, Orlando, FL 32811 Tel: 1
Agilent Cary 4000/5000/6000i Series UV-Vis-NIR
 Agilent Cary 4000/5000/6000i Series UV-Vis-NIR Guaranteed specifications Design overview Double beam, ratio recording, double out-of-plane Littrow monochromator UV-Vis-NIR spectrophotometer (Agilent Cary
Spectrophotometry and the Beer-Lambert Law: An Important Analytical Technique in Chemistry
 Spectrophotometry and the Beer-Lambert Law: An Important Analytical Technique in Chemistry Jon H. Hardesty, PhD and Bassam Attili, PhD Collin College Department of Chemistry Introduction: In the last lab
INTERNATIONAL OLIVE COUNCIL
 INTERNATIONAL OLIVE COUNCIL COI/T.20/Doc. No 19/Rev. 3 February 2015 ENGLISH Original: ENGLISH Príncipe de Vergara, 154 28002 Madrid España Telef.: +34 915 903 638 Fax: +34 915 631 263 - e-mail: [email protected]
Molecular Spectroscopy
 Molecular Spectroscopy UV-Vis Spectroscopy Absorption Characteristics of Some Common Chromophores UV-Vis Spectroscopy Absorption Characteristics of Aromatic Compounds UV-Vis Spectroscopy Effect of extended
Chemistry 111 Lab: Intro to Spectrophotometry Page E-1
 Chemistry 111 Lab: Intro to Spectrophotometry Page E-1 SPECTROPHOTOMETRY Absorption Measurements & their Application to Quantitative Analysis study of the interaction of light (or other electromagnetic
3 - Atomic Absorption Spectroscopy
 3 - Atomic Absorption Spectroscopy Introduction Atomic-absorption (AA) spectroscopy uses the absorption of light to measure the concentration of gas-phase atoms. Since samples are usually liquids or solids,
instruments Analytical Instruments for Science
 instruments Analytical Instruments for Science instruments Contents PAGE NO. Introduction 4 T60 UV-Vis Spectrophotometer 6 T70 UV-Vis Spectrophotometer 10 T80 UV-Vis Spectrophotometer 14 T90+ UV-Vis Spectrophotometer
FTIR Instrumentation
 FTIR Instrumentation Adopted from the FTIR lab instruction by H.-N. Hsieh, New Jersey Institute of Technology: http://www-ec.njit.edu/~hsieh/ene669/ftir.html 1. IR Instrumentation Two types of instrumentation
GRID AND PRISM SPECTROMETERS
 FYSA230/2 GRID AND PRISM SPECTROMETERS 1. Introduction Electromagnetic radiation (e.g. visible light) experiences reflection, refraction, interference and diffraction phenomena when entering and passing
Hellma. Where precision becomes an art. Calibration standards for spectrophotometers. 2008 by Hellma www.hellma-worldwide.com
 Hellma. Where precision becomes an art. Calibration standards for spectrophotometers 2008 by Hellma www.hellma-worldwide.com Contents Calibration of spectrophotometers 3 Traceability of the calibration
Raman Spectroscopy Basics
 Raman Spectroscopy Basics Introduction Raman spectroscopy is a spectroscopic technique based on inelastic scattering of monochromatic light, usually from a laser source. Inelastic scattering means that
SPECTROSCOPY. Light interacting with matter as an analytical tool
 SPECTROSCOPY Light interacting with matter as an analytical tool Electronic Excitation by UV/Vis Spectroscopy : X-ray: core electron excitation UV: valance electronic excitation IR: molecular vibrations
Application Note: Absorbance
 Units Units Theory of absorbance Light absorption occurs when atoms or molecules take up the energy of a photon of light, thereby reducing the transmission of light as it is passed through a sample. Light
2 Spectrophotometry and the Analysis of Riboflavin
 2 Spectrophotometry and the Analysis of Riboflavin Objectives: A) To become familiar with operating the Platereader; B) to learn how to use the Platereader in determining the absorption spectrum of a compound
Module 13 : Measurements on Fiber Optic Systems
 Module 13 : Measurements on Fiber Optic Systems Lecture : Measurements on Fiber Optic Systems Objectives In this lecture you will learn the following Measurements on Fiber Optic Systems Attenuation (Loss)
MCAL Spectrophotometry. Spectrophotometry
 MCAL Spectrophotometry Instruments include: Cary 50 UV-vis Spectrophotometer Eclipse Spectrofluorometer HPLC Diode Array and Fluorescence ICP-OES with CCD detection Spectrophotometry The instruments all
High-Concentration Submicron Particle Size Distribution by Dynamic Light Scattering
 High-Concentration Submicron Particle Size Distribution by Dynamic Light Scattering Power spectrum development with heterodyne technology advances biotechnology and nanotechnology measurements. M. N. Trainer
Reaction Stoichiometry and the Formation of a Metal Ion Complex
 Reaction Stoichiometry and the Formation of a Metal Ion Complex Objectives The objectives of this laboratory are as follows: To use the method of continuous variation to determine the reaction stoichiometry
Fiber Optic Sampling by UV/Vis and UV/Vis/NIR Spectroscopy
 Fiber Optic Sampling by UV/Vis and UV/Vis/NIR Spectroscopy UV/VIS AND UV/VIS/NIR SPECTROSCOPY A P P L I C A T I O N N O T E Introduction The availability and applications of fiber optic sampling in UV/Vis
Lab #11: Determination of a Chemical Equilibrium Constant
 Lab #11: Determination of a Chemical Equilibrium Constant Objectives: 1. Determine the equilibrium constant of the formation of the thiocyanatoiron (III) ions. 2. Understand the application of using a
Introduction to Fourier Transform Infrared Spectrometry
 Introduction to Fourier Transform Infrared Spectrometry What is FT-IR? I N T R O D U C T I O N FT-IR stands for Fourier Transform InfraRed, the preferred method of infrared spectroscopy. In infrared spectroscopy,
Ultraviolet-Visible (UV-Vis) Spectroscopy Background Information
 Spectroscopy Background Information") 1 Ultraviolet-Visible (UV-Vis) Spectroscopy Background Information Instructions for the Operation of the Cary 300 Bio UV-Visible Spectrophotometer See the Thermo OMNIC Help reference on page 49. Ultraviolet-Visible
1 Ultraviolet-Visible (UV-Vis) Spectroscopy Background Information Instructions for the Operation of the Cary 300 Bio UV-Visible Spectrophotometer See the Thermo OMNIC Help reference on page 49. Ultraviolet-Visible
Improved predictive modeling of white LEDs with accurate luminescence simulation and practical inputs
 Improved predictive modeling of white LEDs with accurate luminescence simulation and practical inputs TracePro Opto-Mechanical Design Software s Fluorescence Property Utility TracePro s Fluorescence Property
Austin Peay State University Department of Chemistry Chem 1111. The Use of the Spectrophotometer and Beer's Law
 Purpose To become familiar with using a spectrophotometer and gain an understanding of Beer s law and it s relationship to solution concentration. Introduction Scientists use many methods to determine
where h = 6.62 10-34 J s
 Electromagnetic Spectrum: Refer to Figure 12.1 Molecular Spectroscopy: Absorption of electromagnetic radiation: The absorptions and emissions of electromagnetic radiation are related molecular-level phenomena
Validation and Calibration of Analytical Instruments a D.Gowrisankar, b K.Abbulu, c O.Bala Souri, K.Sujana*
 Validation and Calibration of Analytical Instruments a D.Gowrisankar, b K.Abbulu, c O.Bala Souri, K.Sujana* a Department of Pharmaceutical Analysis, Andhra University, Visakhapatnam. b Department of Pharmaceutics,
HPLC Analysis of Acetaminophen Tablets with Waters Alliance and Agilent Supplies
 HPLC Analysis of Acetaminophen Tablets with Waters Alliance and Agilent Supplies Application Note Small Molecule Pharmaceuticals Authors Jignesh Shah, Tiantian Li, and Anil Sharma Agilent Technologies,
Radiation Transfer in Environmental Science
 Radiation Transfer in Environmental Science with emphasis on aquatic and vegetation canopy media Autumn 2008 Prof. Emmanuel Boss, Dr. Eyal Rotenberg Introduction Radiation in Environmental sciences Most
What s in the Mix? Liquid Color Spectroscopy Lab (Randy Landsberg & Bill Fisher)
") What s in the Mix? Liquid Color Spectroscopy Lab (Randy Landsberg & Bill Fisher) Introduction: There is more to a color than a name. Color can tell us lots of information. In this lab you will use a spectrophotometer
What s in the Mix? Liquid Color Spectroscopy Lab (Randy Landsberg & Bill Fisher) Introduction: There is more to a color than a name. Color can tell us lots of information. In this lab you will use a spectrophotometer
Graphite Furnace AA, Page 1 DETERMINATION OF METALS IN FOOD SAMPLES BY GRAPHITE FURNACE ATOMIC ABSORPTION SPECTROSCOPY (VERSION 1.
 Graphite Furnace AA, Page 1 DETERMINATION OF METALS IN FOOD SAMPLES BY GRAPHITE FURNACE ATOMIC ABSORPTION SPECTROSCOPY I. BACKGROUND (VERSION 1.0) Atomic absorption spectroscopy (AAS) is a widely used
Experiment 5. Lasers and laser mode structure
 Northeastern University, PHYS5318 Spring 2014, 1 1. Introduction Experiment 5. Lasers and laser mode structure The laser is a very important optical tool that has found widespread use in science and industry,
Amptek Application Note XRF-1: XRF Spectra and Spectra Analysis Software By R.Redus, Chief Scientist, Amptek Inc, 2008.
 Amptek Application Note XRF-1: XRF Spectra and Spectra Analysis Software By R.Redus, Chief Scientist, Amptek Inc, 2008. X-Ray Fluorescence (XRF) is a very simple analytical technique: X-rays excite atoms
Trace Gas Exchange Measurements with Standard Infrared Analyzers
 Practical Environmental Measurement Methods Trace Gas Exchange Measurements with Standard Infrared Analyzers Last change of document: February 23, 2007 Supervisor: Charles Robert Room no: S 4381 ph: 4352
UV-VISIBLE SPECTROPHOTOMETER
 instruments UV-VISIBLE SPECTROPHOTOMETER PRODUCT BROCHURE Analytical Instruments for Science Contents PAGE NO. Introduction 4 T60 UV-Vis Spectrophotometer 6 T70 UV-Vis Spectrophotometer 10 T80 UV-Vis Spectrophotometer
Solar Energy. Outline. Solar radiation. What is light?-- Electromagnetic Radiation. Light - Electromagnetic wave spectrum. Electromagnetic Radiation
 Outline MAE 493R/593V- Renewable Energy Devices Solar Energy Electromagnetic wave Solar spectrum Solar global radiation Solar thermal energy Solar thermal collectors Solar thermal power plants Photovoltaics
Ultraviolet Spectroscopy
 Ultraviolet Spectroscopy The wavelength of UV and visible light are substantially shorter than the wavelength of infrared radiation. The UV spectrum ranges from 100 to 400 nm. A UV-Vis spectrophotometer
QUANTITATIVE INFRARED SPECTROSCOPY. Willard et. al. Instrumental Methods of Analysis, 7th edition, Wadsworth Publishing Co., Belmont, CA 1988, Ch 11.
 QUANTITATIVE INFRARED SPECTROSCOPY Objective: The objectives of this experiment are: (1) to learn proper sample handling procedures for acquiring infrared spectra. (2) to determine the percentage composition
The Measurement of Sensitivity in Fluorescence Spectroscopy
 The Measurement of Sensitivity in Fluorescence Spectroscopy Among instrumental techniques, fluorescence spectroscopy is recognized as one of the more sensitive. In fluorescence, the intensity of the emission
VWR SPECTROPHOTOMETERS
 VWR SPECTROPHOTOMETERS Reliable Accurate Easy to Use New_Spectrophotometry_v2.indd 2 Your first choice for spectrophotometry 5/9/2014 2:22:18 PM Quality Guaranteed VWR SPECTROPHOTOMETERS Single Beam Units
Chem 131A: Absorbance of Riboflavin
 Chem 131A: Absorbance of Riboflavin Purpose: The purpose of this experiment is to: 1) Familiarize the student with the use of the HP 8452 diode array spectrophotometer, 2) examine the limitations of the
Upon completion of this lab, the student will be able to:
 1 Learning Outcomes EXPERIMENT B4: CHEMICAL EQUILIBRIUM Upon completion of this lab, the student will be able to: 1) Analyze the absorbance spectrum of a sample. 2) Calculate the equilibrium constant for
Raman spectroscopy Lecture
 Raman spectroscopy Lecture Licentiate course in measurement science and technology Spring 2008 10.04.2008 Antti Kivioja Contents - Introduction - What is Raman spectroscopy? - The theory of Raman spectroscopy
Electromagnetic Radiation (EMR) and Remote Sensing
 and Remote Sensing") Electromagnetic Radiation (EMR) and Remote Sensing 1 Atmosphere Anything missing in between? Electromagnetic Radiation (EMR) is radiated by atomic particles at the source (the Sun), propagates through
Electromagnetic Radiation (EMR) and Remote Sensing 1 Atmosphere Anything missing in between? Electromagnetic Radiation (EMR) is radiated by atomic particles at the source (the Sun), propagates through
UV-Visible Spectroscopy
 UV-Visible Spectroscopy UV-Visible Spectroscopy What is UV-Visible Spectroscopy? Molecular spectroscopy that involves study of the interaction of Ultra violet (UV)-Visible radiation with molecules What
Spectroscopic Methods
 Chapter 10 Spectroscopic Methods Chapter Overview Section 10A Overview of Spectroscopy Section 10B Spectroscopy Based on Absorption Section 10C UV/Vis and IR Spectroscopy Section 10D Atomic Absorption
2 Absorbing Solar Energy
 2 Absorbing Solar Energy 2.1 Air Mass and the Solar Spectrum Now that we have introduced the solar cell, it is time to introduce the source of the energy the sun. The sun has many properties that could
ATOMIC SPECTRA. Apparatus: Optical spectrometer, spectral tubes, power supply, incandescent lamp, bottles of dyed water, elevating jack or block.
 1 ATOMIC SPECTRA Objective: To measure the wavelengths of visible light emitted by atomic hydrogen and verify the measured wavelengths against those predicted by quantum theory. To identify an unknown
Specifying Plasma Deposited Hard Coated Optical Thin Film Filters. Alluxa Engineering Staff
 Specifying Plasma Deposited Hard Coated Optical Thin Film Filters. Alluxa Engineering Staff December 2012 Specifying Advanced Plasma Deposited Hard Coated Optical Bandpass and Dichroic Filters. Introduction
The Fundamentals of Infrared Spectroscopy. Joe Van Gompel, PhD
 TN-100 The Fundamentals of Infrared Spectroscopy The Principles of Infrared Spectroscopy Joe Van Gompel, PhD Spectroscopy is the study of the interaction of electromagnetic radiation with matter. The electromagnetic
SPECTROPHOTOMETRIC MEASUREMENTS TECHNIQUES FOR FERMENTATION PROCESS BASE THEORY FOR UV-VIS SPECTROPHOTOMETRIC MEASUREMENTS
 SPECTROPHOTOMETRIC MEASUREMENTS TECHNIQUES FOR FERMENTATION PROCESS (PART ONE) BASE THEORY FOR UV-VIS SPECTROPHOTOMETRIC MEASUREMENTS INTERNAL REPORT 2012 Filip Monica Sanda, Macocian Eugen Victor, Toderaş
A Beer s Law Experiment
 A Beer s Law Experiment Introduction There are many ways to determine concentrations of a substance in solution. So far, the only experiences you may have are acid-base titrations or possibly determining
Time out states and transitions
 Time out states and transitions Spectroscopy transitions between energy states of a molecule excited by absorption or emission of a photon hn = DE = E i - E f Energy levels due to interactions between
EDXRF of Used Automotive Catalytic Converters
 EDXRF of Used Automotive Catalytic Converters Energy Dispersive X-Ray Fluorescence (EDXRF) is a very powerful technique for measuring the concentration of elements in a sample. It is fast, nondestructive,
Preview of Period 3: Electromagnetic Waves Radiant Energy II
 Preview of Period 3: Electromagnetic Waves Radiant Energy II 3.1 Radiant Energy from the Sun How is light reflected and transmitted? What is polarized light? 3.2 Energy Transfer with Radiant Energy How
Recording the Instrument Response Function of a Multiphoton FLIM System
 Recording the Instrument Response Function of a Multiphoton FLIM System Abstract. FLIM data analysis in presence of SHG signals or extremely fast decay components requires the correct instrument response
Lecture 1: Basic Concepts on Absorption and Fluorescence
 Lecture 1: Basic Concepts on Absorption and Fluorescence Nicholas G. James Cell and Molecular Biology University of Hawaii at Manoa, Honolulu The Goal The emission of light after absorption of an outside
Calibration of a High Dynamic Range, Low Light Level Visible Source
 Calibration of a High Dynamic Range, Low Light Level Visible Source Joe LaVeigne a, Todd Szarlan a, Nate Radtke a a Santa Barbara Infrared, Inc., 30 S. Calle Cesar Chavez, #D, Santa Barbara, CA 93103 ABSTRACT
Lectures about XRF (X-Ray Fluorescence)
") 1 / 38 Lectures about XRF (X-Ray Fluorescence) Advanced Physics Laboratory Laurea Magistrale in Fisica year 2013 - Camerino 2 / 38 X-ray Fluorescence XRF is an acronym for X-Ray Fluorescence. The XRF technique
1 / 38 Lectures about XRF (X-Ray Fluorescence) Advanced Physics Laboratory Laurea Magistrale in Fisica year 2013 - Camerino 2 / 38 X-ray Fluorescence XRF is an acronym for X-Ray Fluorescence. The XRF technique
Katharina Lückerath (AG Dr. Martin Zörnig) adapted from Dr. Jörg Hildmann BD Biosciences,Customer Service
 adapted from Dr. Jörg Hildmann BD Biosciences,Customer Service") Introduction into Flow Cytometry Katharina Lückerath (AG Dr. Martin Zörnig) adapted from Dr. Jörg Hildmann BD Biosciences,Customer Service How does a FACS look like? FACSCalibur FACScan What is Flow Cytometry?
Introduction into Flow Cytometry Katharina Lückerath (AG Dr. Martin Zörnig) adapted from Dr. Jörg Hildmann BD Biosciences,Customer Service How does a FACS look like? FACSCalibur FACScan What is Flow Cytometry?
The photoionization detector (PID) utilizes ultraviolet
 utilizes ultraviolet") Chapter 6 Photoionization Detectors The photoionization detector (PID) utilizes ultraviolet light to ionize gas molecules, and is commonly employed in the detection of volatile organic compounds (VOCs).
Chapter 6 Photoionization Detectors The photoionization detector (PID) utilizes ultraviolet light to ionize gas molecules, and is commonly employed in the detection of volatile organic compounds (VOCs).
Chapter 28: High-Performance Liquid Chromatography (HPLC)
") Chapter 28: High-Performance Liquid Chromatography (HPLC) Scope Instrumentation eluants, injectors, columns Modes of HPLC Partition chromatography Adsorption chromatography Ion chromatography Size exclusion
Chapter 28: High-Performance Liquid Chromatography (HPLC) Scope Instrumentation eluants, injectors, columns Modes of HPLC Partition chromatography Adsorption chromatography Ion chromatography Size exclusion
Raman Scattering Theory David W. Hahn Department of Mechanical and Aerospace Engineering University of Florida ([email protected])
") Introduction Raman Scattering Theory David W. Hahn Department of Mechanical and Aerospace Engineering University of Florida ([email protected]) The scattering of light may be thought of as the redirection
Introduction Raman Scattering Theory David W. Hahn Department of Mechanical and Aerospace Engineering University of Florida ([email protected]) The scattering of light may be thought of as the redirection
Optical Communications
 Optical Communications Telecommunication Engineering School of Engineering University of Rome La Sapienza Rome, Italy 2005-2006 Lecture #2, May 2 2006 The Optical Communication System BLOCK DIAGRAM OF
Using the Spectrophotometer
 Using the Spectrophotometer Introduction In this exercise, you will learn the basic principals of spectrophotometry and and serial dilution and their practical application. You will need these skills to
Validating UV/Visible Spectrophotometers
 Technical Note Validating UV/Visible Spectrophotometers UV/Vis Spectroscopy UV/Visible spectrophotometers are widely used by many laboratories including those found in academia and research as well as
ICH Topic Q 2 (R1) Validation of Analytical Procedures: Text and Methodology. Step 5
 Validation of Analytical Procedures: Text and Methodology. Step 5") European Medicines Agency June 1995 CPMP/ICH/381/95 ICH Topic Q 2 (R1) Validation of Analytical Procedures: Text and Methodology Step 5 NOTE FOR GUIDANCE ON VALIDATION OF ANALYTICAL PROCEDURES: TEXT AND
European Medicines Agency June 1995 CPMP/ICH/381/95 ICH Topic Q 2 (R1) Validation of Analytical Procedures: Text and Methodology Step 5 NOTE FOR GUIDANCE ON VALIDATION OF ANALYTICAL PROCEDURES: TEXT AND
Clinical Laboratory Instrumentation
 Clinical Laboratory Instrumentation Responsible for analyzing patient specimens to provide information to aid in diagnosis of disease to evaluate effectiveness of therapy Major sections: Chemistry lab
VALIDATION OF ANALYTICAL PROCEDURES: TEXT AND METHODOLOGY Q2(R1)
") INTERNATIONAL CONFERENCE ON HARMONISATION OF TECHNICAL REQUIREMENTS FOR REGISTRATION OF PHARMACEUTICALS FOR HUMAN USE ICH HARMONISED TRIPARTITE GUIDELINE VALIDATION OF ANALYTICAL PROCEDURES: TEXT AND METHODOLOGY
INTERNATIONAL CONFERENCE ON HARMONISATION OF TECHNICAL REQUIREMENTS FOR REGISTRATION OF PHARMACEUTICALS FOR HUMAN USE ICH HARMONISED TRIPARTITE GUIDELINE VALIDATION OF ANALYTICAL PROCEDURES: TEXT AND METHODOLOGY
PUMPED Nd:YAG LASER. Last Revision: August 21, 2007
 PUMPED Nd:YAG LASER Last Revision: August 21, 2007 QUESTION TO BE INVESTIGATED: How can an efficient atomic transition laser be constructed and characterized? INTRODUCTION: This lab exercise will allow
2.02 DETERMINATION OF THE FORMULA OF A COMPLEX BY SPECTROPHOTOMETRY
 2nd/3rd Year Physical Chemistry Practical Course, Oxford University 2.02 DETERMINATION OF THE FORMULA OF A COMPLEX BY SPECTROPHOTOMETRY (4 points) Outline Spectrometry is widely used to monitor the progress
Optical Design Tools for Backlight Displays
 Optical Design Tools for Backlight Displays Introduction Backlights are used for compact, portable, electronic devices with flat panel Liquid Crystal Displays (LCDs) that require illumination from behind.
73 Series Spectrophotometers
 73 Series Spectrophotometers The 73 series introduces four new spectrophotometers to the extensive Jenway range. These spectrophotometers use icon driven software and have an improved navigation system
Spectrophotometry Practical Lesson on Medical Chemistry and Biochemistry
 Spectrophotometry Practical Lesson on Medical Chemistry and Biochemistry General Medicine Jiřina Crkovská (translated by Jan Pláteník) 2010/2011 1 Spectrophotometry is one of the most widely used instrumental
Measuring of optical output and attenuation
 Measuring of optical output and attenuation THEORY Measuring of optical output is the fundamental part of measuring in optoelectronics. The importance of an optical power meter can be compared to an ammeter
Agilent Cary 60 UV-Vis
 Agilent Cary 60 UV-Vis Efficient. Accurate. Flexible. Specifications Introduction The Agilent Cary 60 UV-Vis spectrophotometer is efficient, accurate and flexible, and is designed to meet both current
Fibre Bragg Grating Sensors An Introduction to Bragg gratings and interrogation techniques
 Fibre Bragg Grating Sensors An ntroduction to Bragg gratings and interrogation techniques Dr Crispin Doyle Senior Applications Engineer, Smart Fibres Ltd. 2003 1) The Fibre Bragg Grating (FBG) There are
5.33 Lecture Notes: Introduction to Spectroscopy
 5.33 Lecture Notes: ntroduction to Spectroscopy What is spectroscopy? Studying the properties of matter through its interaction with different frequency components of the electromagnetic spectrum. Latin:
High Resolution Spatial Electroluminescence Imaging of Photovoltaic Modules
 High Resolution Spatial Electroluminescence Imaging of Photovoltaic Modules Abstract J.L. Crozier, E.E. van Dyk, F.J. Vorster Nelson Mandela Metropolitan University Electroluminescence (EL) is a useful
DYNAMIC LIGHT SCATTERING COMMON TERMS DEFINED
 DYNAMIC LIGHT SCATTERING COMMON TERMS DEFINED Abstract: There are a number of sources of information that give a mathematical description of the terms used in light scattering. However, these will not
Principle of Thermal Imaging
 Section 8 All materials, which are above 0 degrees Kelvin (-273 degrees C), emit infrared energy. The infrared energy emitted from the measured object is converted into an electrical signal by the imaging
The accurate calibration of all detectors is crucial for the subsequent data
 Chapter 4 Calibration The accurate calibration of all detectors is crucial for the subsequent data analysis. The stability of the gain and offset for energy and time calibration of all detectors involved
UVC LEDs for. Environmental Monitoring
 UVC LEDs for Environmental Monitoring Environmental monitoring relies extensively on molecular spectroscopy for tracking air quality, water and wastewater quality, and detecting hazardous substances. Advances
Making OSNR Measurements In a Modulated DWDM Signal Environment
 Making OSNR Measurements In a Modulated DWDM Signal Environment Jack Dupre Jim Stimple Making OSNR measurements in a modulated DWDM signal environment May 2001 In a DWDM spectrum, it is desirable to measure
Guidance for Industry
 Guidance for Industry Q2B Validation of Analytical Procedures: Methodology November 1996 ICH Guidance for Industry Q2B Validation of Analytical Procedures: Methodology Additional copies are available from:
Quantitation of Peptides and Amino Acids with a Synergy HT using UV Fluorescence
 Quantitation of Peptides and Amino Acids with a Synergy HT using UV Fluorescence Introduction Eukaryotic and prokaryotic cells contain a number of compounds that are fluorescent with UV light excitation.
Effects of Temperature, Pressure and Water Vapor on Gas Phase Infrared Absorption by CO 2
 Effects of Temperature, Pressure and Water Vapor on Gas Phase Infrared Absorption by CO 2 D. K. McDermitt, J. M. Welles, and R. D. Eckles - LI-COR, inc. Lincoln, NE 68504 USA Introduction Infrared analysis
SSO Transmission Grating Spectrograph (TGS) User s Guide
 User s Guide") SSO Transmission Grating Spectrograph (TGS) User s Guide The Rigel TGS User s Guide available online explains how a transmission grating spectrograph (TGS) works and how efficient they are. Please refer
SSO Transmission Grating Spectrograph (TGS) User s Guide The Rigel TGS User s Guide available online explains how a transmission grating spectrograph (TGS) works and how efficient they are. Please refer
ILLUSTRATIVE EXAMPLE: Given: A = 3 and B = 4 if we now want the value of C=? C = 3 + 4 = 9 + 16 = 25 or 2
 Forensic Spectral Anaylysis: Warm up! The study of triangles has been done since ancient times. Many of the early discoveries about triangles are still used today. We will only be concerned with the "right
UV/VIS Spectroscopy. Summary. Contents
 Summary UV/VIS Spectroscopy Many chemical compounds have a characteristic colour. For example, quinone is yellow; chlorophyll is green; the 2,4-dinitrophenylhydrazone derivatives of aldehydes and ketones
Blackbody Radiation References INTRODUCTION
 Blackbody Radiation References 1) R.A. Serway, R.J. Beichner: Physics for Scientists and Engineers with Modern Physics, 5 th Edition, Vol. 2, Ch.40, Saunders College Publishing (A Division of Harcourt
UV-Vis spectrophotometers
 UV-Vis spectrophotometers an Advanced Digital Technology EXPERIENCE SECOMAM is proud to provide the new fourthgeneration UVIKON ultraviolet-visible spectrophotometers.with more than five decades of experience
From lowest energy to highest energy, which of the following correctly orders the different categories of electromagnetic radiation?
 From lowest energy to highest energy, which of the following correctly orders the different categories of electromagnetic radiation? From lowest energy to highest energy, which of the following correctly