MIC - Detecting Novel Associations in Large Data Sets. by Nico Güttler, Andreas Ströhlein and Matt Huska
|
|
|
- Shauna Griffith
- 10 years ago
- Views:
Transcription
1 MIC - Detecting Novel Associations in Large Data Sets by Nico Güttler, Andreas Ströhlein and Matt Huska

2 Outline Motivation Method Results Criticism Conclusions

3 Motivation - Goal Determine important undiscovered relationships in data sets with lots of variables Efficiently identify the important relationships

4 Motivation


5 Reshef et al. 2011
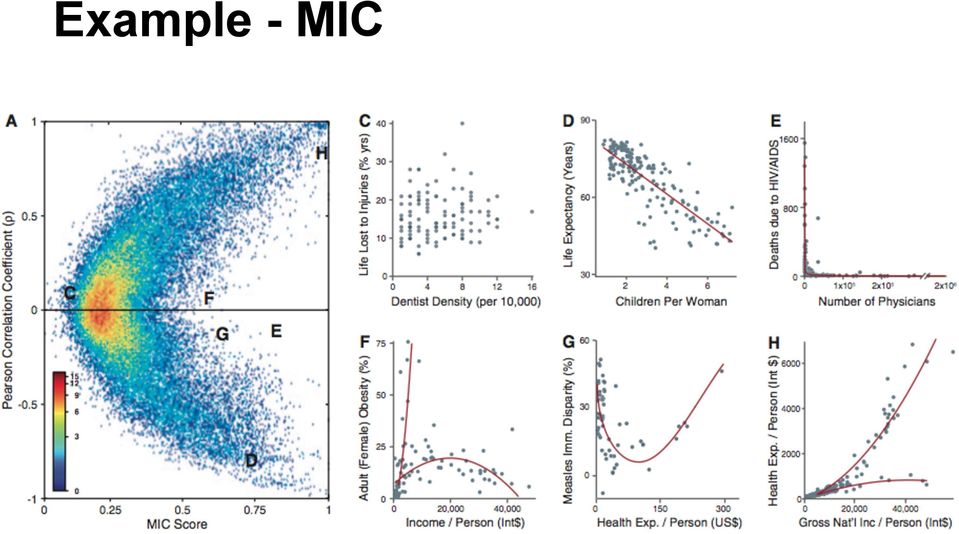
6 MIC - Maximal Information Coefficient Measure of variable dependence Association between variable pairs Univariate Detects functional & non-functional dependence

7 MIC - Maximal Information Coefficient Functional relationships: MIC ~= R2 Range: 0 (statistical independence) - 1 (no noise) For linear relationships: MIC ~= (Pearson correlation coefficient)2

8 MIC - Main Properties 1. Generality Provided sufficient sample size: detects a wide range of relationships Including non-functional types (e.g. functional superposition) 2. Equitability Similar scores to equally noisy relationships Independent of relationship type

9 MIC - Generality & Equitability

10 Noise vs. Spearman Rank Correlation Noise: 1-R2

11 Noise vs. MIC Score Noise: 1-R2

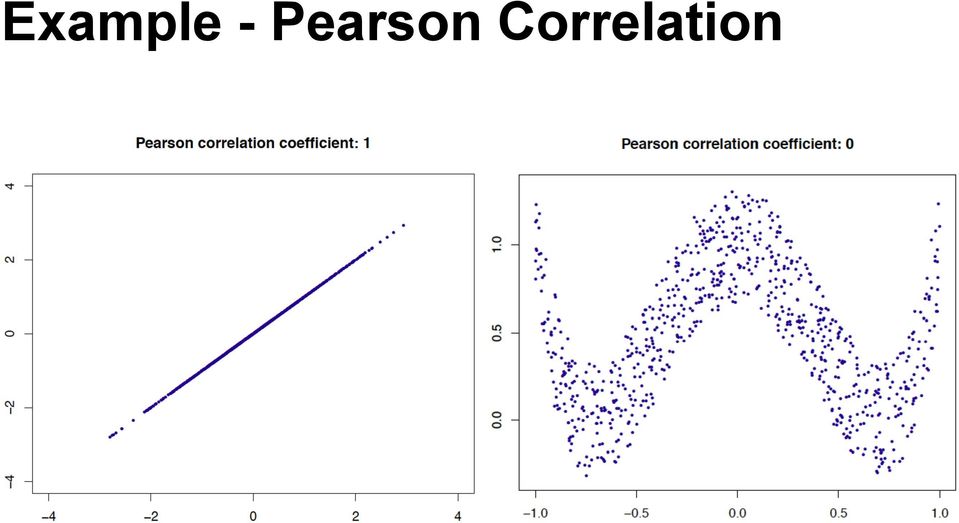
12 Example - Pearson Correlation

13 Example - MIC
14 Calculating MIC - Central Idea If a relationship exists between two variables, then a grid can be drawn on the scatterplot of the two variables that partitions the data to encapsulate that relationship. Need to find the best: number of partitions (a.k.a. grid resolution) placement of the partitions

15 Scatterplots and Grids 2-variable plot Grid resolution Partition placements

16 Scoring Grids Resolution: MIC tries all resolutions (x,y) where xy < n0.6 Partitioning: For each resolution (x,y) MIC finds grid partition placement with highest mutual information Use approximation algorithm to reduce the number of partition placements we consider Mutual information: X,Y: random variables p(x,y): joint probability distribution function p(x), p(y): marginal probability distribution functions
: joint probability distribution function p(x), p(y):")

17 Mutual information Probability of a box = # of data points in that box


18 Mutual information = 0.153


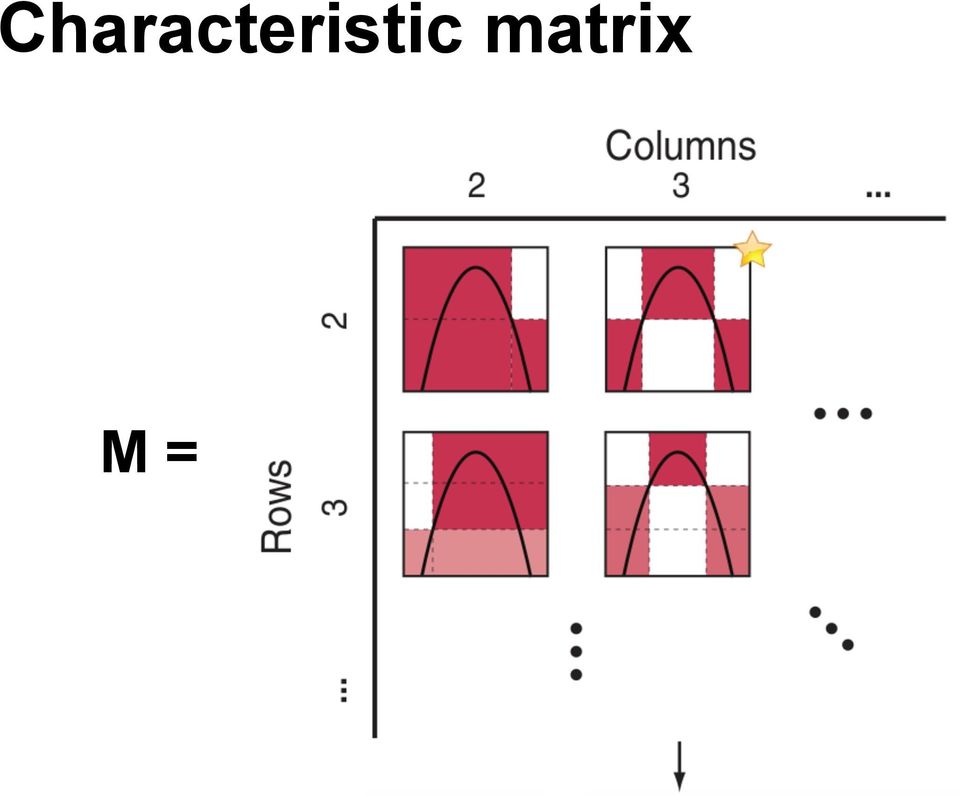
19 Characteristic matrix & Normalization Highest mutual information score for each resolution is stored in the characteristic matrix M(x,y) Different resolution grids have different maximum mutual information scores, we need to normalize them: Resulting normalized values range = (0, 1)

20 Characteristic matrix M=

21 M as a Surface
22 Measures based on MIC We can calculate other interesting statistics using MIC and the characteristic matrix M: Maximum Asymmetry Score (MAS): Deviation from monotonicity Minimum Cell Number (MCN): Complexity measure Tells you the minimum number of partitions to get the MIC score Collection of statistics: MINE - Maximal Information-based non-parametric Exploration
23 MINE statistics Pearson
24 MIC - Gene expression data Spellman data set from Monday MIC and MAS applied to time series gene expression data Method 1: MIC score of time vs. expression
25 Results - Reshef et al. 2011
26 MIC - Gene expression data Method 2: Calculated P-value for each MIC score by permuting one of the variables FDR controlled using Benjamini & Hochberg Resulting genes sorted by MAS scores (periodicity)
27 Results
28 MIC on microarray data (B1, 104 genes)
29 Criticism of MIC Comment to Science (Simon and Tibshirani 2012) MIC was shown to have low power in comparison to another method, distance correlation (dcor) (Szekely, Rizzo, and Bakirov 2007) Simulated pairs of variables with varying amounts of noise added Power: Probability test will correctly reject H0 lower power = more false positives
30 MIC vs. Pearson vs. dcor
31 Conclusion General tool for data exploration Not specific to certain data sets Find potential relationships of any kind Useful tool for identification and characterization of structure in data
32 References Reshef DN, Reshef YA, Finucane HK, Grossman SR, McVean G, Turnbaugh PJ, Lander ES, Mitzenmacher M, Sabeti PC. Detecting novel associations in large data sets. Science Dec 16;334(6062): PubMed PMID: Simon, Noah and Robert Tibshirani (2012). Comment On Detecting Novel Associations In Large Data Sets By Reshef et al, Science Dec 16, 2011.
Multivariate Regression Modeling for Home Value Estimates with Evaluation using Maximum Information Coefficient
 Multivariate Regression Modeling for Home Value Estimates with Evaluation using Maximum Information Coefficient Gongzhu Hu, Jinping Wang, and Wenying Feng Abstract Predictive modeling is a statistical
Winning the Kaggle Algorithmic Trading Challenge with the Composition of Many Models and Feature Engineering
 IEICE Transactions on Information and Systems, vol.e96-d, no.3, pp.742-745, 2013. 1 Winning the Kaggle Algorithmic Trading Challenge with the Composition of Many Models and Feature Engineering Ildefons
Syllabus for MATH 191 MATH 191 Topics in Data Science: Algorithms and Mathematical Foundations Department of Mathematics, UCLA Fall Quarter 2015
 Syllabus for MATH 191 MATH 191 Topics in Data Science: Algorithms and Mathematical Foundations Department of Mathematics, UCLA Fall Quarter 2015 Lecture: MWF: 1:00-1:50pm, GEOLOGY 4645 Instructor: Mihai
Least Squares Estimation
 Least Squares Estimation SARA A VAN DE GEER Volume 2, pp 1041 1045 in Encyclopedia of Statistics in Behavioral Science ISBN-13: 978-0-470-86080-9 ISBN-10: 0-470-86080-4 Editors Brian S Everitt & David
Statistical Analysis. NBAF-B Metabolomics Masterclass. Mark Viant
 Statistical Analysis NBAF-B Metabolomics Masterclass Mark Viant 1. Introduction 2. Univariate analysis Overview of lecture 3. Unsupervised multivariate analysis Principal components analysis (PCA) Interpreting
Univariate Regression
 Univariate Regression Correlation and Regression The regression line summarizes the linear relationship between 2 variables Correlation coefficient, r, measures strength of relationship: the closer r is
Correlation Coefficient The correlation coefficient is a summary statistic that describes the linear relationship between two numerical variables 2
 Lesson 4 Part 1 Relationships between two numerical variables 1 Correlation Coefficient The correlation coefficient is a summary statistic that describes the linear relationship between two numerical variables
Additional sources Compilation of sources: http://lrs.ed.uiuc.edu/tseportal/datacollectionmethodologies/jin-tselink/tselink.htm
 Mgt 540 Research Methods Data Analysis 1 Additional sources Compilation of sources: http://lrs.ed.uiuc.edu/tseportal/datacollectionmethodologies/jin-tselink/tselink.htm http://web.utk.edu/~dap/random/order/start.htm
Data Preparation and Statistical Displays
 Reservoir Modeling with GSLIB Data Preparation and Statistical Displays Data Cleaning / Quality Control Statistics as Parameters for Random Function Models Univariate Statistics Histograms and Probability
Section 3 Part 1. Relationships between two numerical variables
 Section 3 Part 1 Relationships between two numerical variables 1 Relationship between two variables The summary statistics covered in the previous lessons are appropriate for describing a single variable.
Multivariate Analysis of Ecological Data
 Multivariate Analysis of Ecological Data MICHAEL GREENACRE Professor of Statistics at the Pompeu Fabra University in Barcelona, Spain RAUL PRIMICERIO Associate Professor of Ecology, Evolutionary Biology
Integrating DNA Motif Discovery and Genome-Wide Expression Analysis. Erin M. Conlon
 Integrating DNA Motif Discovery and Genome-Wide Expression Analysis Department of Mathematics and Statistics University of Massachusetts Amherst Statistics in Functional Genomics Workshop Ascona, Switzerland
Basic Statistics and Data Analysis for Health Researchers from Foreign Countries
 Basic Statistics and Data Analysis for Health Researchers from Foreign Countries Volkert Siersma [email protected] The Research Unit for General Practice in Copenhagen Dias 1 Content Quantifying association
Package HHG. July 14, 2015
 Type Package Package HHG July 14, 2015 Title Heller-Heller-Gorfine Tests of Independence and Equality of Distributions Version 1.5.1 Date 2015-07-13 Author Barak Brill & Shachar Kaufman, based in part
Statistical issues in the analysis of microarray data
 Statistical issues in the analysis of microarray data Daniel Gerhard Institute of Biostatistics Leibniz University of Hannover ESNATS Summerschool, Zermatt D. Gerhard (LUH) Analysis of microarray data
Environmental Remote Sensing GEOG 2021
 Environmental Remote Sensing GEOG 2021 Lecture 4 Image classification 2 Purpose categorising data data abstraction / simplification data interpretation mapping for land cover mapping use land cover class
How To Cluster
 Data Clustering Dec 2nd, 2013 Kyrylo Bessonov Talk outline Introduction to clustering Types of clustering Supervised Unsupervised Similarity measures Main clustering algorithms k-means Hierarchical Main
containing Kendall correlations; and the OUTH = option will create a data set containing Hoeffding statistics.
 Getting Correlations Using PROC CORR Correlation analysis provides a method to measure the strength of a linear relationship between two numeric variables. PROC CORR can be used to compute Pearson product-moment
Sections 2.11 and 5.8
 Sections 211 and 58 Timothy Hanson Department of Statistics, University of South Carolina Stat 704: Data Analysis I 1/25 Gesell data Let X be the age in in months a child speaks his/her first word and
Homework 11. Part 1. Name: Score: / null
 Name: Score: / Homework 11 Part 1 null 1 For which of the following correlations would the data points be clustered most closely around a straight line? A. r = 0.50 B. r = -0.80 C. r = 0.10 D. There is
Study Guide for the Final Exam
 Study Guide for the Final Exam When studying, remember that the computational portion of the exam will only involve new material (covered after the second midterm), that material from Exam 1 will make
1) The table lists the smoking habits of a group of college students. Answer: 0.218
 The table lists the smoking habits of a group of college students. Answer: 0.218") FINAL EXAM REVIEW Name ) The table lists the smoking habits of a group of college students. Sex Non-smoker Regular Smoker Heavy Smoker Total Man 5 52 5 92 Woman 8 2 2 220 Total 22 2 If a student is chosen
FINAL EXAM REVIEW Name ) The table lists the smoking habits of a group of college students. Sex Non-smoker Regular Smoker Heavy Smoker Total Man 5 52 5 92 Woman 8 2 2 220 Total 22 2 If a student is chosen
Using Excel for inferential statistics
 FACT SHEET Using Excel for inferential statistics Introduction When you collect data, you expect a certain amount of variation, just caused by chance. A wide variety of statistical tests can be applied
SPSS Tests for Versions 9 to 13
 SPSS Tests for Versions 9 to 13 Chapter 2 Descriptive Statistic (including median) Choose Analyze Descriptive statistics Frequencies... Click on variable(s) then press to move to into Variable(s): list
Bowerman, O'Connell, Aitken Schermer, & Adcock, Business Statistics in Practice, Canadian edition
 Bowerman, O'Connell, Aitken Schermer, & Adcock, Business Statistics in Practice, Canadian edition Online Learning Centre Technology Step-by-Step - Excel Microsoft Excel is a spreadsheet software application
Comparing Functional Data Analysis Approach and Nonparametric Mixed-Effects Modeling Approach for Longitudinal Data Analysis
 Comparing Functional Data Analysis Approach and Nonparametric Mixed-Effects Modeling Approach for Longitudinal Data Analysis Hulin Wu, PhD, Professor (with Dr. Shuang Wu) Department of Biostatistics &
Curriculum Map Statistics and Probability Honors (348) Saugus High School Saugus Public Schools 2009-2010
 Saugus High School Saugus Public Schools 2009-2010") Curriculum Map Statistics and Probability Honors (348) Saugus High School Saugus Public Schools 2009-2010 Week 1 Week 2 14.0 Students organize and describe distributions of data by using a number of different
Curriculum Map Statistics and Probability Honors (348) Saugus High School Saugus Public Schools 2009-2010 Week 1 Week 2 14.0 Students organize and describe distributions of data by using a number of different
II. DISTRIBUTIONS distribution normal distribution. standard scores
 Appendix D Basic Measurement And Statistics The following information was developed by Steven Rothke, PhD, Department of Psychology, Rehabilitation Institute of Chicago (RIC) and expanded by Mary F. Schmidt,
Simple Predictive Analytics Curtis Seare
 Using Excel to Solve Business Problems: Simple Predictive Analytics Curtis Seare Copyright: Vault Analytics July 2010 Contents Section I: Background Information Why use Predictive Analytics? How to use
UNIVERSITY OF NAIROBI
 UNIVERSITY OF NAIROBI MASTERS IN PROJECT PLANNING AND MANAGEMENT NAME: SARU CAROLYNN ELIZABETH REGISTRATION NO: L50/61646/2013 COURSE CODE: LDP 603 COURSE TITLE: RESEARCH METHODS LECTURER: GAKUU CHRISTOPHER
DATA ANALYSIS. QEM Network HBCU-UP Fundamentals of Education Research Workshop Gerunda B. Hughes, Ph.D. Howard University
 DATA ANALYSIS QEM Network HBCU-UP Fundamentals of Education Research Workshop Gerunda B. Hughes, Ph.D. Howard University Quantitative Research What is Statistics? Statistics (as a subject) is the science
Example: Credit card default, we may be more interested in predicting the probabilty of a default than classifying individuals as default or not.
 Statistical Learning: Chapter 4 Classification 4.1 Introduction Supervised learning with a categorical (Qualitative) response Notation: - Feature vector X, - qualitative response Y, taking values in C
Package GSA. R topics documented: February 19, 2015
 Package GSA February 19, 2015 Title Gene set analysis Version 1.03 Author Brad Efron and R. Tibshirani Description Gene set analysis Maintainer Rob Tibshirani Dependencies impute
Package empiricalfdr.deseq2
 Type Package Package empiricalfdr.deseq2 May 27, 2015 Title Simulation-Based False Discovery Rate in RNA-Seq Version 1.0.3 Date 2015-05-26 Author Mikhail V. Matz Maintainer Mikhail V. Matz
Analysing Questionnaires using Minitab (for SPSS queries contact -) [email protected]
 Graham.Currell@uwe.ac.uk") Analysing Questionnaires using Minitab (for SPSS queries contact -) [email protected] Structure As a starting point it is useful to consider a basic questionnaire as containing three main sections:
Analysing Questionnaires using Minitab (for SPSS queries contact -) [email protected] Structure As a starting point it is useful to consider a basic questionnaire as containing three main sections:
Linear Threshold Units
 Linear Threshold Units w x hx (... w n x n w We assume that each feature x j and each weight w j is a real number (we will relax this later) We will study three different algorithms for learning linear
Pearson's Correlation Tests
 Chapter 800 Pearson's Correlation Tests Introduction The correlation coefficient, ρ (rho), is a popular statistic for describing the strength of the relationship between two variables. The correlation
Performance Metrics for Graph Mining Tasks
 Performance Metrics for Graph Mining Tasks 1 Outline Introduction to Performance Metrics Supervised Learning Performance Metrics Unsupervised Learning Performance Metrics Optimizing Metrics Statistical
STATISTICA Formula Guide: Logistic Regression. Table of Contents
 : Table of Contents... 1 Overview of Model... 1 Dispersion... 2 Parameterization... 3 Sigma-Restricted Model... 3 Overparameterized Model... 4 Reference Coding... 4 Model Summary (Summary Tab)... 5 Summary
Outline. Topic 4 - Analysis of Variance Approach to Regression. Partitioning Sums of Squares. Total Sum of Squares. Partitioning sums of squares
 Topic 4 - Analysis of Variance Approach to Regression Outline Partitioning sums of squares Degrees of freedom Expected mean squares General linear test - Fall 2013 R 2 and the coefficient of correlation
MTH 140 Statistics Videos
 MTH 140 Statistics Videos Chapter 1 Picturing Distributions with Graphs Individuals and Variables Categorical Variables: Pie Charts and Bar Graphs Categorical Variables: Pie Charts and Bar Graphs Quantitative
Chapter 13 Introduction to Linear Regression and Correlation Analysis
 Chapter 3 Student Lecture Notes 3- Chapter 3 Introduction to Linear Regression and Correlation Analsis Fall 2006 Fundamentals of Business Statistics Chapter Goals To understand the methods for displaing
Dimensionality Reduction: Principal Components Analysis
 Dimensionality Reduction: Principal Components Analysis In data mining one often encounters situations where there are a large number of variables in the database. In such situations it is very likely
Point Biserial Correlation Tests
 Chapter 807 Point Biserial Correlation Tests Introduction The point biserial correlation coefficient (ρ in this chapter) is the product-moment correlation calculated between a continuous random variable
Gene Expression Analysis
 Gene Expression Analysis Jie Peng Department of Statistics University of California, Davis May 2012 RNA expression technologies High-throughput technologies to measure the expression levels of thousands
Geostatistics Exploratory Analysis
 Instituto Superior de Estatística e Gestão de Informação Universidade Nova de Lisboa Master of Science in Geospatial Technologies Geostatistics Exploratory Analysis Carlos Alberto Felgueiras [email protected]
Evaluation & Validation: Credibility: Evaluating what has been learned
 Evaluation & Validation: Credibility: Evaluating what has been learned How predictive is a learned model? How can we evaluate a model Test the model Statistical tests Considerations in evaluating a Model
Cancer Biostatistics Workshop Science of Doing Science - Biostatistics
 Cancer Biostatistics Workshop Science of Doing Science - Biostatistics Yu Shyr, PhD Jan. 18, 2008 Cancer Biostatistics Center Vanderbilt-Ingram Cancer Center [email protected] Aims Cancer Biostatistics
Module 5: Statistical Analysis
 Module 5: Statistical Analysis To answer more complex questions using your data, or in statistical terms, to test your hypothesis, you need to use more advanced statistical tests. This module reviews the
Data analysis process
 Data analysis process Data collection and preparation Collect data Prepare codebook Set up structure of data Enter data Screen data for errors Exploration of data Descriptive Statistics Graphs Analysis
True-Lift Modeling: Mining for the Most Truly Responsive Customers and Prospects
 True-Lift Modeling: Mining for the Most Truly Responsive Customers and Prospects Kathleen Kane Jane Zheng Victor Lo 1 Alex Arias-Vargas Fidelity Investments 1 Also with Bentley University New York City
Some Essential Statistics The Lure of Statistics
 Some Essential Statistics The Lure of Statistics Data Mining Techniques, by M.J.A. Berry and G.S Linoff, 2004 Statistics vs. Data Mining..lie, damn lie, and statistics mining data to support preconceived
Lecture 10: Regression Trees
 Lecture 10: Regression Trees 36-350: Data Mining October 11, 2006 Reading: Textbook, sections 5.2 and 10.5. The next three lectures are going to be about a particular kind of nonlinear predictive model,
How To Identify Noisy Variables In A Cluster
 Identification of noisy variables for nonmetric and symbolic data in cluster analysis Marek Walesiak and Andrzej Dudek Wroclaw University of Economics, Department of Econometrics and Computer Science,
SPSS Explore procedure
 SPSS Explore procedure One useful function in SPSS is the Explore procedure, which will produce histograms, boxplots, stem-and-leaf plots and extensive descriptive statistics. To run the Explore procedure,
Unit 31 A Hypothesis Test about Correlation and Slope in a Simple Linear Regression
 Unit 31 A Hypothesis Test about Correlation and Slope in a Simple Linear Regression Objectives: To perform a hypothesis test concerning the slope of a least squares line To recognize that testing for a
How To Run Statistical Tests in Excel
 How To Run Statistical Tests in Excel Microsoft Excel is your best tool for storing and manipulating data, calculating basic descriptive statistics such as means and standard deviations, and conducting
Projects Involving Statistics (& SPSS)
") Projects Involving Statistics (& SPSS) Academic Skills Advice Starting a project which involves using statistics can feel confusing as there seems to be many different things you can do (charts, graphs,
Projects Involving Statistics (& SPSS) Academic Skills Advice Starting a project which involves using statistics can feel confusing as there seems to be many different things you can do (charts, graphs,
We are often interested in the relationship between two variables. Do people with more years of full-time education earn higher salaries?
 Statistics: Correlation Richard Buxton. 2008. 1 Introduction We are often interested in the relationship between two variables. Do people with more years of full-time education earn higher salaries? Do
Package ERP. December 14, 2015
 Type Package Package ERP December 14, 2015 Title Significance Analysis of Event-Related Potentials Data Version 1.1 Date 2015-12-11 Author David Causeur (Agrocampus, Rennes, France) and Ching-Fan Sheu
Data exploration with Microsoft Excel: analysing more than one variable
 Data exploration with Microsoft Excel: analysing more than one variable Contents 1 Introduction... 1 2 Comparing different groups or different variables... 2 3 Exploring the association between categorical
Introduction to Learning & Decision Trees
 Artificial Intelligence: Representation and Problem Solving 5-38 April 0, 2007 Introduction to Learning & Decision Trees Learning and Decision Trees to learning What is learning? - more than just memorizing
Data Mining: Exploring Data. Lecture Notes for Chapter 3. Slides by Tan, Steinbach, Kumar adapted by Michael Hahsler
 Data Mining: Exploring Data Lecture Notes for Chapter 3 Slides by Tan, Steinbach, Kumar adapted by Michael Hahsler Topics Exploratory Data Analysis Summary Statistics Visualization What is data exploration?
Overview of Non-Parametric Statistics PRESENTER: ELAINE EISENBEISZ OWNER AND PRINCIPAL, OMEGA STATISTICS
 Overview of Non-Parametric Statistics PRESENTER: ELAINE EISENBEISZ OWNER AND PRINCIPAL, OMEGA STATISTICS About Omega Statistics Private practice consultancy based in Southern California, Medical and Clinical
Two-Way ANOVA tests. I. Definition and Applications...2. II. Two-Way ANOVA prerequisites...2. III. How to use the Two-Way ANOVA tool?...
 Two-Way ANOVA tests Contents at a glance I. Definition and Applications...2 II. Two-Way ANOVA prerequisites...2 III. How to use the Two-Way ANOVA tool?...3 A. Parametric test, assume variances equal....4
BASIC STATISTICAL METHODS FOR GENOMIC DATA ANALYSIS
 BASIC STATISTICAL METHODS FOR GENOMIC DATA ANALYSIS SEEMA JAGGI Indian Agricultural Statistics Research Institute Library Avenue, New Delhi-110 012 [email protected] Genomics A genome is an organism s
PITFALLS IN TIME SERIES ANALYSIS. Cliff Hurvich Stern School, NYU
 PITFALLS IN TIME SERIES ANALYSIS Cliff Hurvich Stern School, NYU The t -Test If x 1,..., x n are independent and identically distributed with mean 0, and n is not too small, then t = x 0 s n has a standard
COMP6053 lecture: Relationship between two variables: correlation, covariance and r-squared. [email protected]
 COMP6053 lecture: Relationship between two variables: correlation, covariance and r-squared [email protected] Relationships between variables So far we have looked at ways of characterizing the distribution
Correlational Research. Correlational Research. Stephen E. Brock, Ph.D., NCSP EDS 250. Descriptive Research 1. Correlational Research: Scatter Plots
 Correlational Research Stephen E. Brock, Ph.D., NCSP California State University, Sacramento 1 Correlational Research A quantitative methodology used to determine whether, and to what degree, a relationship
Paper No 19. FINALTERM EXAMINATION Fall 2009 MTH302- Business Mathematics & Statistics (Session - 2) Ref No: Time: 120 min Marks: 80
 Ref No: Time: 120 min Marks: 80") Paper No 19 FINALTERM EXAMINATION Fall 2009 MTH302- Business Mathematics & Statistics (Session - 2) Ref No: Time: 120 min Marks: 80 Question No: 1 ( Marks: 1 ) - Please choose one Scatterplots are used
Paper No 19 FINALTERM EXAMINATION Fall 2009 MTH302- Business Mathematics & Statistics (Session - 2) Ref No: Time: 120 min Marks: 80 Question No: 1 ( Marks: 1 ) - Please choose one Scatterplots are used
DESCRIPTIVE STATISTICS. The purpose of statistics is to condense raw data to make it easier to answer specific questions; test hypotheses.
 DESCRIPTIVE STATISTICS The purpose of statistics is to condense raw data to make it easier to answer specific questions; test hypotheses. DESCRIPTIVE VS. INFERENTIAL STATISTICS Descriptive To organize,
COM CO P 5318 Da t Da a t Explora Explor t a ion and Analysis y Chapte Chapt r e 3
 COMP 5318 Data Exploration and Analysis Chapter 3 What is data exploration? A preliminary exploration of the data to better understand its characteristics. Key motivations of data exploration include Helping
Minitab Tutorials for Design and Analysis of Experiments. Table of Contents
 Table of Contents Introduction to Minitab...2 Example 1 One-Way ANOVA...3 Determining Sample Size in One-way ANOVA...8 Example 2 Two-factor Factorial Design...9 Example 3: Randomized Complete Block Design...14
Analysis of Data. Organizing Data Files in SPSS. Descriptive Statistics
 Analysis of Data Claudia J. Stanny PSY 67 Research Design Organizing Data Files in SPSS All data for one subject entered on the same line Identification data Between-subjects manipulations: variable to
MULTIPLE CHOICE. Choose the one alternative that best completes the statement or answers the question.
 Final Exam Review MULTIPLE CHOICE. Choose the one alternative that best completes the statement or answers the question. 1) A researcher for an airline interviews all of the passengers on five randomly
Gene expression analysis. Ulf Leser and Karin Zimmermann
 Gene expression analysis Ulf Leser and Karin Zimmermann Ulf Leser: Bioinformatics, Wintersemester 2010/2011 1 Last lecture What are microarrays? - Biomolecular devices measuring the transcriptome of a
X X X a) perfect linear correlation b) no correlation c) positive correlation (r = 1) (r = 0) (0 < r < 1)
 perfect linear correlation b) no correlation c) positive correlation (r = 1) (r = 0) (0 < r < 1)") CORRELATION AND REGRESSION / 47 CHAPTER EIGHT CORRELATION AND REGRESSION Correlation and regression are statistical methods that are commonly used in the medical literature to compare two or more variables.
CORRELATION AND REGRESSION / 47 CHAPTER EIGHT CORRELATION AND REGRESSION Correlation and regression are statistical methods that are commonly used in the medical literature to compare two or more variables.
The Statistics Tutor s Quick Guide to
 statstutor community project encouraging academics to share statistics support resources All stcp resources are released under a Creative Commons licence The Statistics Tutor s Quick Guide to Stcp-marshallowen-7
Using Excel for Statistical Analysis
 Using Excel for Statistical Analysis You don t have to have a fancy pants statistics package to do many statistical functions. Excel can perform several statistical tests and analyses. First, make sure
Descriptive Statistics
 Descriptive Statistics Primer Descriptive statistics Central tendency Variation Relative position Relationships Calculating descriptive statistics Descriptive Statistics Purpose to describe or summarize
The Artificial Prediction Market
 The Artificial Prediction Market Adrian Barbu Department of Statistics Florida State University Joint work with Nathan Lay, Siemens Corporate Research 1 Overview Main Contributions A mathematical theory
Lecture 3: Linear methods for classification
 Lecture 3: Linear methods for classification Rafael A. Irizarry and Hector Corrada Bravo February, 2010 Today we describe four specific algorithms useful for classification problems: linear regression,
An Introduction to Machine Learning
 An Introduction to Machine Learning L5: Novelty Detection and Regression Alexander J. Smola Statistical Machine Learning Program Canberra, ACT 0200 Australia [email protected] Tata Institute, Pune,
Tutorial for proteome data analysis using the Perseus software platform
 Tutorial for proteome data analysis using the Perseus software platform Laboratory of Mass Spectrometry, LNBio, CNPEM Tutorial version 1.0, January 2014. Note: This tutorial was written based on the information
Data Analysis, Research Study Design and the IRB
 Minding the p-values p and Quartiles: Data Analysis, Research Study Design and the IRB Don Allensworth-Davies, MSc Research Manager, Data Coordinating Center Boston University School of Public Health IRB
Joint Exam 1/P Sample Exam 1
 Joint Exam 1/P Sample Exam 1 Take this practice exam under strict exam conditions: Set a timer for 3 hours; Do not stop the timer for restroom breaks; Do not look at your notes. If you believe a question
PROPERTIES OF THE SAMPLE CORRELATION OF THE BIVARIATE LOGNORMAL DISTRIBUTION
 PROPERTIES OF THE SAMPLE CORRELATION OF THE BIVARIATE LOGNORMAL DISTRIBUTION Chin-Diew Lai, Department of Statistics, Massey University, New Zealand John C W Rayner, School of Mathematics and Applied Statistics,
Course on Functional Analysis. ::: Gene Set Enrichment Analysis - GSEA -
 Course on Functional Analysis ::: Madrid, June 31st, 2007. Gonzalo Gómez, PhD. [email protected] Bioinformatics Unit CNIO ::: Contents. 1. Introduction. 2. GSEA Software 3. Data Formats 4. Using GSEA 5. GSEA
Correlation key concepts:
 CORRELATION Correlation key concepts: Types of correlation Methods of studying correlation a) Scatter diagram b) Karl pearson s coefficient of correlation c) Spearman s Rank correlation coefficient d)
. P. 4.3 Basic feasible solutions and vertices of polyhedra. x 1. x 2
 4. Basic feasible solutions and vertices of polyhedra Due to the fundamental theorem of Linear Programming, to solve any LP it suffices to consider the vertices (finitely many) of the polyhedron P of the
The importance of graphing the data: Anscombe s regression examples
 The importance of graphing the data: Anscombe s regression examples Bruce Weaver Northern Health Research Conference Nipissing University, North Bay May 30-31, 2008 B. Weaver, NHRC 2008 1 The Objective
Parametric and Nonparametric: Demystifying the Terms
 Parametric and Nonparametric: Demystifying the Terms By Tanya Hoskin, a statistician in the Mayo Clinic Department of Health Sciences Research who provides consultations through the Mayo Clinic CTSA BERD
General Method: Difference of Means. 3. Calculate df: either Welch-Satterthwaite formula or simpler df = min(n 1, n 2 ) 1.
 1.") General Method: Difference of Means 1. Calculate x 1, x 2, SE 1, SE 2. 2. Combined SE = SE1 2 + SE2 2. ASSUMES INDEPENDENT SAMPLES. 3. Calculate df: either Welch-Satterthwaite formula or simpler df = min(n
General Method: Difference of Means 1. Calculate x 1, x 2, SE 1, SE 2. 2. Combined SE = SE1 2 + SE2 2. ASSUMES INDEPENDENT SAMPLES. 3. Calculate df: either Welch-Satterthwaite formula or simpler df = min(n
Social Media Mining. Data Mining Essentials
 Introduction Data production rate has been increased dramatically (Big Data) and we are able store much more data than before E.g., purchase data, social media data, mobile phone data Businesses and customers
UNDERSTANDING THE TWO-WAY ANOVA
 UNDERSTANDING THE e have seen how the one-way ANOVA can be used to compare two or more sample means in studies involving a single independent variable. This can be extended to two independent variables