Some Essential Statistics The Lure of Statistics
|
|
|
- Hillary Kennedy
- 8 years ago
- Views:
Transcription
1 Some Essential Statistics The Lure of Statistics Data Mining Techniques, by M.J.A. Berry and G.S Linoff, 2004

2 Statistics vs. Data Mining..lie, damn lie, and statistics mining data to support preconceived notions Statistics and the scientific method a discipline to help scientists make sense of observations and experiments Too little data for statisticians Too much data in data mining Many of the techniques & algorithms used are shared by both statisticians and data miners

3 Some Definitions Population: the collection (universe) of things under consideration Sample: a portion of the population selected for analysis Statistic: a summary measure computed to describe a characteristic of the sample

4 Inferences from a Sample Population Sample Valid for the population Use statistics to summarize features Use parameters to summarize features Inference on the population from the sample

5 Occam s Razor William of Occam, Franciscan monk, Influential philosopher, theologian, professor with a very simple idea: Latin: Entia non sunt multiplicanda sine necessitate The simpler explanation is the preferable one ( Keep it simple, stupid! )

6 The Null Hypothesis The NH assumes that differences among observations are due simply to chance (statement of no effect) Bush vs. Kerry poll s margin of error ~ 3% - 4% Bush Kerry Other Not sure 46% 47% 2% 4% Layperson: Are these % s different? Statistician: What is the probability that these two values are really the same? Skepticism - good for both statisticians and data miners

7 P-Values and Q-Values Null hypothesis is true implies nothing is really happening; differences are due to chance The p-value is the probability that the null hypothesis is true (strength of evidence, provided by the sample data, in favor of NH) p~0.0: NH is false, and differences are likely p~1.0: no differences detectable, given the sample size p=0.05 indicates a 5% chance of drawing the sample if NH is true NOTE: we cannot prove that a hypothesis is true; rather consider evidence for/against Confidence (q-value) the reverse of a p-value

8 Type I and Type II errors TRUTH (unknown) H 0 true H 0 false DECISION Do not reject H 0 Correct Type II error Reject H 0 Type I error Correct Significance level = prob. of rejecting the null hypothesis when it is true (alpha). Power = probability of rejecting the null hypothesis when it is false. Beta: the probability of accepting the null hypothesis when it is false Power = 1-beta.

9 Looking at Data: Discrete Values Discrete data (products, channels, regions, descriptions) common in data mining Histogram bars show number of times different values occur

10 Looking at Data: Time series Histograms describe a single moment in time Data mining is often concerned with what is happening over time. Time Series Analysis choosing an appropriate time frame to consider the data

11 Standardized Values Time Series chart limitations -- are changes over time expected? Consider the data as a partition of all the data, with a little bit per day Is it possible that the differences seen on each day are strictly due to chance? (null hypothesis) Analyze sample variation Central Limit Theorem: With many samples are taken from a population, the distribution of the averages of the samples follows the normal distribution. The average of the samples comes arbitrarily close to the population average
 Analyze sample variation Central Limit Theorem: With many samples are taken from a population, the")
12 Standardized values Normal distribution: described by the mean (average count) and the standard deviation (clustering around the mean) Standardized values z-value = (value mean)/sd mean=0, sd=1 If null hypothesis is true, z-values should follow standard normal distribution Also useful for transforming variables to similar range

13 Standardized values Roughly normal. Large peak in Dec. Strong weekly trend Not normal. (many more ve values than +ve)

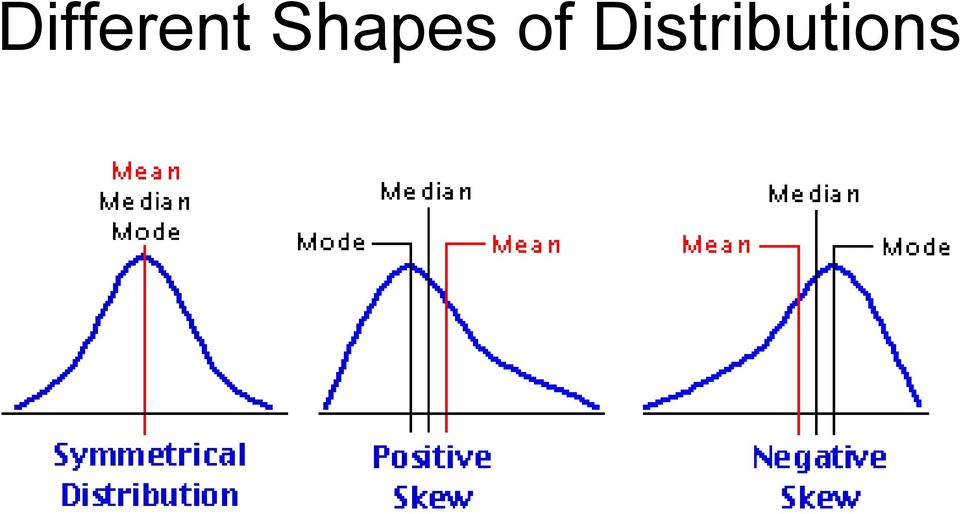
14 Looking at data: continuous variables Mean (average): the sum of the values divided by the number of values Median: the midpoint of the values (50% above; 50% below) after they have been ordered (ascending or descending order) Mode: the most frequent value among all the values observed Range: the difference between the smallest and largest observation in the sample

15 Different Shapes of Distributions
16 Data mining vs. Statistics Statisticians and data miners use similar techniques, but Data mining tends to ignore measurement error in raw data Data mining assume a lot of data and processing power Data mining assumes dependency on time everywhere Can be difficult to experiment in the business world Data can be truncated and censored

17 Censored data: examples Customer tenure value of active customers must be greater than current tenure (do not know when customer will stop) Claim amount not known for those who have not files a claim Sales and inventory potential sales are greater than actual sales when out of inventory

18 Regression Basics

19 Linear relationship revenue tenure

20 Best fit model y = x R 2 = Estimation the weights w: Minimize errors -- Least squares method For which model (w) is the data most likely? -- Maximum likelihood estimation
")
21 Regression model amount = 0.56 * tenure y = β x + c output = f (inputs) Model gives expected value when applied Slope β How good is the fit? -- R 2 How much of the relation in the data is captured by the model Stable model? with a different sample, will same model be obtained Residuals normal with mean 0 and sd σ
22 Obtaining the linear regression model Consider y i = wx i + noise i Independent noise, normally distributed with mean and std. dev. σ P(y w, x) = Normal (mean wx, std dev σ) Maximum likelihood estimate of w find w that maximizes p(y 1, y 2,..y n x 1, x 2,..x n, w) maximize maximize maximize minimize n p( y i= 1 n i= 1 i exp( w, x i ) y i wx ( i σ n i i = 1 2 σ n i = 1 ( y i y wx i wx ) 2 2 ) i 2 Maximum likelihood estimate minimizes the squared errors
23 Minimize squared errors E = i ( y i wxi 2 ) = 2 y i 2 xi yi ) w+ 2 2 ( ( xi ) w Minimum E is obtained with w = x i y i / ( xi 2 )
24 Residuals residuals should distribute evenly around 0 should show no pattern with x values should be normally distributed around 0
25 Heterogeneous data? y = x R 2 =
26 Heterogeneous data Type A Type B
27 Heterogeneous data y = 3.515x R 2 = y = 1.322x R 2 =
28 Using an Indicator variable Indicator variable Product ={0, 1} y = 2.89 x * Product R 2 = 0.93 Individual models y = 3.515x (product 0) R 2 = y = 1.322x (product 1) R 2 =
29 Multiple regression y = β 0 + β 1 x 1 + β 2 x 2 + β m x m Variables should be linearly independent of each other Fewer variables work better Forward selection Stepwise refinement Using a validation set evaluate family of models on a validation set
30 General linear models Interaction terms y = β 0 + β 1 x 1 x 2 + β 2 x 2 + Polynomial form y = β 0 + β 1 x 1 + β 2 x β k x 1 k
31 Polynomial example
32 Polynomial example y = x R 2 = y = x x R 2 =
33 Polynomial example overfit? y = x x R 2 = y = x x x R 2 = y = x x x x R 2 = y = -1.78x x x x x x R 2 =
34 Binary dependent variable? 1 y = x R 2 =
35 Odds Ratio p: probability of an event occurring 1-p: probability of the event not occurring Odds ratio = p/(1-p) Odds of winning 1:3 => odds of 1 win in 3 losses Odds ratio = 0.25/(1-0.25) Log of odds symmetric around 0 -ve values for low probabilities +p=ve for high probabilities logodds
36 Logistic regression Log of odds ratio as dependent variable ln( 1 y ) y = β + β x 0 1 y = 0 e 1+ e β + β x 0 1 β + β x 1 = 1+ e 1 β + β x) ( 0 1 Non-linear model form Maximum likelihood estimates for coefficients Consider ln(y/(1-y)) = x Log-odds changes by 1.2 for a unit change in x y, ie. prob. of occurrence, changes by exp(1.2) for unit change in x
Data Mining Techniques Chapter 5: The Lure of Statistics: Data Mining Using Familiar Tools
 Data Mining Techniques Chapter 5: The Lure of Statistics: Data Mining Using Familiar Tools Occam s razor.......................................................... 2 A look at data I.........................................................
International Statistical Institute, 56th Session, 2007: Phil Everson
 Teaching Regression using American Football Scores Everson, Phil Swarthmore College Department of Mathematics and Statistics 5 College Avenue Swarthmore, PA198, USA E-mail: peverso1@swarthmore.edu 1. Introduction
Fairfield Public Schools
 Mathematics Fairfield Public Schools AP Statistics AP Statistics BOE Approved 04/08/2014 1 AP STATISTICS Critical Areas of Focus AP Statistics is a rigorous course that offers advanced students an opportunity
Institute of Actuaries of India Subject CT3 Probability and Mathematical Statistics
 Institute of Actuaries of India Subject CT3 Probability and Mathematical Statistics For 2015 Examinations Aim The aim of the Probability and Mathematical Statistics subject is to provide a grounding in
Generalized Linear Models
 Generalized Linear Models We have previously worked with regression models where the response variable is quantitative and normally distributed. Now we turn our attention to two types of models where the
11. Analysis of Case-control Studies Logistic Regression
 Research methods II 113 11. Analysis of Case-control Studies Logistic Regression This chapter builds upon and further develops the concepts and strategies described in Ch.6 of Mother and Child Health:
Curriculum Map Statistics and Probability Honors (348) Saugus High School Saugus Public Schools 2009-2010
 Saugus High School Saugus Public Schools 2009-2010") Curriculum Map Statistics and Probability Honors (348) Saugus High School Saugus Public Schools 2009-2010 Week 1 Week 2 14.0 Students organize and describe distributions of data by using a number of different
Curriculum Map Statistics and Probability Honors (348) Saugus High School Saugus Public Schools 2009-2010 Week 1 Week 2 14.0 Students organize and describe distributions of data by using a number of different
Doing Multiple Regression with SPSS. In this case, we are interested in the Analyze options so we choose that menu. If gives us a number of choices:
 Doing Multiple Regression with SPSS Multiple Regression for Data Already in Data Editor Next we want to specify a multiple regression analysis for these data. The menu bar for SPSS offers several options:
Dongfeng Li. Autumn 2010
 Autumn 2010 Chapter Contents Some statistics background; ; Comparing means and proportions; variance. Students should master the basic concepts, descriptive statistics measures and graphs, basic hypothesis
Statistics 305: Introduction to Biostatistical Methods for Health Sciences
 Statistics 305: Introduction to Biostatistical Methods for Health Sciences Modelling the Log Odds Logistic Regression (Chap 20) Instructor: Liangliang Wang Statistics and Actuarial Science, Simon Fraser
1. What is the critical value for this 95% confidence interval? CV = z.025 = invnorm(0.025) = 1.96
 = 1.96") 1 Final Review 2 Review 2.1 CI 1-propZint Scenario 1 A TV manufacturer claims in its warranty brochure that in the past not more than 10 percent of its TV sets needed any repair during the first two years
1 Final Review 2 Review 2.1 CI 1-propZint Scenario 1 A TV manufacturer claims in its warranty brochure that in the past not more than 10 percent of its TV sets needed any repair during the first two years
NCSS Statistical Software Principal Components Regression. In ordinary least squares, the regression coefficients are estimated using the formula ( )
") Chapter 340 Principal Components Regression Introduction is a technique for analyzing multiple regression data that suffer from multicollinearity. When multicollinearity occurs, least squares estimates
Chapter 340 Principal Components Regression Introduction is a technique for analyzing multiple regression data that suffer from multicollinearity. When multicollinearity occurs, least squares estimates
MONT 107N Understanding Randomness Solutions For Final Examination May 11, 2010
 MONT 07N Understanding Randomness Solutions For Final Examination May, 00 Short Answer (a) (0) How are the EV and SE for the sum of n draws with replacement from a box computed? Solution: The EV is n times
MTH 140 Statistics Videos
 MTH 140 Statistics Videos Chapter 1 Picturing Distributions with Graphs Individuals and Variables Categorical Variables: Pie Charts and Bar Graphs Categorical Variables: Pie Charts and Bar Graphs Quantitative
Outline. Topic 4 - Analysis of Variance Approach to Regression. Partitioning Sums of Squares. Total Sum of Squares. Partitioning sums of squares
 Topic 4 - Analysis of Variance Approach to Regression Outline Partitioning sums of squares Degrees of freedom Expected mean squares General linear test - Fall 2013 R 2 and the coefficient of correlation
Multinomial and Ordinal Logistic Regression
 Multinomial and Ordinal Logistic Regression ME104: Linear Regression Analysis Kenneth Benoit August 22, 2012 Regression with categorical dependent variables When the dependent variable is categorical,
Regression Modeling Strategies
 Frank E. Harrell, Jr. Regression Modeling Strategies With Applications to Linear Models, Logistic Regression, and Survival Analysis With 141 Figures Springer Contents Preface Typographical Conventions
Section 6: Model Selection, Logistic Regression and more...
 Section 6: Model Selection, Logistic Regression and more... Carlos M. Carvalho The University of Texas McCombs School of Business http://faculty.mccombs.utexas.edu/carlos.carvalho/teaching/ 1 Model Building
Chicago Booth BUSINESS STATISTICS 41000 Final Exam Fall 2011
 Chicago Booth BUSINESS STATISTICS 41000 Final Exam Fall 2011 Name: Section: I pledge my honor that I have not violated the Honor Code Signature: This exam has 34 pages. You have 3 hours to complete this
Chapter 7: Simple linear regression Learning Objectives
 Chapter 7: Simple linear regression Learning Objectives Reading: Section 7.1 of OpenIntro Statistics Video: Correlation vs. causation, YouTube (2:19) Video: Intro to Linear Regression, YouTube (5:18) -
Simple Linear Regression Inference
 Simple Linear Regression Inference 1 Inference requirements The Normality assumption of the stochastic term e is needed for inference even if it is not a OLS requirement. Therefore we have: Interpretation
Why Taking This Course? Course Introduction, Descriptive Statistics and Data Visualization. Learning Goals. GENOME 560, Spring 2012
 Why Taking This Course? Course Introduction, Descriptive Statistics and Data Visualization GENOME 560, Spring 2012 Data are interesting because they help us understand the world Genomics: Massive Amounts
Multivariate Logistic Regression
 1 Multivariate Logistic Regression As in univariate logistic regression, let π(x) represent the probability of an event that depends on p covariates or independent variables. Then, using an inv.logit formulation
Simple Linear Regression
 STAT 101 Dr. Kari Lock Morgan Simple Linear Regression SECTIONS 9.3 Confidence and prediction intervals (9.3) Conditions for inference (9.1) Want More Stats??? If you have enjoyed learning how to analyze
STATISTICA Formula Guide: Logistic Regression. Table of Contents
 : Table of Contents... 1 Overview of Model... 1 Dispersion... 2 Parameterization... 3 Sigma-Restricted Model... 3 Overparameterized Model... 4 Reference Coding... 4 Model Summary (Summary Tab)... 5 Summary
2013 MBA Jump Start Program. Statistics Module Part 3
 2013 MBA Jump Start Program Module 1: Statistics Thomas Gilbert Part 3 Statistics Module Part 3 Hypothesis Testing (Inference) Regressions 2 1 Making an Investment Decision A researcher in your firm just
Statistical Machine Learning
 Statistical Machine Learning UoC Stats 37700, Winter quarter Lecture 4: classical linear and quadratic discriminants. 1 / 25 Linear separation For two classes in R d : simple idea: separate the classes
Interpretation of Somers D under four simple models
 Interpretation of Somers D under four simple models Roger B. Newson 03 September, 04 Introduction Somers D is an ordinal measure of association introduced by Somers (96)[9]. It can be defined in terms
Univariate Regression
 Univariate Regression Correlation and Regression The regression line summarizes the linear relationship between 2 variables Correlation coefficient, r, measures strength of relationship: the closer r is
Additional sources Compilation of sources: http://lrs.ed.uiuc.edu/tseportal/datacollectionmethodologies/jin-tselink/tselink.htm
 Mgt 540 Research Methods Data Analysis 1 Additional sources Compilation of sources: http://lrs.ed.uiuc.edu/tseportal/datacollectionmethodologies/jin-tselink/tselink.htm http://web.utk.edu/~dap/random/order/start.htm
Descriptive Statistics
 Descriptive Statistics Primer Descriptive statistics Central tendency Variation Relative position Relationships Calculating descriptive statistics Descriptive Statistics Purpose to describe or summarize
Lecture 10: Regression Trees
 Lecture 10: Regression Trees 36-350: Data Mining October 11, 2006 Reading: Textbook, sections 5.2 and 10.5. The next three lectures are going to be about a particular kind of nonlinear predictive model,
Why do statisticians "hate" us?
 Why do statisticians "hate" us? David Hand, Heikki Mannila, Padhraic Smyth "Data mining is the analysis of (often large) observational data sets to find unsuspected relationships and to summarize the data
Nominal and ordinal logistic regression
 Nominal and ordinal logistic regression April 26 Nominal and ordinal logistic regression Our goal for today is to briefly go over ways to extend the logistic regression model to the case where the outcome
Penalized regression: Introduction
 Penalized regression: Introduction Patrick Breheny August 30 Patrick Breheny BST 764: Applied Statistical Modeling 1/19 Maximum likelihood Much of 20th-century statistics dealt with maximum likelihood
Data Mining: An Overview of Methods and Technologies for Increasing Profits in Direct Marketing. C. Olivia Rud, VP, Fleet Bank
 Data Mining: An Overview of Methods and Technologies for Increasing Profits in Direct Marketing C. Olivia Rud, VP, Fleet Bank ABSTRACT Data Mining is a new term for the common practice of searching through
Overview Classes. 12-3 Logistic regression (5) 19-3 Building and applying logistic regression (6) 26-3 Generalizations of logistic regression (7)
 19-3 Building and applying logistic regression (6) 26-3 Generalizations of logistic regression (7)") Overview Classes 12-3 Logistic regression (5) 19-3 Building and applying logistic regression (6) 26-3 Generalizations of logistic regression (7) 2-4 Loglinear models (8) 5-4 15-17 hrs; 5B02 Building and
Overview Classes 12-3 Logistic regression (5) 19-3 Building and applying logistic regression (6) 26-3 Generalizations of logistic regression (7) 2-4 Loglinear models (8) 5-4 15-17 hrs; 5B02 Building and
Intro to Data Analysis, Economic Statistics and Econometrics
 Intro to Data Analysis, Economic Statistics and Econometrics Statistics deals with the techniques for collecting and analyzing data that arise in many different contexts. Econometrics involves the development
Introduction to Regression and Data Analysis
 Statlab Workshop Introduction to Regression and Data Analysis with Dan Campbell and Sherlock Campbell October 28, 2008 I. The basics A. Types of variables Your variables may take several forms, and it
How To Write A Data Analysis
 Mathematics Probability and Statistics Curriculum Guide Revised 2010 This page is intentionally left blank. Introduction The Mathematics Curriculum Guide serves as a guide for teachers when planning instruction
Normality Testing in Excel
 Normality Testing in Excel By Mark Harmon Copyright 2011 Mark Harmon No part of this publication may be reproduced or distributed without the express permission of the author. mark@excelmasterseries.com
Statistics I for QBIC. Contents and Objectives. Chapters 1 7. Revised: August 2013
 Statistics I for QBIC Text Book: Biostatistics, 10 th edition, by Daniel & Cross Contents and Objectives Chapters 1 7 Revised: August 2013 Chapter 1: Nature of Statistics (sections 1.1-1.6) Objectives
Example: Credit card default, we may be more interested in predicting the probabilty of a default than classifying individuals as default or not.
 Statistical Learning: Chapter 4 Classification 4.1 Introduction Supervised learning with a categorical (Qualitative) response Notation: - Feature vector X, - qualitative response Y, taking values in C
Section 13, Part 1 ANOVA. Analysis Of Variance
 Section 13, Part 1 ANOVA Analysis Of Variance Course Overview So far in this course we ve covered: Descriptive statistics Summary statistics Tables and Graphs Probability Probability Rules Probability
Biostatistics: Types of Data Analysis
 Biostatistics: Types of Data Analysis Theresa A Scott, MS Vanderbilt University Department of Biostatistics theresa.scott@vanderbilt.edu http://biostat.mc.vanderbilt.edu/theresascott Theresa A Scott, MS
Data Mining and Data Warehousing. Henryk Maciejewski. Data Mining Predictive modelling: regression
 Data Mining and Data Warehousing Henryk Maciejewski Data Mining Predictive modelling: regression Algorithms for Predictive Modelling Contents Regression Classification Auxiliary topics: Estimation of prediction
Basic Probability and Statistics Review. Six Sigma Black Belt Primer
 Basic Probability and Statistics Review Six Sigma Black Belt Primer Pat Hammett, Ph.D. January 2003 Instructor Comments: This document contains a review of basic probability and statistics. It also includes
Logit and Probit. Brad Jones 1. April 21, 2009. University of California, Davis. Bradford S. Jones, UC-Davis, Dept. of Political Science
 Logit and Probit Brad 1 1 Department of Political Science University of California, Davis April 21, 2009 Logit, redux Logit resolves the functional form problem (in terms of the response function in the
Tests for Two Survival Curves Using Cox s Proportional Hazards Model
 Chapter 730 Tests for Two Survival Curves Using Cox s Proportional Hazards Model Introduction A clinical trial is often employed to test the equality of survival distributions of two treatment groups.
Logistic Regression (a type of Generalized Linear Model)
") Logistic Regression (a type of Generalized Linear Model) 1/36 Today Review of GLMs Logistic Regression 2/36 How do we find patterns in data? We begin with a model of how the world works We use our knowledge
Logistic Regression (a type of Generalized Linear Model) 1/36 Today Review of GLMs Logistic Regression 2/36 How do we find patterns in data? We begin with a model of how the world works We use our knowledge
II. DISTRIBUTIONS distribution normal distribution. standard scores
 Appendix D Basic Measurement And Statistics The following information was developed by Steven Rothke, PhD, Department of Psychology, Rehabilitation Institute of Chicago (RIC) and expanded by Mary F. Schmidt,
Simple linear regression
 Simple linear regression Introduction Simple linear regression is a statistical method for obtaining a formula to predict values of one variable from another where there is a causal relationship between
Implications of Big Data for Statistics Instruction 17 Nov 2013
 Implications of Big Data for Statistics Instruction 17 Nov 2013 Implications of Big Data for Statistics Instruction Mark L. Berenson Montclair State University MSMESB Mini Conference DSI Baltimore November
Modeling Lifetime Value in the Insurance Industry
 Modeling Lifetime Value in the Insurance Industry C. Olivia Parr Rud, Executive Vice President, Data Square, LLC ABSTRACT Acquisition modeling for direct mail insurance has the unique challenge of targeting
Examining a Fitted Logistic Model
 STAT 536 Lecture 16 1 Examining a Fitted Logistic Model Deviance Test for Lack of Fit The data below describes the male birth fraction male births/total births over the years 1931 to 1990. A simple logistic
ECLT5810 E-Commerce Data Mining Technique SAS Enterprise Miner -- Regression Model I. Regression Node
 Enterprise Miner - Regression 1 ECLT5810 E-Commerce Data Mining Technique SAS Enterprise Miner -- Regression Model I. Regression Node 1. Some background: Linear attempts to predict the value of a continuous
KSTAT MINI-MANUAL. Decision Sciences 434 Kellogg Graduate School of Management
 KSTAT MINI-MANUAL Decision Sciences 434 Kellogg Graduate School of Management Kstat is a set of macros added to Excel and it will enable you to do the statistics required for this course very easily. To
Final Exam Practice Problem Answers
 Final Exam Practice Problem Answers The following data set consists of data gathered from 77 popular breakfast cereals. The variables in the data set are as follows: Brand: The brand name of the cereal
Exercise 1.12 (Pg. 22-23)
") Individuals: The objects that are described by a set of data. They may be people, animals, things, etc. (Also referred to as Cases or Records) Variables: The characteristics recorded about each individual.
Individuals: The objects that are described by a set of data. They may be people, animals, things, etc. (Also referred to as Cases or Records) Variables: The characteristics recorded about each individual.
X X X a) perfect linear correlation b) no correlation c) positive correlation (r = 1) (r = 0) (0 < r < 1)
 perfect linear correlation b) no correlation c) positive correlation (r = 1) (r = 0) (0 < r < 1)") CORRELATION AND REGRESSION / 47 CHAPTER EIGHT CORRELATION AND REGRESSION Correlation and regression are statistical methods that are commonly used in the medical literature to compare two or more variables.
CORRELATION AND REGRESSION / 47 CHAPTER EIGHT CORRELATION AND REGRESSION Correlation and regression are statistical methods that are commonly used in the medical literature to compare two or more variables.
Students' Opinion about Universities: The Faculty of Economics and Political Science (Case Study)
") Cairo University Faculty of Economics and Political Science Statistics Department English Section Students' Opinion about Universities: The Faculty of Economics and Political Science (Case Study) Prepared
Cairo University Faculty of Economics and Political Science Statistics Department English Section Students' Opinion about Universities: The Faculty of Economics and Political Science (Case Study) Prepared
Multiple Linear Regression
 Multiple Linear Regression A regression with two or more explanatory variables is called a multiple regression. Rather than modeling the mean response as a straight line, as in simple regression, it is
ANALYSING LIKERT SCALE/TYPE DATA, ORDINAL LOGISTIC REGRESSION EXAMPLE IN R.
 ANALYSING LIKERT SCALE/TYPE DATA, ORDINAL LOGISTIC REGRESSION EXAMPLE IN R. 1. Motivation. Likert items are used to measure respondents attitudes to a particular question or statement. One must recall
Chapter 23. Inferences for Regression
 Chapter 23. Inferences for Regression Topics covered in this chapter: Simple Linear Regression Simple Linear Regression Example 23.1: Crying and IQ The Problem: Infants who cry easily may be more easily
Module 3: Correlation and Covariance
 Using Statistical Data to Make Decisions Module 3: Correlation and Covariance Tom Ilvento Dr. Mugdim Pašiƒ University of Delaware Sarajevo Graduate School of Business O ften our interest in data analysis
Basic Statistics and Data Analysis for Health Researchers from Foreign Countries
 Basic Statistics and Data Analysis for Health Researchers from Foreign Countries Volkert Siersma siersma@sund.ku.dk The Research Unit for General Practice in Copenhagen Dias 1 Content Quantifying association
Likelihood: Frequentist vs Bayesian Reasoning
 "PRINCIPLES OF PHYLOGENETICS: ECOLOGY AND EVOLUTION" Integrative Biology 200B University of California, Berkeley Spring 2009 N Hallinan Likelihood: Frequentist vs Bayesian Reasoning Stochastic odels and
DESCRIPTIVE STATISTICS. The purpose of statistics is to condense raw data to make it easier to answer specific questions; test hypotheses.
 DESCRIPTIVE STATISTICS The purpose of statistics is to condense raw data to make it easier to answer specific questions; test hypotheses. DESCRIPTIVE VS. INFERENTIAL STATISTICS Descriptive To organize,
" Y. Notation and Equations for Regression Lecture 11/4. Notation:
 Notation: Notation and Equations for Regression Lecture 11/4 m: The number of predictor variables in a regression Xi: One of multiple predictor variables. The subscript i represents any number from 1 through
2. Simple Linear Regression
 Research methods - II 3 2. Simple Linear Regression Simple linear regression is a technique in parametric statistics that is commonly used for analyzing mean response of a variable Y which changes according
Learning Example. Machine learning and our focus. Another Example. An example: data (loan application) The data and the goal
 The data and the goal") Learning Example Chapter 18: Learning from Examples 22c:145 An emergency room in a hospital measures 17 variables (e.g., blood pressure, age, etc) of newly admitted patients. A decision is needed: whether
Learning Example Chapter 18: Learning from Examples 22c:145 An emergency room in a hospital measures 17 variables (e.g., blood pressure, age, etc) of newly admitted patients. A decision is needed: whether
Chapter 4 and 5 solutions
 Chapter 4 and 5 solutions 4.4. Three different washing solutions are being compared to study their effectiveness in retarding bacteria growth in five gallon milk containers. The analysis is done in a laboratory,
DATA INTERPRETATION AND STATISTICS
 PholC60 September 001 DATA INTERPRETATION AND STATISTICS Books A easy and systematic introductory text is Essentials of Medical Statistics by Betty Kirkwood, published by Blackwell at about 14. DESCRIPTIVE
Time Series Analysis
 Time Series Analysis Identifying possible ARIMA models Andrés M. Alonso Carolina García-Martos Universidad Carlos III de Madrid Universidad Politécnica de Madrid June July, 2012 Alonso and García-Martos
Data Analysis Tools. Tools for Summarizing Data
 Data Analysis Tools This section of the notes is meant to introduce you to many of the tools that are provided by Excel under the Tools/Data Analysis menu item. If your computer does not have that tool
Two Correlated Proportions (McNemar Test)
") Chapter 50 Two Correlated Proportions (Mcemar Test) Introduction This procedure computes confidence intervals and hypothesis tests for the comparison of the marginal frequencies of two factors (each with
Chapter 50 Two Correlated Proportions (Mcemar Test) Introduction This procedure computes confidence intervals and hypothesis tests for the comparison of the marginal frequencies of two factors (each with
Introduction to Statistics and Quantitative Research Methods
 Introduction to Statistics and Quantitative Research Methods Purpose of Presentation To aid in the understanding of basic statistics, including terminology, common terms, and common statistical methods.
Categorical Data Analysis
 Richard L. Scheaffer University of Florida The reference material and many examples for this section are based on Chapter 8, Analyzing Association Between Categorical Variables, from Statistical Methods
Statistics in Medicine Research Lecture Series CSMC Fall 2014
 Catherine Bresee, MS Senior Biostatistician Biostatistics & Bioinformatics Research Institute Statistics in Medicine Research Lecture Series CSMC Fall 2014 Overview Review concept of statistical power
Organizing Your Approach to a Data Analysis
 Biost/Stat 578 B: Data Analysis Emerson, September 29, 2003 Handout #1 Organizing Your Approach to a Data Analysis The general theme should be to maximize thinking about the data analysis and to minimize
Gordon S. Linoff Founder Data Miners, Inc. gordon@data-miners.com
 Survival Data Mining Gordon S. Linoff Founder Data Miners, Inc. gordon@data-miners.com What to Expect from this Talk Background on survival analysis from a data miner s perspective Introduction to key
Chapter 13 Introduction to Linear Regression and Correlation Analysis
 Chapter 3 Student Lecture Notes 3- Chapter 3 Introduction to Linear Regression and Correlation Analsis Fall 2006 Fundamentals of Business Statistics Chapter Goals To understand the methods for displaing
Example: Boats and Manatees
 Figure 9-6 Example: Boats and Manatees Slide 1 Given the sample data in Table 9-1, find the value of the linear correlation coefficient r, then refer to Table A-6 to determine whether there is a significant
Elements of statistics (MATH0487-1)
") Elements of statistics (MATH0487-1) Prof. Dr. Dr. K. Van Steen University of Liège, Belgium December 10, 2012 Introduction to Statistics Basic Probability Revisited Sampling Exploratory Data Analysis -
Elements of statistics (MATH0487-1) Prof. Dr. Dr. K. Van Steen University of Liège, Belgium December 10, 2012 Introduction to Statistics Basic Probability Revisited Sampling Exploratory Data Analysis -
Experimental Design. Power and Sample Size Determination. Proportions. Proportions. Confidence Interval for p. The Binomial Test
 Experimental Design Power and Sample Size Determination Bret Hanlon and Bret Larget Department of Statistics University of Wisconsin Madison November 3 8, 2011 To this point in the semester, we have largely
A Primer on Forecasting Business Performance
 A Primer on Forecasting Business Performance There are two common approaches to forecasting: qualitative and quantitative. Qualitative forecasting methods are important when historical data is not available.
Case Study in Data Analysis Does a drug prevent cardiomegaly in heart failure?
 Case Study in Data Analysis Does a drug prevent cardiomegaly in heart failure? Harvey Motulsky hmotulsky@graphpad.com This is the first case in what I expect will be a series of case studies. While I mention
Part 2: Analysis of Relationship Between Two Variables
 Part 2: Analysis of Relationship Between Two Variables Linear Regression Linear correlation Significance Tests Multiple regression Linear Regression Y = a X + b Dependent Variable Independent Variable
Teaching Business Statistics through Problem Solving
 Teaching Business Statistics through Problem Solving David M. Levine, Baruch College, CUNY with David F. Stephan, Two Bridges Instructional Technology CONTACT: davidlevine@davidlevinestatistics.com Typical
Statistics in Retail Finance. Chapter 2: Statistical models of default
 Statistics in Retail Finance 1 Overview > We consider how to build statistical models of default, or delinquency, and how such models are traditionally used for credit application scoring and decision
Multiple Linear Regression in Data Mining
 Multiple Linear Regression in Data Mining Contents 2.1. A Review of Multiple Linear Regression 2.2. Illustration of the Regression Process 2.3. Subset Selection in Linear Regression 1 2 Chap. 2 Multiple
Chapter 13 Introduction to Nonlinear Regression( 非 線 性 迴 歸 )
") Chapter 13 Introduction to Nonlinear Regression( 非 線 性 迴 歸 ) and Neural Networks( 類 神 經 網 路 ) 許 湘 伶 Applied Linear Regression Models (Kutner, Nachtsheim, Neter, Li) hsuhl (NUK) LR Chap 10 1 / 35 13 Examples
Chapter 13 Introduction to Nonlinear Regression( 非 線 性 迴 歸 ) and Neural Networks( 類 神 經 網 路 ) 許 湘 伶 Applied Linear Regression Models (Kutner, Nachtsheim, Neter, Li) hsuhl (NUK) LR Chap 10 1 / 35 13 Examples
How To Run Statistical Tests in Excel
 How To Run Statistical Tests in Excel Microsoft Excel is your best tool for storing and manipulating data, calculating basic descriptive statistics such as means and standard deviations, and conducting
Testing for Lack of Fit
 Chapter 6 Testing for Lack of Fit How can we tell if a model fits the data? If the model is correct then ˆσ 2 should be an unbiased estimate of σ 2. If we have a model which is not complex enough to fit
Likelihood Approaches for Trial Designs in Early Phase Oncology
 Likelihood Approaches for Trial Designs in Early Phase Oncology Clinical Trials Elizabeth Garrett-Mayer, PhD Cody Chiuzan, PhD Hollings Cancer Center Department of Public Health Sciences Medical University
Data Mining for Model Creation. Presentation by Paul Below, EDS 2500 NE Plunkett Lane Poulsbo, WA USA 98370 paul.below@eds.
 Sept 03-23-05 22 2005 Data Mining for Model Creation Presentation by Paul Below, EDS 2500 NE Plunkett Lane Poulsbo, WA USA 98370 paul.below@eds.com page 1 Agenda Data Mining and Estimating Model Creation
Data Mining Practical Machine Learning Tools and Techniques
 Ensemble learning Data Mining Practical Machine Learning Tools and Techniques Slides for Chapter 8 of Data Mining by I. H. Witten, E. Frank and M. A. Hall Combining multiple models Bagging The basic idea
Unit 31 A Hypothesis Test about Correlation and Slope in a Simple Linear Regression
 Unit 31 A Hypothesis Test about Correlation and Slope in a Simple Linear Regression Objectives: To perform a hypothesis test concerning the slope of a least squares line To recognize that testing for a
Statistical Process Control (SPC) Training Guide
 Training Guide") Statistical Process Control (SPC) Training Guide Rev X05, 09/2013 What is data? Data is factual information (as measurements or statistics) used as a basic for reasoning, discussion or calculation. (Merriam-Webster
Statistical Process Control (SPC) Training Guide Rev X05, 09/2013 What is data? Data is factual information (as measurements or statistics) used as a basic for reasoning, discussion or calculation. (Merriam-Webster