Package empiricalfdr.deseq2
|
|
|
- Christopher Hudson
- 10 years ago
- Views:
Transcription
1 Type Package Package empiricalfdr.deseq2 May 27, 2015 Title Simulation-Based False Discovery Rate in RNA-Seq Version Date Author Mikhail V. Matz Maintainer Mikhail V. Matz Auxiliary functions for the DESeq2 package to simulate read counts according to the null hypothesis (i.e., with empirical sample size factors, per-gene total counts and dispersions, but without effects of predictor variables) and to compute the empirical false discovery rate. License GPL-3 Depends DESeq2,GenomicRanges NeedsCompilation no Repository CRAN Date/Publication :55:36 R topics documented: empiricalfdr.deseq2-package empiricalfdr fdrbicurve fdrtable simulatecounts Index 9 1

2 2 empiricalfdr.deseq2-package empiricalfdr.deseq2-package Simulation-Based False Discovery Rate in RNA-Seq Details Auxiliary functions for the DESeq2 package to simulate read counts according to the null hypothesis (i.e., with empirical sample size factors, per-gene total counts and dispersions, but without effects of predictor variables) and to compute the empirical false discovery rate. Package: empiricalfdr.deseq2 Type: Package Version: Date: License: GPL-3 The key function is simulatecounts, which takes a fitted DESeq2 data object as an input and returns a simulated data object with the same sample size factors, total counts and dispersions for each gene as in real data, but without the effect of predictor variables. Functions fdrtable, fdrbicurve and empiricalfdr compare the DESeq2 results obtained for the real and simulated data, compute the empirical false discovery rate (the ratio of the number of differentially expressed genes detected in the simulated data and their number in the real data) and plot the results. Mikhail V. Matz Maintainer: Mikhail V. Matz <[email protected]>

3 empiricalfdr 3 empiricalfdr Computing the p-value cutoff to achieve a given FDR. This function calculates the cutoff at which a particular false discovery rate is observed using loess smoothing and interpolation. Usage empiricalfdr(fdr.table, FDR = 0.1, maxlogp = 5, plot = FALSE, span = 0.1,...) Arguments Value fdr.table FDR The output of fdrtable(): a dataframe listing p-value cutoffs and the number of null hypothesis rejections at each cutoff in the real and simulated datasets. The target false discovery rate. maxlogp Maximal negative decimal logarithm of the p-value for plotting (the default, 5, implies the data for p-values better than 10e-5 will not be plotted) plot span Whether to produce a plot. span parameter for loess smoothing.... Additional plotting parameters. The function returns a single value, which is the p-value cutoff at which the target FDR is observed. With plot = TRUE, also plots the observed experimental FDRs with the loess smoother. Mikhail V. Matz
: a dataframe listing p-value cutoffs and the number of null hypothesis rejections at each cutoff in the real and simulated datasets. The target false discovery rate.")
4 4 fdrbicurve fdrbicurve Plots the numbers of null hypothesis rejections Plots the numbers of null hypothesis rejections in real data and data simulated under null hypothesis (false positives) Usage fdrbicurve(fdr.table, maxlogp = 5,...) Arguments fdr.table The output of fdrtable(): a dataframe listing p-value cutoffs and the number of null hypothesis rejections at each cutoff in the real and simulated datasets. maxlogp Maximal negative decimal logarithm of the p-value for plotting (the default, 5, implies the data for p-values better than 10e-5 will not be plotted)... Additional plotting parameters.

5 fdrtable 5 Value The plot is designed to ascertain that the number of discoveries in real data (black line) indeed exceeds the number of false positives (red line) across the range of p-value cutoffs. The grey dotted line is the number of discoveries expected under uniform distribution of p-values. Mikhail V. Matz fdrtable Computes false discovery rates for a series of p-value cutoffs. Given vectors of p-values from real data and data simulated under a null hypothesis, produces a table listing the number of null hypothesis rejections under a range of p-value cutoffs in real and simulated data.

6 6 fdrtable Usage fdrtable(real.p, sim.p) Arguments real.p sim.p Vector of p-values in the real data. Vector of p-values in the simulated data. Value The function returns a dataframe listing p-value cutoffs, in steps of 0.1 on the decimal log scale, the number of null hypothesis rejections at each cutoff in real and simulated datasets, and their ratio (the false discovery rate). Mikhail V. Matz

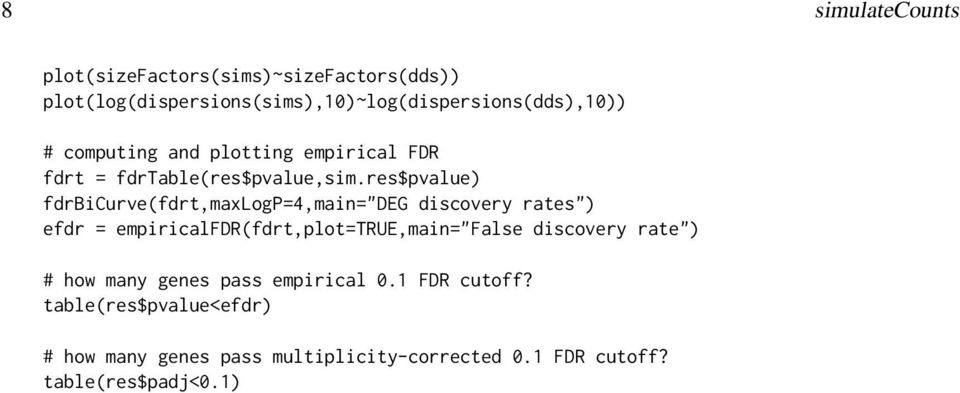
7 simulatecounts 7 simulatecounts Simulating RNA-seq read counts Usage This function takes a fitted DESeq2 data object as an input and returns a simulated data object with the same sample size factors, total counts and dispersions for each gene as in real data, but without the effect of predictor variables. simulatecounts(deseq.object) Arguments deseq.object DESeq2 data object, with estimated size factors and dispersions (output of DE- Seq() function). Details Value For each gene, the total counts are randomly resampled into different samples. The estimated pergene dispersions are understood as the suare of the coefficient of variation and used to simulate random deviations in per-sample assignment probability. The probabilities of per-sample assignment are also weighted by the empirical sample size factors. DESeq2 data object Mikhail V. Matz

8 8 simulatecounts
9 Index Topic DESeq2 Topic RNA-seq Topic false discovery rate Topic simulation empiricalfdr.deseq2 (empiricalfdr.deseq2-package), 2 empiricalfdr.deseq2-package, 2 9
, 2 empiricalfdr.")
Package dunn.test. January 6, 2016
 Version 1.3.2 Date 2016-01-06 Package dunn.test January 6, 2016 Title Dunn's Test of Multiple Comparisons Using Rank Sums Author Alexis Dinno Maintainer Alexis Dinno
Package tagcloud. R topics documented: July 3, 2015
 Package tagcloud July 3, 2015 Type Package Title Tag Clouds Version 0.6 Date 2015-07-02 Author January Weiner Maintainer January Weiner Description Generating Tag and Word Clouds.
Statistics in Retail Finance. Chapter 2: Statistical models of default
 Statistics in Retail Finance 1 Overview > We consider how to build statistical models of default, or delinquency, and how such models are traditionally used for credit application scoring and decision
Package GSA. R topics documented: February 19, 2015
 Package GSA February 19, 2015 Title Gene set analysis Version 1.03 Author Brad Efron and R. Tibshirani Description Gene set analysis Maintainer Rob Tibshirani Dependencies impute
Package survpresmooth
 Package survpresmooth February 20, 2015 Type Package Title Presmoothed Estimation in Survival Analysis Version 1.1-8 Date 2013-08-30 Author Ignacio Lopez de Ullibarri and Maria Amalia Jacome Maintainer
Package missforest. February 20, 2015
 Type Package Package missforest February 20, 2015 Title Nonparametric Missing Value Imputation using Random Forest Version 1.4 Date 2013-12-31 Author Daniel J. Stekhoven Maintainer
Package bigdata. R topics documented: February 19, 2015
 Type Package Title Big Data Analytics Version 0.1 Date 2011-02-12 Author Han Liu, Tuo Zhao Maintainer Han Liu Depends glmnet, Matrix, lattice, Package bigdata February 19, 2015 The
Package retrosheet. April 13, 2015
 Type Package Package retrosheet April 13, 2015 Title Import Professional Baseball Data from 'Retrosheet' Version 1.0.2 Date 2015-03-17 Maintainer Richard Scriven A collection of tools
Package cpm. July 28, 2015
 Package cpm July 28, 2015 Title Sequential and Batch Change Detection Using Parametric and Nonparametric Methods Version 2.2 Date 2015-07-09 Depends R (>= 2.15.0), methods Author Gordon J. Ross Maintainer
Package HHG. July 14, 2015
 Type Package Package HHG July 14, 2015 Title Heller-Heller-Gorfine Tests of Independence and Equality of Distributions Version 1.5.1 Date 2015-07-13 Author Barak Brill & Shachar Kaufman, based in part
Practical Differential Gene Expression. Introduction
 Practical Differential Gene Expression Introduction In this tutorial you will learn how to use R packages for analysis of differential expression. The dataset we use are the gene-summarized count data
Package MDM. February 19, 2015
 Type Package Title Multinomial Diversity Model Version 1.3 Date 2013-06-28 Package MDM February 19, 2015 Author Glenn De'ath ; Code for mdm was adapted from multinom in the nnet package
From Reads to Differentially Expressed Genes. The statistics of differential gene expression analysis using RNA-seq data
 From Reads to Differentially Expressed Genes The statistics of differential gene expression analysis using RNA-seq data experimental design data collection modeling statistical testing biological heterogeneity
Package TSfame. February 15, 2013
 Package TSfame February 15, 2013 Version 2012.8-1 Title TSdbi extensions for fame Description TSfame provides a fame interface for TSdbi. Comprehensive examples of all the TS* packages is provided in the
Package ChannelAttribution
 Type Package Package ChannelAttribution October 10, 2015 Title Markov Model for the Online Multi-Channel Attribution Problem Version 1.2 Date 2015-10-09 Author Davide Altomare and David Loris Maintainer
Package MBA. February 19, 2015. Index 7. Canopy LIDAR data
 Version 0.0-8 Date 2014-4-28 Title Multilevel B-spline Approximation Package MBA February 19, 2015 Author Andrew O. Finley , Sudipto Banerjee Maintainer Andrew
Package sendmailr. February 20, 2015
 Version 1.2-1 Title send email using R Package sendmailr February 20, 2015 Package contains a simple SMTP client which provides a portable solution for sending email, including attachment, from within
Package ERP. December 14, 2015
 Type Package Package ERP December 14, 2015 Title Significance Analysis of Event-Related Potentials Data Version 1.1 Date 2015-12-11 Author David Causeur (Agrocampus, Rennes, France) and Ching-Fan Sheu
Tutorial for proteome data analysis using the Perseus software platform
 Tutorial for proteome data analysis using the Perseus software platform Laboratory of Mass Spectrometry, LNBio, CNPEM Tutorial version 1.0, January 2014. Note: This tutorial was written based on the information
Package metafuse. November 7, 2015
 Type Package Package metafuse November 7, 2015 Title Fused Lasso Approach in Regression Coefficient Clustering Version 1.0-1 Date 2015-11-06 Author Lu Tang, Peter X.K. Song Maintainer Lu Tang
p-values and significance levels (false positive or false alarm rates)
") p-values and significance levels (false positive or false alarm rates) Let's say 123 people in the class toss a coin. Call it "Coin A." There are 65 heads. Then they toss another coin. Call it "Coin B."
p-values and significance levels (false positive or false alarm rates) Let's say 123 people in the class toss a coin. Call it "Coin A." There are 65 heads. Then they toss another coin. Call it "Coin B."
Package hazus. February 20, 2015
 Package hazus February 20, 2015 Title Damage functions from FEMA's HAZUS software for use in modeling financial losses from natural disasters Damage Functions (DFs), also known as Vulnerability Functions,
Package uptimerobot. October 22, 2015
 Type Package Version 1.0.0 Title Access the UptimeRobot Ping API Package uptimerobot October 22, 2015 Provide a set of wrappers to call all the endpoints of UptimeRobot API which includes various kind
STATISTICA Formula Guide: Logistic Regression. Table of Contents
 : Table of Contents... 1 Overview of Model... 1 Dispersion... 2 Parameterization... 3 Sigma-Restricted Model... 3 Overparameterized Model... 4 Reference Coding... 4 Model Summary (Summary Tab)... 5 Summary
Package httprequest. R topics documented: February 20, 2015
 Version 0.0.10 Date 2014-09-29 Title Basic HTTP Request Author Eryk Witold Wolski, Andreas Westfeld Package httprequest February 20, 2015 Maintainer Andreas Westfeld HTTP
Package treemap. February 15, 2013
 Type Package Title Treemap visualization Version 1.1-1 Date 2012-07-10 Author Martijn Tennekes Package treemap February 15, 2013 Maintainer Martijn Tennekes A treemap is a space-filling
Optimization of sampling strata with the SamplingStrata package
 Optimization of sampling strata with the SamplingStrata package Package version 1.1 Giulio Barcaroli January 12, 2016 Abstract In stratified random sampling the problem of determining the optimal size
Gene Expression Analysis
 Gene Expression Analysis Jie Peng Department of Statistics University of California, Davis May 2012 RNA expression technologies High-throughput technologies to measure the expression levels of thousands
Package EstCRM. July 13, 2015
 Version 1.4 Date 2015-7-11 Package EstCRM July 13, 2015 Title Calibrating Parameters for the Samejima's Continuous IRT Model Author Cengiz Zopluoglu Maintainer Cengiz Zopluoglu
Comparing Functional Data Analysis Approach and Nonparametric Mixed-Effects Modeling Approach for Longitudinal Data Analysis
 Comparing Functional Data Analysis Approach and Nonparametric Mixed-Effects Modeling Approach for Longitudinal Data Analysis Hulin Wu, PhD, Professor (with Dr. Shuang Wu) Department of Biostatistics &
Package png. February 20, 2015
 Version 0.1-7 Title Read and write PNG images Package png February 20, 2015 Author Simon Urbanek Maintainer Simon Urbanek Depends R (>= 2.9.0)
Package hier.part. February 20, 2015. Index 11. Goodness of Fit Measures for a Regression Hierarchy
 Version 1.0-4 Date 2013-01-07 Title Hierarchical Partitioning Author Chris Walsh and Ralph Mac Nally Depends gtools Package hier.part February 20, 2015 Variance partition of a multivariate data set Maintainer
Package cgdsr. August 27, 2015
 Type Package Package cgdsr August 27, 2015 Title R-Based API for Accessing the MSKCC Cancer Genomics Data Server (CGDS) Version 1.2.5 Date 2015-08-25 Author Anders Jacobsen Maintainer Augustin Luna
Package nortest. R topics documented: July 30, 2015. Title Tests for Normality Version 1.0-4 Date 2015-07-29
 Title Tests for Normality Version 1.0-4 Date 2015-07-29 Package nortest July 30, 2015 Description Five omnibus tests for testing the composite hypothesis of normality. License GPL (>= 2) Imports stats
Course on Functional Analysis. ::: Gene Set Enrichment Analysis - GSEA -
 Course on Functional Analysis ::: Madrid, June 31st, 2007. Gonzalo Gómez, PhD. [email protected] Bioinformatics Unit CNIO ::: Contents. 1. Introduction. 2. GSEA Software 3. Data Formats 4. Using GSEA 5. GSEA
Generalized Linear Models
 Generalized Linear Models We have previously worked with regression models where the response variable is quantitative and normally distributed. Now we turn our attention to two types of models where the
Package CIFsmry. July 10, 2016. Index 6
 Type Package Package CIFsmry July 10, 2016 Title Weighted summary of cumulative incidence functions Version 1.0.1.1 Date 2013-10-10 Author Jianing Li Maintainer Jianing Li Depends R(>= 3.0.1)
RNA-seq. Quantification and Differential Expression. Genomics: Lecture #12
 (2) Quantification and Differential Expression Institut für Medizinische Genetik und Humangenetik Charité Universitätsmedizin Berlin Genomics: Lecture #12 Today (2) Gene Expression per Sources of bias,
Statistical issues in the analysis of microarray data
 Statistical issues in the analysis of microarray data Daniel Gerhard Institute of Biostatistics Leibniz University of Hannover ESNATS Summerschool, Zermatt D. Gerhard (LUH) Analysis of microarray data
Package changepoint. R topics documented: November 9, 2015. Type Package Title Methods for Changepoint Detection Version 2.
 Type Package Title Methods for Changepoint Detection Version 2.2 Date 2015-10-23 Package changepoint November 9, 2015 Maintainer Rebecca Killick Implements various mainstream and
Package neuralnet. February 20, 2015
 Type Package Title Training of neural networks Version 1.32 Date 2012-09-19 Package neuralnet February 20, 2015 Author Stefan Fritsch, Frauke Guenther , following earlier work
Package benford.analysis
 Type Package Package benford.analysis November 17, 2015 Title Benford Analysis for Data Validation and Forensic Analytics Version 0.1.3 Author Carlos Cinelli Maintainer Carlos Cinelli
General Method: Difference of Means. 3. Calculate df: either Welch-Satterthwaite formula or simpler df = min(n 1, n 2 ) 1.
 1.") General Method: Difference of Means 1. Calculate x 1, x 2, SE 1, SE 2. 2. Combined SE = SE1 2 + SE2 2. ASSUMES INDEPENDENT SAMPLES. 3. Calculate df: either Welch-Satterthwaite formula or simpler df = min(n
General Method: Difference of Means 1. Calculate x 1, x 2, SE 1, SE 2. 2. Combined SE = SE1 2 + SE2 2. ASSUMES INDEPENDENT SAMPLES. 3. Calculate df: either Welch-Satterthwaite formula or simpler df = min(n
Package EasyHTMLReport
 Type Package Title EasyHTMLReport Version 0.1.1 Date 2013-08-13 Package EasyHTMLReport Author Yohei Sato Maintainer Yohei Sato February 19, 2015 It is a package
NCSS Statistical Software Principal Components Regression. In ordinary least squares, the regression coefficients are estimated using the formula ( )
") Chapter 340 Principal Components Regression Introduction is a technique for analyzing multiple regression data that suffer from multicollinearity. When multicollinearity occurs, least squares estimates
Chapter 340 Principal Components Regression Introduction is a technique for analyzing multiple regression data that suffer from multicollinearity. When multicollinearity occurs, least squares estimates
Package translater. R topics documented: February 20, 2015. Type Package
 Type Package Package translater February 20, 2015 Title Bindings for the Google and Microsoft Translation APIs Version 1.0 Author Christopher Lucas and Dustin Tingley Maintainer Christopher Lucas
Package hive. January 10, 2011
 Package hive January 10, 2011 Version 0.1-9 Date 2011-01-09 Title Hadoop InteractiVE Description Hadoop InteractiVE, is an R extension facilitating distributed computing via the MapReduce paradigm. It
Package trimtrees. February 20, 2015
 Package trimtrees February 20, 2015 Type Package Title Trimmed opinion pools of trees in a random forest Version 1.2 Date 2014-08-1 Depends R (>= 2.5.0),stats,randomForest,mlbench Author Yael Grushka-Cockayne,
Package copa. R topics documented: August 9, 2016
 Package August 9, 2016 Title Functions to perform cancer outlier profile analysis. Version 1.41.0 Date 2006-01-26 Author Maintainer COPA is a method to find genes that undergo
Pearson's Correlation Tests
 Chapter 800 Pearson's Correlation Tests Introduction The correlation coefficient, ρ (rho), is a popular statistic for describing the strength of the relationship between two variables. The correlation
Package erp.easy. September 26, 2015
 Type Package Package erp.easy September 26, 2015 Title Event-Related Potential (ERP) Data Exploration Made Easy Version 0.6.3 A set of user-friendly functions to aid in organizing, plotting and analyzing
Package smoothhr. November 9, 2015
 Encoding UTF-8 Type Package Depends R (>= 2.12.0),survival,splines Package smoothhr November 9, 2015 Title Smooth Hazard Ratio Curves Taking a Reference Value Version 1.0.2 Date 2015-10-29 Author Artur
Survey, Statistics and Psychometrics Core Research Facility University of Nebraska-Lincoln. Log-Rank Test for More Than Two Groups
 Survey, Statistics and Psychometrics Core Research Facility University of Nebraska-Lincoln Log-Rank Test for More Than Two Groups Prepared by Harlan Sayles (SRAM) Revised by Julia Soulakova (Statistics)
Package fimport. February 19, 2015
 Version 3000.82 Revision 5455 Date 2013-03-15 Package fimport February 19, 2015 Title Rmetrics - Economic and Financial Data Import Author Diethelm Wuertz and many others Depends R (>= 2.13.0), methods,
Prediction of Business Process Model Quality based on Structural Metrics
 Prediction of Business Process Model Quality based on Structural Metrics Laura Sánchez-González 1, Félix García 1, Jan Mendling 2, Francisco Ruiz 1, Mario Piattini 1 1 Alarcos Research Group, TSI Department,
Package plan. R topics documented: February 20, 2015
 Package plan February 20, 2015 Version 0.4-2 Date 2013-09-29 Title Tools for project planning Author Maintainer Depends R (>= 0.99) Supports the creation of burndown
Package ATE. R topics documented: February 19, 2015. Type Package Title Inference for Average Treatment Effects using Covariate. balancing.
 Package ATE February 19, 2015 Type Package Title Inference for Average Treatment Effects using Covariate Balancing Version 0.2.0 Date 2015-02-16 Author Asad Haris and Gary Chan
Big Data Analytics. Tools and Techniques
 Big Data Analytics Basic concepts of analyzing very large amounts of data Dr. Ing. Morris Riedel Adjunct Associated Professor School of Engineering and Natural Sciences, University of Iceland Research
Package lmertest. July 16, 2015
 Type Package Title Tests in Linear Mixed Effects Models Version 2.0-29 Package lmertest July 16, 2015 Maintainer Alexandra Kuznetsova Depends R (>= 3.0.0), Matrix, stats, methods, lme4 (>=
> plot(exp.btgpllm, main = "treed GP LLM,", proj = c(1)) > plot(exp.btgpllm, main = "treed GP LLM,", proj = c(2)) quantile diff (error)
) > plot(exp.btgpllm, main = treed GP LLM,, proj = c(2)) quantile diff (error)") > plot(exp.btgpllm, main = "treed GP LLM,", proj = c(1)) > plot(exp.btgpllm, main = "treed GP LLM,", proj = c(2)) 0.4 0.2 0.0 0.2 0.4 treed GP LLM, mean treed GP LLM, 0.00 0.05 0.10 0.15 0.20 x1 x1 0.4
> plot(exp.btgpllm, main = "treed GP LLM,", proj = c(1)) > plot(exp.btgpllm, main = "treed GP LLM,", proj = c(2)) 0.4 0.2 0.0 0.2 0.4 treed GP LLM, mean treed GP LLM, 0.00 0.05 0.10 0.15 0.20 x1 x1 0.4
Regression Analysis: A Complete Example
 Regression Analysis: A Complete Example This section works out an example that includes all the topics we have discussed so far in this chapter. A complete example of regression analysis. PhotoDisc, Inc./Getty
Package TRADER. February 10, 2016
 Type Package Package TRADER February 10, 2016 Title Tree Ring Analysis of Disturbance Events in R Version 1.2-1 Date 2016-02-10 Author Pavel Fibich , Jan Altman ,
Comparative genomic hybridization Because arrays are more than just a tool for expression analysis
 Microarray Data Analysis Workshop MedVetNet Workshop, DTU 2008 Comparative genomic hybridization Because arrays are more than just a tool for expression analysis Carsten Friis ( with several slides from
2013 MBA Jump Start Program. Statistics Module Part 3
 2013 MBA Jump Start Program Module 1: Statistics Thomas Gilbert Part 3 Statistics Module Part 3 Hypothesis Testing (Inference) Regressions 2 1 Making an Investment Decision A researcher in your firm just
SAS Software to Fit the Generalized Linear Model
 SAS Software to Fit the Generalized Linear Model Gordon Johnston, SAS Institute Inc., Cary, NC Abstract In recent years, the class of generalized linear models has gained popularity as a statistical modeling
Two-Group Hypothesis Tests: Excel 2013 T-TEST Command
 Two group hypothesis tests using Excel 2013 T-TEST command 1 Two-Group Hypothesis Tests: Excel 2013 T-TEST Command by Milo Schield Member: International Statistical Institute US Rep: International Statistical
The Variability of P-Values. Summary
 The Variability of P-Values Dennis D. Boos Department of Statistics North Carolina State University Raleigh, NC 27695-8203 [email protected] August 15, 2009 NC State Statistics Departement Tech Report
Tutorial 5: Hypothesis Testing
 Tutorial 5: Hypothesis Testing Rob Nicholls [email protected] MRC LMB Statistics Course 2014 Contents 1 Introduction................................ 1 2 Testing distributional assumptions....................
ITSM-R Reference Manual
 ITSM-R Reference Manual George Weigt June 5, 2015 1 Contents 1 Introduction 3 1.1 Time series analysis in a nutshell............................... 3 1.2 White Noise Variance.....................................
Minería de Datos ANALISIS DE UN SET DE DATOS.! Visualization Techniques! Combined Graph! Charts and Pies! Search for specific functions
 Minería de Datos ANALISIS DE UN SET DE DATOS! Visualization Techniques! Combined Graph! Charts and Pies! Search for specific functions Data Mining on the DAG ü When working with large datasets, annotation
Package AMORE. February 19, 2015
 Encoding UTF-8 Version 0.2-15 Date 2014-04-10 Title A MORE flexible neural network package Package AMORE February 19, 2015 Author Manuel Castejon Limas, Joaquin B. Ordieres Mere, Ana Gonzalez Marcos, Francisco
Package SHELF. February 5, 2016
 Type Package Package SHELF February 5, 2016 Title Tools to Support the Sheffield Elicitation Framework (SHELF) Version 1.1.0 Date 2016-01-29 Author Jeremy Oakley Maintainer Jeremy Oakley
Business Statistics. Successful completion of Introductory and/or Intermediate Algebra courses is recommended before taking Business Statistics.
 Business Course Text Bowerman, Bruce L., Richard T. O'Connell, J. B. Orris, and Dawn C. Porter. Essentials of Business, 2nd edition, McGraw-Hill/Irwin, 2008, ISBN: 978-0-07-331988-9. Required Computing
LOGNORMAL MODEL FOR STOCK PRICES
 LOGNORMAL MODEL FOR STOCK PRICES MICHAEL J. SHARPE MATHEMATICS DEPARTMENT, UCSD 1. INTRODUCTION What follows is a simple but important model that will be the basis for a later study of stock prices as
The Wondrous World of fmri statistics
 Outline The Wondrous World of fmri statistics FMRI data and Statistics course, Leiden, 11-3-2008 The General Linear Model Overview of fmri data analysis steps fmri timeseries Modeling effects of interest
Factors affecting online sales
 Factors affecting online sales Table of contents Summary... 1 Research questions... 1 The dataset... 2 Descriptive statistics: The exploratory stage... 3 Confidence intervals... 4 Hypothesis tests... 4
Cross Validation techniques in R: A brief overview of some methods, packages, and functions for assessing prediction models.
 Cross Validation techniques in R: A brief overview of some methods, packages, and functions for assessing prediction models. Dr. Jon Starkweather, Research and Statistical Support consultant This month
Step-by-Step Guide to Basic Expression Analysis and Normalization
 Step-by-Step Guide to Basic Expression Analysis and Normalization Page 1 Introduction This document shows you how to perform a basic analysis and normalization of your data. A full review of this document
Package CoImp. February 19, 2015
 Title Copula based imputation method Date 2014-03-01 Version 0.2-3 Package CoImp February 19, 2015 Author Francesca Marta Lilja Di Lascio, Simone Giannerini Depends R (>= 2.15.2), methods, copula Imports
Package pdfetch. R topics documented: July 19, 2015
 Package pdfetch July 19, 2015 Imports httr, zoo, xts, XML, lubridate, jsonlite, reshape2 Type Package Title Fetch Economic and Financial Time Series Data from Public Sources Version 0.1.7 Date 2015-07-15
Package sjdbc. R topics documented: February 20, 2015
 Package sjdbc February 20, 2015 Version 1.5.0-71 Title JDBC Driver Interface Author TIBCO Software Inc. Maintainer Stephen Kaluzny Provides a database-independent JDBC interface. License
Package CRM. R topics documented: February 19, 2015
 Package CRM February 19, 2015 Title Continual Reassessment Method (CRM) for Phase I Clinical Trials Version 1.1.1 Date 2012-2-29 Depends R (>= 2.10.0) Author Qianxing Mo Maintainer Qianxing Mo
Simple Linear Regression Inference
 Simple Linear Regression Inference 1 Inference requirements The Normality assumption of the stochastic term e is needed for inference even if it is not a OLS requirement. Therefore we have: Interpretation
Statistics I for QBIC. Contents and Objectives. Chapters 1 7. Revised: August 2013
 Statistics I for QBIC Text Book: Biostatistics, 10 th edition, by Daniel & Cross Contents and Objectives Chapters 1 7 Revised: August 2013 Chapter 1: Nature of Statistics (sections 1.1-1.6) Objectives
Two-Sample T-Tests Assuming Equal Variance (Enter Means)
") Chapter 4 Two-Sample T-Tests Assuming Equal Variance (Enter Means) Introduction This procedure provides sample size and power calculations for one- or two-sided two-sample t-tests when the variances of
Chapter 4 Two-Sample T-Tests Assuming Equal Variance (Enter Means) Introduction This procedure provides sample size and power calculations for one- or two-sided two-sample t-tests when the variances of
Package RDAVIDWebService
 Type Package Package RDAVIDWebService November 17, 2015 Title An R Package for retrieving data from DAVID into R objects using Web Services API. Version 1.9.0 Date 2014-04-15 Author Cristobal Fresno and
Package bigrf. February 19, 2015
 Version 0.1-11 Date 2014-05-16 Package bigrf February 19, 2015 Title Big Random Forests: Classification and Regression Forests for Large Data Sets Maintainer Aloysius Lim OS_type
Package hoarder. June 30, 2015
 Type Package Title Information Retrieval for Genetic Datasets Version 0.1 Date 2015-06-29 Author [aut, cre], Anu Sironen [aut] Package hoarder June 30, 2015 Maintainer Depends
Maximally Selected Rank Statistics in R
 Maximally Selected Rank Statistics in R by Torsten Hothorn and Berthold Lausen This document gives some examples on how to use the maxstat package and is basically an extention to Hothorn and Lausen (2002).
The F distribution and the basic principle behind ANOVAs. Situating ANOVAs in the world of statistical tests
 Tutorial The F distribution and the basic principle behind ANOVAs Bodo Winter 1 Updates: September 21, 2011; January 23, 2014; April 24, 2014; March 2, 2015 This tutorial focuses on understanding rather
Package brewdata. R topics documented: February 19, 2015. Type Package
 Type Package Package brewdata February 19, 2015 Title Extracting Usable Data from the Grad Cafe Results Search Version 0.4 Date 2015-01-29 Author Nathan Welch Maintainer Nathan Welch
Two-Sample T-Tests Allowing Unequal Variance (Enter Difference)
") Chapter 45 Two-Sample T-Tests Allowing Unequal Variance (Enter Difference) Introduction This procedure provides sample size and power calculations for one- or two-sided two-sample t-tests when no assumption
Chapter 45 Two-Sample T-Tests Allowing Unequal Variance (Enter Difference) Introduction This procedure provides sample size and power calculations for one- or two-sided two-sample t-tests when no assumption
Package hybridensemble
 Type Package Package hybridensemble May 30, 2015 Title Build, Deploy and Evaluate Hybrid Ensembles Version 1.0.0 Date 2015-05-26 Imports randomforest, kernelfactory, ada, rpart, ROCR, nnet, e1071, NMOF,
The power of a test is the of. by using a particular and a. value of the that is an to the value
 DEFINITION The power of a test is the of a hypothesis. The of the is by using a particular and a value of the that is an to the value assumed in the. POWER AND THE DESIGN OF EXPERIMENTS Just as is a common