5. GIS, Cartography and Visualization of Glacier Terrain
|
|
|
- Ferdinand Atkins
- 10 years ago
- Views:
Transcription
1 5. GIS, Cartography and Visualization of Glacier Terrain 5.1. Garhwal Himalayan Glaciers Introduction GIS is the computer system for capturing, storing, analyzing and visualization of spatial and non-spatial data. GIS has been established as separate discipline in the end of decades of 1980s. Several earth scientists often use GIS as simply mapping tools (Wright et al 1997), assuming the main goal is to merely generate remarkable and attractive maps, which gives expression of shorter subject matter of discipline. However, GIS is not only related with creating maps on a computer for a variety of descriptive and analytical purposes. It can also help planners and analysts visualize data to better understand patterns and concentrations of spatial phenomena and it can assist in natural resource management of country in logical and analytical manner. In addition GIS has the useful ability to portray layers of information, to help uncover spatial relationships among multiple sets of data. It can be made based on digitizing each data layer map of a distinct theme or a classified image (e.g. from a satellite, aerial photo) or a scanned map (e.g. from a field survey). The latter two represent information storage in raster format (on a cell by cell basis) with regular grid spacing whereas the former contains only the boundary of a specific entity in vector format (Figure 5-1). Number of attributes related with specific themes can be stored by vector format in its database. However the raster format is better for storing continuous fields, such as elevation values of a DTM (see section 2.4.5). The use of GIS in glaciology has progressed relatively slowly in India, and 125

2 limited to glacier change and mapping studies most probably due to (1) the emphasis given to field investigations in glaciology and the lack of focused on GIS technology and (2) GIS education and technical training for glaciology as the discipline. However outside India, application of GIS in glaciology has been established in automated glacier mapping (Bolch et al 2007, Paul et al 2001), GLOFs modeling (Huggel et al 2003), glacier hazard modeling (Huggel et al 2004), glacial geomorphology (O'Sullivan and Unwin, 2003), alpine valley morphometry and glacial valley networks (e.g. Duncan et al 1998), glacier database management (Mennis and Fountain, 1997), glacier flow direction (Kääb, 2005), application of internet GIS in glaciers database (Li et al 2003) and identification of potentially dangerous glacial lakes (PDGLs) (Bolch et al 2008b). The use of geographic information systems (GIS) has seen a steady increase since the first PCbased GIS software developed in the latter half of the 1980s. Prior to that, GIS was run on mainframe computers and was a relatively crude technology by today s standards. In current scenario GIS software s has provided wizard based tools which is easy and very simple to understand and perform GIS operation in few seconds or minutes. However no software has the comprehensive tools for GIS operations but availability of conversion facility provided by standard GIS software it can be possible to work with different GIS platforms. Thus several popular softwares such as ArcGIS 9.3 with the extensions Spatial Analyst (for raster data processing) and 3D Analyst (for 3D visualization), ERDAS Imagine 10, ENVI - 4.7, SAGA, and Geomatica 9.2 have been extensively used for present work e.g. glacier database creation and management, image processing, DEM generation, orthorectification and radiometric correction. SAGA is only free ware software in above discussed softwares and can be easily downloadable from The use of software for particular application (e.g. DTM generation) is described in their related sections. 126

3 Figure 5-1 Representation of real world objects in the vector and raster domain. 127

4 Deriving glacier parameters The Geological Survey of India (GSI) compiled a glacier inventory for the Indian Himalayas based on Survey of India topographic maps, vertical aerial photographs and satellite images wherever available (Kaul, 1999). However, this information is assembled in statistical records which are not accessible in GIS database (Kulkarni, 2007). Recently, GSI further improved and revised Indian Himalayan glacier inventory (Raina and Srivastava, 2008; Sangewar and Shukla, 2009). However, this glacier inventory has included glacier parameters (e.g. minimum and maximum elevation) using manual cartography. Extraction of glacier parameters for a larger number of glaciers by traditional methods (e.g. manual cartography using planimeter) is time intensive, biased by human interpretation and almost unreproducible. The use of GIS technology provides uncomplicated, less time intensive and reproducible results. In addition GIS offers following advantages: (1) spatial coverage storage (e.g. 2D glacier outlines) in a vector layer for tracing of temporal geometry changes, (2) storage of associated glacier parameters (e.g. area, perimeter and ID) in a attribute data base, (3) retrieval of 3D glacier parameters and topographic indices using corresponding DTM, (4) wizard based tools and programming allows fully automatic processing of all data and (5) 3D visualization using 2D glacier outlines and satellite data draped on DEM by GIS software s. Glacier parameters derived from GIS technology is valuable assets for glaciology and hydrological modeling (Braithwaite, 2009). In present study, slope and aspect maps were generated using spatial analyst extension of ArcGIS 9.3. slope and average aspect of each polygon (glacier) was calculated from ASTER DEM (2006) automatically by zonal statistical tool (ArcGIS). 128
.")
5

6 Glacier GIS database structure and relevance The first important task in building the Garhwal Himalayas GIS was the selection of the primary coordinate system. Universal Transverse Mercator projection (UTM) WGS-84 with the ellipsoid is the most widely projection used in world. The available Indian topography maps have the Lambert conical projection system with Everest datum. Open source satellite data (e.g. Landsat ETM+) and DEMs are accessible in UTM with WGS84. Current GIS software s offers abundant potential for projection conversion facilities. For the uniformity in spatial database, UTM projection with WGS-84 system was used in the present study. The vector data were presented in point data (e.g. weather stations, settlements and elevation points) and line data (such as contour lines and Rivers) and polygon data (e.g., glaciers and lakes). The vector data and raster data (such as scanned topographic maps, satellite data and different DTM) were stored in ArcGIS geodatabase structure. Geodatabase structure is most suitable for stores both vector and raster data in single file which supports by Microsoft access. The vector data also contain attribute data. Selected map layers (vector and raster) are illustrated in Figure 5-2. In the present study, fourteen glacier parameters such as orientation, name, morphology type, basin name and minimum, maximum, mean, median, standard deviation and range of elevations, average slope and average aspect, area, IDs were attached with corresponding glacier polygon and were stored in database (Appendix). The unique IDs were assigned to each glacier polygon derived from Corona images and same IDs provided to corresponding glacier polygon derived from ASTER imagery for the comparison of every glacier area from 1968 to

7 5.2. Cartography and 3D Visualization Introduction Cartography is the study and practice of making maps or globes. Maps have traditionally been made using pen and paper, however the beginning and spread of computers has revolutionized cartography. Now these days earth surface features can be interactively visualized by digital cartography. Innovative GIS tools and geo-visualization allow for more interactive maps including the ability to explore different layers of the map, to zoom in or out, and to change the visual appearance of the map. The Garhwal Himalayas is high mountainous regions with moving glacial bodies. A high Himalayan mountain is a very dynamic space, in which over the years, many different geomorphic processes produced changes in surface. Digital cartographic techniques enhance the surrounding relief properties to understand glacier-topography interaction using GIS software s. This facilitate for the viewer to understand the moving glacial topography. The digital technologies available nowadays introduce various ways to visualize the changes. The previous research has concentrated on the possibilities and limitations of the visualization of the glacier changes in the high mountains (Kääb et al 2003, Paul et al 2003). DTM is an important data source for the nearly realistic production of maps and visualizations in the high mountains. Many GIS softwares now include photorealistic display capabilities. Highresolution imagery can be draped over DTMs to display complex glacial landscapes using virtual fly-through utilities which helps user to understand high mountain environment. Kääb (1998) and Kaufmann and Ladstädter (2003) successfully represented the movement of glaciers and rock glaciers. 131

8 Overview and detailed maps The two levels of study area map were generated for spatial details of the Garhwal Himalayas. A study area map of Garhwal Himalayas with the surrounding mountain systems was generated in introduction (Chapter 1; Figure 1-1) and detailed map of the investigation valleys with glacier coverage also shown in introduction (Chapter 1; Figure 1-14). All maps were created using ESRI ArcGIS 9.3. SRTM DTM with resolution of 30 arc seconds (approximately 1 km) was used as the base for the relief of the small-scale map (Chapter 1; Figure 1-1). In addition SRTM data of 90 m was used for large scale map of study area (Chapter 1; Figure 1-14). The class interval between the altitude levels was 1000 m selected for different color codes. The unique color code for representation of relief enhanced the view ability. Additional hill shading in symbology was used for appearance of the relief shade. The coordinate grid in degree and minute was used. The labels were designed for a particular object (e.g. city names or country names) and the uniform fonts, sizes and colors were used for presented map with north direction and scale. The location of figures presented in different chapters also shown in study area maps. Study area coverage of glaciers was presented by two sets of maps (a) location of study area in Indian Himalayas and (b) clean and debris-covered ice coverage in study region (Chapter 1; Figure 1-14). Bhagirathi and Saraswati/Alaknanda basin were differentiated by different symbols and were presented by transparent tool of symbology. The location of climate stations was also presented. 132
 was used as the base for the relief of the small-scale map (Chapter 1; Figure 1-1).")
9
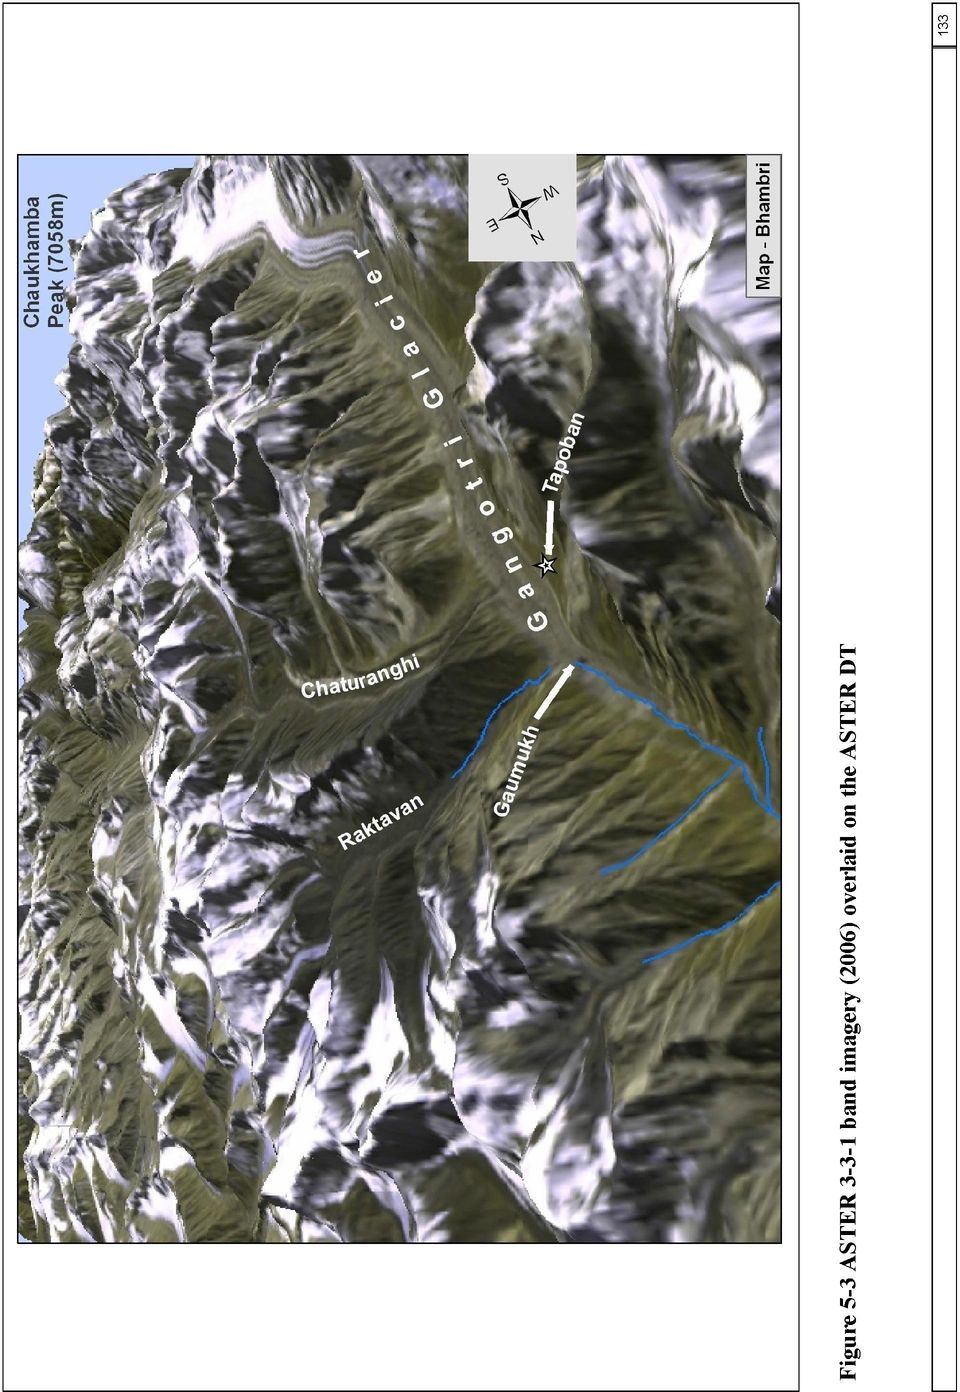
10 Thematic Maps In addition to the maps, different thematic maps such as geological, climate and drainage maps were also prepared using various sources. Geological map was generated using base map of western Himalayas (Thakur and Rawat 1992) showing important structure of area with their age. Rock units or geologic strata were shown by different color and symbols (Figure 1-2). In addition, map of climate stations representing climate stations of Garhwal Himalayas were also presented in climate map (Figure 1-3). The background of this map is presented by SRTM DEM with hill shade effect. Climate diagrams of Mukhim and Bhojbasa were prepared by MAAT software and both were integrated in Photoshop (Figure 1-4). The climate diagrams were shown the temperature and the precipitation conditions of Mukhim and Bhojbasa. Drainage map of study region was generated by vector poly lines of streams in Garhwal Himalayas which was overlaid on SRTM DEM with hill shade effect. Streams were digitized from map of Uttarakhand. Junction of streams (prayag) was also presented in drainage map (Figure 1-5). The location of bench mark glaciers in Indian Himalayas was presented in the map of India (Figure 1-12) D visualization The principle objective of 3D visualization in the present investigation is easy to use realistic representation of the change in glacier landscape. For this purpose multi-temporal satellite images and glacier outlines were draped on DTM using ArcScene. For the present study, ASTER imagery (2006) was draped on ASTER DTM (2006) (Figure 5-3). ASTER sensor has no channel in the blue spectral range, therefore to obtain a good contrast and color perception, green band was assigned for blue band and infrared band was assigned for red band. The resulting false-color image in this way is dominated by the green, but appears very familiar to 134
.")
11 the eye. The vegetation is appearing with green, rocks and debris with gray, snow and ice with white and water with blue colours. Just these four surface materials are in the high mountains and are dominant in this work can be clearly separated from each other. Also, the lateral moraines near the glacier surfaces occur very clearly. The image was created with ArcScene 9.3. This band combination also provided good results for the dry Andean (Kamp et al 2004). The retreat of Garhwal glaciers from 1968 to 2006 based on Corona and ASTER data were illustrated in Figure 6-5. The vector polylines extracted from different satellite data were overlaid on ASTER image (2006) and draped on ASTER DTM. The glacier extents of different years were presented by diverse colors. 135
.")
A GIS helps you answer questions and solve problems by looking at your data in a way that is quickly understood and easily shared.
 A Geographic Information System (GIS) integrates hardware, software, and data for capturing, managing, analyzing, and displaying all forms of geographically referenced information. GIS allows us to view,
Introduction to GIS (Basics, Data, Analysis) & Case Studies. 13 th May 2004. Content. What is GIS?
 & Case Studies. 13 th May 2004. Content. What is GIS?") Introduction to GIS (Basics, Data, Analysis) & Case Studies 13 th May 2004 Content Introduction to GIS Data concepts Data input Analysis Applications selected examples What is GIS? Geographic Information
Introduction to GIS (Basics, Data, Analysis) & Case Studies 13 th May 2004 Content Introduction to GIS Data concepts Data input Analysis Applications selected examples What is GIS? Geographic Information
GEOGRAPHIC INFORMATION SYSTEMS CERTIFICATION
 GEOGRAPHIC INFORMATION SYSTEMS CERTIFICATION GIS Syllabus - Version 1.2 January 2007 Copyright AICA-CEPIS 2009 1 Version 1 January 2007 GIS Certification Programme 1. Target The GIS certification is aimed
3D VISUALIZATION OF GEOTHERMAL WELLS DIRECTIONAL SURVEYS AND INTEGRATION WITH DIGITAL ELEVATION MODEL (DEM)
") Presented at Short Course VII on Exploration for Geothermal Resources, organized by UNU-GTP, GDC and KenGen, at Lake Bogoria and Lake Naivasha, Kenya, Oct. 27 Nov. 18, 2012. GEOTHERMAL TRAINING PROGRAMME
Presented at Short Course VII on Exploration for Geothermal Resources, organized by UNU-GTP, GDC and KenGen, at Lake Bogoria and Lake Naivasha, Kenya, Oct. 27 Nov. 18, 2012. GEOTHERMAL TRAINING PROGRAMME
WHAT IS GIS - AN INRODUCTION
 WHAT IS GIS - AN INRODUCTION GIS DEFINITION GIS is an acronym for: Geographic Information Systems Geographic This term is used because GIS tend to deal primarily with geographic or spatial features. Information
Data source, type, and file naming convention
 Exercise 1: Basic visualization of LiDAR Digital Elevation Models using ArcGIS Introduction This exercise covers activities associated with basic visualization of LiDAR Digital Elevation Models using ArcGIS.
What is GIS? Geographic Information Systems. Introduction to ArcGIS. GIS Maps Contain Layers. What Can You Do With GIS? Layers Can Contain Features
 What is GIS? Geographic Information Systems Introduction to ArcGIS A database system in which the organizing principle is explicitly SPATIAL For CPSC 178 Visualization: Data, Pixels, and Ideas. What Can
ArcGIS Data Models Practical Templates for Implementing GIS Projects
 ArcGIS Data Models Practical Templates for Implementing GIS Projects GIS Database Design According to C.J. Date (1995), database design deals with the logical representation of data in a database. The
APPLICATION OF GOOGLE EARTH FOR THE DEVELOPMENT OF BASE MAP IN THE CASE OF GISH ABBAY SEKELA, AMHARA STATE, ETHIOPIA
 APPLICATION OF GOOGLE EARTH FOR THE DEVELOPMENT OF BASE MAP IN THE CASE OF GISH ABBAY SEKELA, AMHARA STATE, ETHIOPIA Abineh Tilahun Department of Geography and environmental studies, Adigrat University,
Create a folder on your network drive called DEM. This is where data for the first part of this lesson will be stored.
 In this lesson you will create a Digital Elevation Model (DEM). A DEM is a gridded array of elevations. In its raw form it is an ASCII, or text, file. First, you will interpolate elevations on a topographic
Metadata for Big River Watershed Geologic and Geomorphic Data
 Metadata for Big River Watershed Geologic and Geomorphic Data Metadata are descriptions and information regarding compiled data. This appendix contains the metadata that describes the compiled data used
Impact of water harvesting dam on the Wadi s morphology using digital elevation model Study case: Wadi Al-kanger, Sudan
 Impact of water harvesting dam on the Wadi s morphology using digital elevation model Study case: Wadi Al-kanger, Sudan H. S. M. Hilmi 1, M.Y. Mohamed 2, E. S. Ganawa 3 1 Faculty of agriculture, Alzaiem
GIS Initiative: Developing an atmospheric data model for GIS. Olga Wilhelmi (ESIG), Jennifer Boehnert (RAP/ESIG) and Terri Betancourt (RAP)
, Jennifer Boehnert (RAP/ESIG) and Terri Betancourt (RAP)") GIS Initiative: Developing an atmospheric data model for GIS Olga Wilhelmi (ESIG), Jennifer Boehnert (RAP/ESIG) and Terri Betancourt (RAP) Unidata seminar August 30, 2004 Presentation Outline Overview
GIS Initiative: Developing an atmospheric data model for GIS Olga Wilhelmi (ESIG), Jennifer Boehnert (RAP/ESIG) and Terri Betancourt (RAP) Unidata seminar August 30, 2004 Presentation Outline Overview
SESSION 8: GEOGRAPHIC INFORMATION SYSTEMS AND MAP PROJECTIONS
 SESSION 8: GEOGRAPHIC INFORMATION SYSTEMS AND MAP PROJECTIONS KEY CONCEPTS: In this session we will look at: Geographic information systems and Map projections. Content that needs to be covered for examination
REGIONAL SEDIMENT MANAGEMENT: A GIS APPROACH TO SPATIAL DATA ANALYSIS. Lynn Copeland Hardegree, Jennifer M. Wozencraft 1, Rose Dopsovic 2 INTRODUCTION
 REGIONAL SEDIMENT MANAGEMENT: A GIS APPROACH TO SPATIAL DATA ANALYSIS Lynn Copeland Hardegree, Jennifer M. Wozencraft 1, Rose Dopsovic 2 ABSTRACT: Regional sediment management (RSM) requires the capability
Understanding Raster Data
 Introduction The following document is intended to provide a basic understanding of raster data. Raster data layers (commonly referred to as grids) are the essential data layers used in all tools developed
ENVI THE PREMIER SOFTWARE FOR EXTRACTING INFORMATION FROM GEOSPATIAL IMAGERY.
 ENVI THE PREMIER SOFTWARE FOR EXTRACTING INFORMATION FROM GEOSPATIAL IMAGERY. ENVI Imagery Becomes Knowledge ENVI software uses proven scientific methods and automated processes to help you turn geospatial
A Method Using ArcMap to Create a Hydrologically conditioned Digital Elevation Model
 A Method Using ArcMap to Create a Hydrologically conditioned Digital Elevation Model High resolution topography derived from LiDAR data is becoming more readily available. This new data source of topography
GIS: Geographic Information Systems A short introduction
 GIS: Geographic Information Systems A short introduction Outline The Center for Digital Scholarship What is GIS? Data types GIS software and analysis Campus GIS resources Center for Digital Scholarship
Remote Sensing, GPS and GIS Technique to Produce a Bathymetric Map
 Remote Sensing, GPS and GIS Technique to Produce a Bathymetric Map Mark Schnur EES 5053 Remote Sensing Fall 2007 University of Texas at San Antonio, Department of Earth and Environmental Science, San Antonio,
Chapter Contents Page No
 Chapter Contents Page No Preface Acknowledgement 1 Basics of Remote Sensing 1 1.1. Introduction 1 1.2. Definition of Remote Sensing 1 1.3. Principles of Remote Sensing 1 1.4. Various Stages in Remote Sensing
Application of Google Earth for flood disaster monitoring in 3D-GIS
 Disaster Management and Human Health Risk II 271 Application of Google Earth for flood disaster monitoring in 3D-GIS M. Mori & Y. L. Chan Department of Information and Computer Science, Kinki University,
LEOworks - a freeware to teach Remote Sensing in Schools
 LEOworks - a freeware to teach Remote Sensing in Schools Wolfgang Sulzer Institute for Geography and Regional Science University of Graz Heinrichstrasse 36, A-8010 Graz/Austria [email protected]
GIS MAPPING FOR IRRIGATION DISTRICT RAPID APPRAISALS Daniel J. Howes 1, Charles M. Burt 2, Stuart W. Styles 3 ABSTRACT
 GIS MAPPING FOR IRRIGATION DISTRICT RAPID APPRAISALS Daniel J. Howes 1, Charles M. Burt 2, Stuart W. Styles 3 ABSTRACT Geographic information system (GIS) mapping is slowly becoming commonplace in irrigation
Notable near-global DEMs include
 Visualisation Developing a very high resolution DEM of South Africa by Adriaan van Niekerk, Stellenbosch University DEMs are used in many applications, including hydrology [1, 2], terrain analysis [3],
ANALYSIS 3 - RASTER What kinds of analysis can we do with GIS?
 ANALYSIS 3 - RASTER What kinds of analysis can we do with GIS? 1. Measurements 2. Layer statistics 3. Queries 4. Buffering (vector); Proximity (raster) 5. Filtering (raster) 6. Map overlay (layer on layer
Digital Remote Sensing Data Processing Digital Remote Sensing Data Processing and Analysis: An Introduction and Analysis: An Introduction
 Digital Remote Sensing Data Processing Digital Remote Sensing Data Processing and Analysis: An Introduction and Analysis: An Introduction Content Remote sensing data Spatial, spectral, radiometric and
Assessment Tasks Pass theory exams at > 70%. Meet, or exceed, outcome criteria for projects and assignments.
 CENTRAL OREGON COMMUNITY COLLEGE: GEOGRAPHIC INFORMATION SYSTEM PROGRAM 1 CENTRAL OREGON COMMUNITY COLLEGE Associate Degree Geographic Information Systems Program Outcome Guide (POG) Program Outcome Guide
Institute of Natural Resources Departament of General Geology and Land use planning Work with a MAPS
 Institute of Natural Resources Departament of General Geology and Land use planning Work with a MAPS Lecturers: Berchuk V.Y. Gutareva N.Y. Contents: 1. Qgis; 2. General information; 3. Qgis desktop; 4.
Adaptation of High Resolution Ikonos Images to Googleearth for Zonguldak Test Field
 Adaptation of High Resolution Ikonos Images to Googleearth for Zonguldak Test Field Umut G. SEFERCIK, Murat ORUC and Mehmet ALKAN, Turkey Key words: Image Processing, Information Content, Image Understanding,
3D Model of the City Using LiDAR and Visualization of Flood in Three-Dimension
 3D Model of the City Using LiDAR and Visualization of Flood in Three-Dimension R.Queen Suraajini, Department of Civil Engineering, College of Engineering Guindy, Anna University, India, [email protected]
Geospatial Software Solutions for the Environment and Natural Resources
 Geospatial Software Solutions for the Environment and Natural Resources Manage and Preserve the Environment and its Natural Resources Our environment and the natural resources it provides play a growing
Image Draping & navigation within Virtual GIS
 Image Draping & navigation within Virtual GIS Draping of Geo Corrected data such as aerial imagery or map data enables virtual 3D field tours to be conducted in an area of interest. This document covers
Aneeqa Syed [Hatfield Consultants] Vancouver GIS Users Group Meeting December 8, 2010
![Aneeqa Syed [Hatfield Consultants] Vancouver GIS Users Group Meeting December 8, 2010](/thumbs/27/11179985.jpg "Aneeqa Syed [Hatfield Consultants] Vancouver GIS Users Group Meeting December 8, 2010") NEAR-REAL-TIME FLOOD MAPPING AND MONITORING SERVICE Aneeqa Syed [Hatfield Consultants] Vancouver GIS Users Group Meeting December 8, 2010 SLIDE 1 MRC Flood Service Project Partners and Client Hatfield
NEAR-REAL-TIME FLOOD MAPPING AND MONITORING SERVICE Aneeqa Syed [Hatfield Consultants] Vancouver GIS Users Group Meeting December 8, 2010 SLIDE 1 MRC Flood Service Project Partners and Client Hatfield
Image Analysis CHAPTER 16 16.1 ANALYSIS PROCEDURES
 CHAPTER 16 Image Analysis 16.1 ANALYSIS PROCEDURES Studies for various disciplines require different technical approaches, but there is a generalized pattern for geology, soils, range, wetlands, archeology,
Geography 3251: Mountain Geography Assignment III: Natural hazards A Case Study of the 1980s Mt. St. Helens Eruption
 Name: Geography 3251: Mountain Geography Assignment III: Natural hazards A Case Study of the 1980s Mt. St. Helens Eruption Learning Objectives: Assigned: May 30, 2012 Due: June 1, 2012 @ 9 AM 1. Learn
APPLY EXCEL VBA TO TERRAIN VISUALIZATION
 APPLY EXCEL VBA TO TERRAIN VISUALIZATION 1 2 Chih-Chung Lin( ), Yen-Ling Lin ( ) 1 Secretariat, National Changhua University of Education. General Education Center, Chienkuo Technology University 2 Dept.
TerraColor White Paper
 TerraColor White Paper TerraColor is a simulated true color digital earth imagery product developed by Earthstar Geographics LLC. This product was built from imagery captured by the US Landsat 7 (ETM+)
Introduction to Imagery and Raster Data in ArcGIS
 Esri International User Conference San Diego, California Technical Workshops July 25, 2012 Introduction to Imagery and Raster Data in ArcGIS Simon Woo slides Cody Benkelman - demos Overview of Presentation
Can GIS Help You Manage Water Resources? Erika Boghici Texas Natural Resources Information Systems
 Can GIS Help You Manage Water Resources? Erika Boghici Texas Natural Resources Information Systems Hydrologic Information System Hydrologic Modeling Arc Hydro Geodatabase Arc Hydro Data Model: combination
A CONCEPT OUTLINE ESTABLISHING THE
 Updated 13 November 2009 A CONCEPT OUTLINE ESTABLISHING THE Philippine GIS Data Clearinghouse (PhilGIS) www.philgis.org Prepared by Al Tongco, Ph.D. Stillwater, Oklahoma, U.S.A. [email protected] Introduction
EO based glacier monitoring
 EO based glacier monitoring THEMES 1. WGMS & GLIMS within GTN G: strategic set up 2. GlobGlacier & Glaciers_cci: EO based products 3. LDCM & Sentinel 2: future monitoring perspectives Frank Paul* Department
Working with Digital Elevation Models and Digital Terrain Models in ArcMap 9
 Working with Digital Elevation Models and Digital Terrain Models in ArcMap 9 1 TABLE OF CONTENTS INTRODUCTION...3 WORKING WITH DIGITAL TERRAIN MODEL (DTM) DATA FROM NRVIS, CITY OF KITCHENER, AND CITY OF
Activity: Using ArcGIS Explorer
 Activity: Using ArcGIS Explorer Requirements You must have ArcGIS Explorer for this activity. Preparation: Download ArcGIS Explorer. The link below will bring you to the ESRI ArcGIS Explorer download page.
Technology Trends In Geoinformation
 Technology Trends In Geoinformation Dato Prof. Sr Dr. Abdul Kadir Bin Taib Department of Survey and Mapping Malaysia (JUPEM) Email: [email protected] www.jupem.gov.my NGIS 2008 3 rd. National GIS Conference
EcoInformatics International Inc.
 1 von 10 03.08.2010 14:25 EcoInformatics International Inc. Home Services - solutions Projects Concepts Tools Links Contact EXPLORING BEAVER HABITAT AND DISTRIBUTION WITH GOOGLE EARTH: THE LONGEST BEAVER
DATA VISUALIZATION GABRIEL PARODI STUDY MATERIAL: PRINCIPLES OF GEOGRAPHIC INFORMATION SYSTEMS AN INTRODUCTORY TEXTBOOK CHAPTER 7
 DATA VISUALIZATION GABRIEL PARODI STUDY MATERIAL: PRINCIPLES OF GEOGRAPHIC INFORMATION SYSTEMS AN INTRODUCTORY TEXTBOOK CHAPTER 7 Contents GIS and maps The visualization process Visualization and strategies
The premier software for extracting information from geospatial imagery.
 Imagery Becomes Knowledge ENVI The premier software for extracting information from geospatial imagery. ENVI Imagery Becomes Knowledge Geospatial imagery is used more and more across industries because
Plan Plus Volume 1 No 1 2002 (117-123)
") Plan Plus Volume 1 No 1 2002 (117-123) APPLICATION OF GIS (GEOGRAPHIC INFORMATION SYSTEM) FOR LANDSLIDE HAZARD ZONATION AND MAPPING DISASTER PRONE AREA: A STUDY OF KULEKHANI WATERSHED, NEPAL Purna Chandra
Plan Plus Volume 1 No 1 2002 (117-123) APPLICATION OF GIS (GEOGRAPHIC INFORMATION SYSTEM) FOR LANDSLIDE HAZARD ZONATION AND MAPPING DISASTER PRONE AREA: A STUDY OF KULEKHANI WATERSHED, NEPAL Purna Chandra
Remote Sensing Method in Implementing REDD+
 Remote Sensing Method in Implementing REDD+ FRIM-FFPRI Research on Development of Carbon Monitoring Methodology for REDD+ in Malaysia Remote Sensing Component Mohd Azahari Faidi, Hamdan Omar, Khali Aziz
GIS Data in ArcGIS. Pay Attention to Data!!!
 GIS Data in ArcGIS Pay Attention to Data!!! 1 GIS Data Models Vector Points, lines, polygons, multi-part, multi-patch Composite & secondary features Regions, dynamic segmentation (routes) Raster Grids,
Cloud-based Geospatial Data services and analysis
 Cloud-based Geospatial Data services and analysis Xuezhi Wang Scientific Data Center Computer Network Information Center Chinese Academy of Sciences 2014-08-25 Outlines 1 Introduction of Geospatial Data
Pima Regional Remote Sensing Program
 Pima Regional Remote Sensing Program Activity Orthophoto GIS Mapping and Analysis Implementing Agency Pima Association of Governments (Tucson, Arizona area Metropolitan Planning Organization) Summary Through
Sample Pages. Free E-mail Newsletter Sign up Today! Learn Through Experience
 Learn Through Experience Sample Pages Sample pages from this product are provided for evaluation purposes. The entire product is available for purchase at www.socialstudies.com or www.teachinteract.com
Relational GIS and Remote Sensing Database System for Al-Salt Area, Jordan
 American J. of Engineering and Applied Sciences 1 (4): 241-247, 2008 ISSN 1941-7020 2008 Science Publications Relational GIS and Remote Sensing Database System for Al-Salt Area, Jordan Eyad H.R. Fadda,
Selecting the appropriate band combination for an RGB image using Landsat imagery
 Selecting the appropriate band combination for an RGB image using Landsat imagery Ned Horning Version: 1.0 Creation Date: 2004-01-01 Revision Date: 2004-01-01 License: This document is licensed under a
Modeling Fire Hazard By Monica Pratt, ArcUser Editor
 By Monica Pratt, ArcUser Editor Spatial modeling technology is growing like wildfire within the emergency management community. In areas of the United States where the population has expanded to abut natural
Andrea Bondì, Irene D Urso, Matteo Ombrelli e Paolo Telaroli (Thetis S.p.A.) Luisa Sterponi e Cesar Urrutia (Spacedat S.r.l.) Water Calesso (Marco
 Luisa Sterponi e Cesar Urrutia (Spacedat S.r.l.) Water Calesso (Marco") Generation of a digital elevation model of the Wadi Lebda basin, Leptis Magna - Lybia Andrea Bondì, Irene D Urso, Matteo Ombrelli e Paolo Telaroli (Thetis S.p.A.) Luisa Sterponi e Cesar Urrutia (Spacedat
Generation of a digital elevation model of the Wadi Lebda basin, Leptis Magna - Lybia Andrea Bondì, Irene D Urso, Matteo Ombrelli e Paolo Telaroli (Thetis S.p.A.) Luisa Sterponi e Cesar Urrutia (Spacedat
Using Google Earth for Environmental Science Research
 Using Google Earth for Environmental Science Research This document is up-to-date as of August 2013. If you have any questions or additions to this material please email [email protected]. Note: this
The Use of Geographic Information Systems in Risk Assessment
 The Use of Geographic Information Systems in Risk Assessment With Specific Focus on the RiVAMP Methodology Presented by Nadine Brown August 27, 2012 Climate Studies Group Mona Climate Change Workshop Presentation
Government 98dn Mapping Social and Environmental Space
 Government 98dn Mapping Social and Environmental Space LAB EXERCISE 5: The Analysis of Fields Objectives of this lab: Visualizing raster data Using Spatial Analyst functions to create new data Analysis
Introduction to GIS. http://libguides.mit.edu/gis
 Introduction to GIS http://libguides.mit.edu/gis 1 Overview What is GIS? Types of Data and Projections What can I do with GIS? Data Sources and Formats Software Data Management Tips 2 What is GIS? 3 Characteristics
Flood Zone Investigation by using Satellite and Aerial Imagery
 Flood Zone Investigation by using Satellite and Aerial Imagery Younes Daneshbod Islamic Azad University-Arsanjan branch Daneshgah Boulevard, Islamid Azad University, Arsnjan, Iran Email: [email protected]
Applying GIS in seismic hazard assessment and data integration for disaster management
 Applying GIS in seismic hazard assessment and data integration for disaster management Rumiana Vatseva, Dimcho Solakov, Emilia Tcherkezova, Stela Simeonova, Petya Trifonova National Institute of Geophysics,
Publishing Hosted 3D Feature Layers. An Esri White Paper September 2015
 An Esri White Paper September 2015 Copyright 2015 Esri All rights reserved. Printed in the United States of America. The information contained in this document is the exclusive property of Esri. This work
STATE OF NEVADA Department of Administration Division of Human Resource Management CLASS SPECIFICATION
 STATE OF NEVADA Department of Administration Division of Human Resource Management CLASS SPECIFICATION TITLE PHOTOGRAMMETRIST/CARTOGRAPHER V 39 6.102 PHOTOGRAMMETRIST/CARTOGRAPHER II 33 6.110 PHOTOGRAMMETRIST/CARTOGRAPHER
Software requirements * :
 Title: Product Type: Developer: Target audience: Format: Software requirements * : Data: Estimated time to complete: Fire Mapping using ASTER Part I: The ASTER instrument and fire damage assessment Part
Remote Sensing and GIS based Approach for Multi-Source Landslide Mapping in Southern Kyrgyzstan
 Remote Sensing and GIS based Approach for Multi-Source Landslide Mapping in Southern Kyrgyzstan DARYA GOLOVKO 1, SIGRID ROESSNER 2, ROBERT BEHLING 3, HANS-ULRICH WETZEL 4 & HERMANN KAUFMANN 5 Southern
GEOGRAPHIC INFORMATION SYSTEMS
 GEOGRAPHIC INFORMATION SYSTEMS WHAT IS A GEOGRAPHIC INFORMATION SYSTEM? A geographic information system (GIS) is a computer-based tool for mapping and analyzing spatial data. GIS technology integrates
Web-based GIS Application of the WEPP Model
 Web-based GIS Application of the WEPP Model Dennis C. Flanagan Research Agricultural Engineer USDA - Agricultural Research Service National Soil Erosion Research Laboratory West Lafayette, Indiana, USA
INVESTIGA I+D+i 2013/2014
 INVESTIGA I+D+i 2013/2014 SPECIFIC GUIDELINES ON AEROSPACE OBSERVATION OF EARTH Text by D. Eduardo de Miguel October, 2013 Introducction Earth observation is the use of remote sensing techniques to better
METHODOLOGY FOR LANDSLIDE SUSCEPTIBILITY AND HAZARD MAPPING USING GIS AND SDI
 The 8th International Conference on Geo-information for Disaster Management Intelligent Systems for Crisis Management METHODOLOGY FOR LANDSLIDE SUSCEPTIBILITY AND HAZARD MAPPING USING GIS AND SDI T. Fernández
Raster: The Other GIS Data
 04-Raster_Tutorial_Arcgis_93.Doc Page 1 of 11 Raster: The Other GIS Data Objectives Understand the raster format and how it is used to model continuous geographic phenomena Understand how projections &
HYDROLOGY OF THE TRANSBOUNDARY DRIN RIVER BASIN
 University of Texas at Austin GIS in Water Resources Instructor: Dr. David Maidment HYDROLOGY OF THE TRANSBOUNDARY DRIN RIVER BASIN Wikipedia Elisabeta Poci December, 2011 1 Table of Contents: 1. Introduction
PART 1. Representations of atmospheric phenomena
 PART 1 Representations of atmospheric phenomena Atmospheric data meet all of the criteria for big data : they are large (high volume), generated or captured frequently (high velocity), and represent a
OBJECT BASED IMAGE CLASSIFICATION AND WEB-MAPPING TECHNIQUES FOR FLOOD DAMAGE ASSESSMENT
 OBJECT BASED IMAGE CLASSIFICATION AND WEB-MAPPING TECHNIQUES FOR FLOOD DAMAGE ASSESSMENT Ejaz Hussain, KyoHyouk Kim, Jie Shan {ehussain, kim458, jshan}@ecn.purdue.edu Geomatics Engineering, School of Civil
Data Modeling Basics. John Auel GIS Technician II United Services Group
 Data Modeling Basics John Auel GIS Technician II United Services Group Background Bachelor of Science at University of Wisconsin, Steven s Point Area of Emphasis -- Cartography Been at United Services
GIS 101 - Introduction to Geographic Information Systems Last Revision or Approval Date - 9/8/2011
 Page 1 of 10 GIS 101 - Introduction to Geographic Information Systems Last Revision or Approval Date - 9/8/2011 College of the Canyons SECTION A 1. Division: Mathematics and Science 2. Department: Earth,
Advanced Image Management using the Mosaic Dataset
 Esri International User Conference San Diego, California Technical Workshops July 25, 2012 Advanced Image Management using the Mosaic Dataset Vinay Viswambharan, Mike Muller Agenda ArcGIS Image Management
How To Create A 3D Model Of The Phanerozoic Succession In Southern Manitoba
 3D GEOLOGICAL MAPPING IN MANITOBA MOVING FORWARD Greg Keller ([email protected]), Gaywood Matile, Manitoba Geological Survey (RET), Canada Harvey Thorleifson, Minnesota Geological Survey, United States
ERCB/AGS Information Series 136. Digital Mapping and 3D Visualization/ Modelling of Subsurface Geology Using ArcGIS 9.2 and Well Log Data
 ERCB/AGS Information Series 136 Digital Mapping and 3D Visualization/ Modelling of Subsurface Geology Using ArcGIS 9.2 and Well Log Data ERCB/AGS Information Series 136 Digital Mapping and 3D Visualization/Modelling
AUTOMATED MAPPING OF LAND COMPONENTS FROM DIGITAL ELEVATION DATA
 EARTH SURFACE PROCESSES AND LANDFORMS, VOL. 20, 13 1-1 37 (1995) AUTOMATED MAPPING OF LAND COMPONENTS FROM DIGITAL ELEVATION DATA J. R. DYMOND, R. C. DEROSE AND G. R. HARMSWORTH Manaaki Whenua - Landcare
Statement of Qualifications
 Statement of Qualifications Prepared By: JAYA Corporation 4900 University Square, Suite 30 Huntsville, AL 35816 TEL: (256) 722-0700 FAX: (256) 722-0711 EMAIL: igis@jaya corp.com Small Disadvantaged Business,
INTRODUCTION TO ARCGIS SOFTWARE
 INTRODUCTION TO ARCGIS SOFTWARE I. History of Software Development a. Developer ESRI - Environmental Systems Research Institute, Inc., in 1969 as a privately held consulting firm that specialized in landuse
Studying Topography, Orographic Rainfall, and Ecosystems (STORE)
") Studying Topography, Orographic Rainfall, and Ecosystems (STORE) Introduction Basic Lesson 2: Using ArcGIS Explorer to Analyze the Connection between Topography and Rainfall This lesson introduces Geographical
Studying Topography, Orographic Rainfall, and Ecosystems (STORE) Introduction Basic Lesson 2: Using ArcGIS Explorer to Analyze the Connection between Topography and Rainfall This lesson introduces Geographical
From GPS Data Collection to GIS Data Display A Walk-Through Example
 From GPS Data Collection to GIS Data Display A Walk-Through Example The Global Positioning System (GPS) is a satellite based navigation system consisting of 24 satellites, a worldwide network of tracking
Applying GIS Analysis to Archaeological Research in Canada
 Applying GIS Analysis to Archaeological Research in Canada T A L K B Y D R. K I S H A S U P E R N A N T P R E S E N T E D A T G E O A L B E R T A 2 0 1 3 S E P T E M B E R 2 3, 2 0 1 3 Overview Review
Review for Introduction to Remote Sensing: Science Concepts and Technology
 Review for Introduction to Remote Sensing: Science Concepts and Technology Ann Johnson Associate Director [email protected] Funded by National Science Foundation Advanced Technological Education program [DUE
Tutorial 3 - Map Symbology in ArcGIS
 Tutorial 3 - Map Symbology in ArcGIS Introduction ArcGIS provides many ways to display and analyze map features. Although not specifically a map-making or cartographic program, ArcGIS does feature a wide
Information Contents of High Resolution Satellite Images
 Information Contents of High Resolution Satellite Images H. Topan, G. Büyüksalih Zonguldak Karelmas University K. Jacobsen University of Hannover, Germany Keywords: satellite images, mapping, resolution,
Stability Assessment of Chamshir Dam Based on DEM, South West Zagros
 2015 2nd International Conference on Geological and Civil Engineering IPCBEE vol. 80 (2015) (2015) IACSIT Press, Singapore DOI: 10.7763/IPCBEE. 2015. V80. 13 Stability Assessment of Chamshir Dam Based
Tutorial 8 Raster Data Analysis
 Objectives Tutorial 8 Raster Data Analysis This tutorial is designed to introduce you to a basic set of raster-based analyses including: 1. Displaying Digital Elevation Model (DEM) 2. Slope calculations
Mapping Mashup/Data Integration Development Resources Teaching with Google Earth and Google Ocean Stone Lab August 13, 2010
 Mapping Mashup/Data Integration Development Resources Teaching with Google Earth and Google Ocean Stone Lab August 13, 2010 David Hart GIS Specialist University of Wisconsin Sea Grant Institute Virtual
UPDATING OBJECT FOR GIS DATABASE INFORMATION USING HIGH RESOLUTION SATELLITE IMAGES: A CASE STUDY ZONGULDAK
 UPDATING OBJECT FOR GIS DATABASE INFORMATION USING HIGH RESOLUTION SATELLITE IMAGES: A CASE STUDY ZONGULDAK M. Alkan 1, *, D. Arca 1, Ç. Bayik 1, A.M. Marangoz 1 1 Zonguldak Karaelmas University, Engineering
What is GIS. What is GIS? University of Tsukuba. What do you image of GIS? Copyright(C) ESRI Japan Corporation. All rights reserved.
 ESRI Japan Corporation. All rights reserved.") What is GIS University of Tsukuba Graduate School of Life and Environmental Science April 21 st, 2011 What is GIS? What do you image of GIS? Gas Insulated Switch Groupe Interventional Speciale Geographic
What is GIS University of Tsukuba Graduate School of Life and Environmental Science April 21 st, 2011 What is GIS? What do you image of GIS? Gas Insulated Switch Groupe Interventional Speciale Geographic
Guidelines on Information Deliverables for Research Projects in Grand Canyon National Park
 INTRODUCTION Science is playing an increasing role in guiding National Park Service (NPS) management activities. The NPS is charged with protecting and maintaining data and associated information that