Selecting the appropriate band combination for an RGB image using Landsat imagery
|
|
|
- Shauna Gilbert
- 10 years ago
- Views:
Transcription
1 Selecting the appropriate band combination for an RGB image using Landsat imagery Ned Horning Version: 1.0 Creation Date: Revision Date:

2 License: This document is licensed under a Creative Commons Attribution-Share Alike 3.0 Unported License. You are free to alter the work, copy, distribute, and transmit the document under the following conditions: You must attribute the work in the manner specified by the author or licensor (but not in any way that suggests that they endorse you or your use of the work). If you alter, transform, or build upon this work, you may distribute the resulting work only under the same, similar or a compatible license. To view a copy of this license, visit or send a letter to Creative Commons, 171 Second Street, Suite 300, San Francisco, California, 94105, USA. How to cite this document: Horning, N Selecting the appropriate band combination for an RGB image using Landsat imagery Version 1.0. American Museum of Natural History, Center for Biodiversity and Conservation. Available from (accessed on date) Center for Biodiversity and Conservation American Museum of Natural History Central Park West at 79th street New York, New York, USA

3 Selecting the appropriate band combination for an RGB image using Landsat imagery This guide explains the concept of multiband or multispectral imagery and illustrates how individual bands can be used to identify different features on the ground and how these bands can be combined to create color pictures. Using this information we can select specific bands from a multispectral satellite image to create color pictures that are specifically tailored to facilitate the identification of the features of interest. When we see a picture of a satellite image it often looks something like the image in Figure 1. Our initial thought may be that the satellite took this picture using an instrument similar to a digital camera. This analogy is a bit too simplistic but it is a good place for us to begin to understand how a satellite-based imaging sensor works. With a digital camera the detector inside the camera is recording three different wavelengths (or colors) of light - the red, green, and blue wavelengths and this information is combined to produce a picture that looks just like the feature we photographed. Figure 1: Landsat TM (WRS-2) Path = 125 Row = 49 April 21, 2003 Bands 5, 4, 3 represented with red, blue and green The city of Hue in Vietnam In this image the town of Hue, Vietnam is colored purple. The dark green color in the lower left portion of the image is forest and the green patches throughout the image represent grass, shrubs, and rice. The blue and black linear features are rivers, streams, and a moat around the old city of Hue. With a multispectral sensor, such as those aboard the Landsat satellites, information from

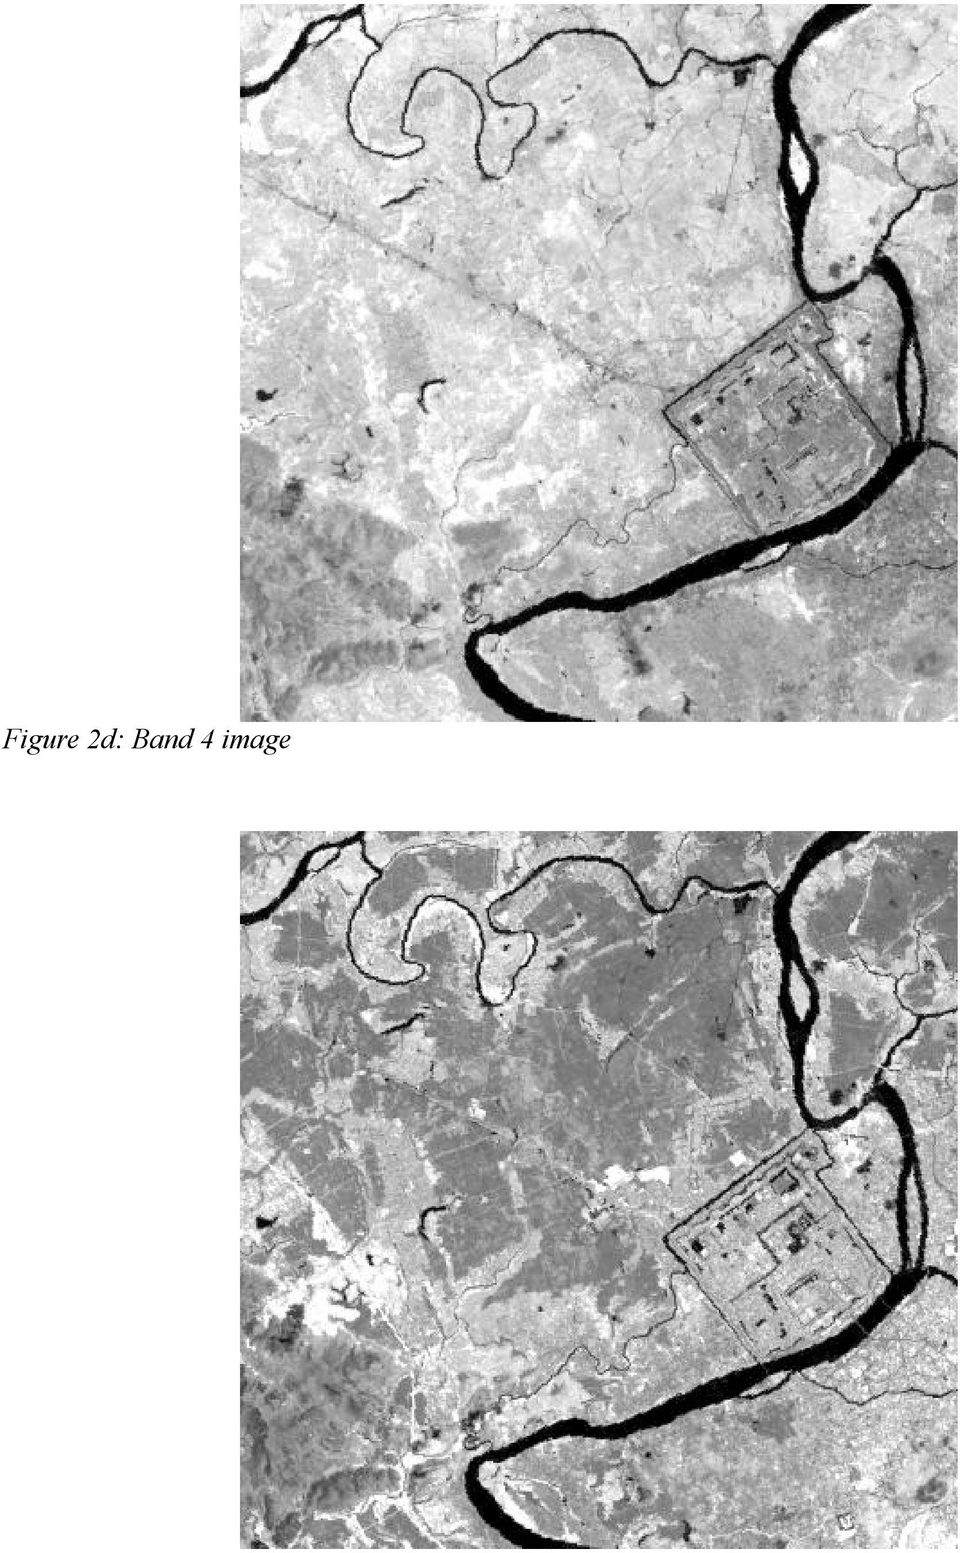
4 different wavelengths of light is collected as in a digital camera but there are two major differences. The first is that instead of limiting itself to the visible wavelengths (what we can see with the human eye - red, green, and blue) a much broader range of wavelengths are detected. In addition to the visible wavelengths, information is collected in the infrared and sometimes even the thermal wavelengths. The second major difference is that instead of automatically combining the information from the different wavelengths to form a picture, the information for each specific wavelength range is stored as a separate image. This image is commonly called a band. When viewed, this single band image is similar to a black and white digital photograph. It is up to us, the image analysts, to combine the images from the different wavelengths to create a color image. Figure 2 illustrates the individual bands that were used to create Figure 1 and the other bands available on the Enhanced Thematic Mapper (ETM) sensor on board the Landsat satellite. Figure 2a: Band 1 image

5 Figure 2b: Band 2 image Figure 2c: Band 3 image

6 Figure 2d: Band 4 image
7 Figure 2e: Band 5 image Figure 2f: Band 6 image

8 Figure 2g: Band 7 image We can create color images similar to the one in Figure 1 on a computer screen by using red, green, and blue light to illuminate bands 5, 4, and 3 respectively. This is easy to do if you have the appropriate software such as Adobe Photoshop, the Image Processing freeware package OpenEV, or most GIS and remote sensing image processing packages. All of the colors on a computer screen, television, or any other display device are comprised of a combination of red, green, and blue light. These are called the primary colors because all colors that we can see are made using these wavelengths of light. When we see white, the three primary colors are all present in the same full intensity and black is an absence of all visible light. Shades of grey are created using the same intensity of the three primary colors of light but somewhere between full intensity and no light. The RGB interactive tool illustrates how primary colors can be mixed to create any color. Now that we understand how a color image is made we need to determine which of the bands should be used to make the color image and which of the primary light colors should be used to illuminate each band. Determining which of the primary colors should be used to represent a particular band is largely a matter of how the image looks although some people are more sensitive to certain colors than others. For example, most people can see more detail in the red wavelengths. In Figure 1 vegetation is green and water is blue. Those are colors that people unfamiliar with remote sensing expect to see, and for those people, representing features with reasonably life-like colors helps them interpret the image. Another way to represent those same bands is to change the primary light colors that are used to illuminate each band. Figure 3 shows the same image used for Figure 1 but bands 4, 5, and 3 (in figure 1 the band order was 5, 4, 3) are represented using red, green, and blue light. This band order makes the vegetation look red instead of green. This is a band combination popular with

9 remote sensing specialist largely due to historical reasons. Since this looks similar to what you would get if you took a picture using a camera with color infrared film. Since infrared film was very popular for monitoring vegetation before the advent of digital remote sensing devices there is a tendency to continue simulating this effect. Figure 3: Landsat TM (WRS-2) Path = 125 Row = 49 April 21, 2003 Bands 4, 5, 3 represented with red, blue and green The city of Hue in Vietnam In this image the town of Hue, Vietnam is colored light blue. The reddish brown color in the lower left portion of the image is forest and the orange patches throughout the image represent grass, shrubs, and rice. The blue and black linear features are rivers, streams, and a moat around the old city of Hue. Selecting the appropriate bands to use in the color image on the other hand does have a huge impact on which features can be seen in a particular image. The list below explains some of the features of the seven Landsat Thematic Mapper bands and how they are tailored for detecting different features. Band 1 ( µm, blue-green): Since this short wavelength of light penetrates better than the other bands it is often the band of choice for aquatic ecosystems. It is used to monitor sediment in water, mapping coral reefs, and water depth. Unfortunately this is the noisiest of the Landsat bands since short wavelength blue light is scattered more than the other bands. For this reason it is rarely used for "pretty picture" type images. Band 2 ( µm, green): This has similar qualities to band 1 but not as extreme. The band was selected because it matches the wavelength for the green we see when looking at

10 vegetation. Band 3 ( µm, red): Since vegetation absorbs nearly all red light (it is sometimes called the chlorophyll absorption band) this band can be useful for distinguishing between vegetation and soil and in monitoring vegetation health. Band 4 ( µm, near infrared): Since water absorbs nearly all light at this wavelength water bodies appear very dark. This contrasts with bright reflectance for soil and vegetation so it is a good band for defining the water/land interface. Band 5 ( µm, mid-infrared): This band is very sensitive to moisture and is therefore used to monitor vegetation and soil moisture. It is also good at differentiating between clouds and snow. Band 6 ( µm, thermal infrared): This is a thermal band, which means it can be used to measure surface temperature. This is primarily used for geological applications but it is sometime used to measure plant heat stress. This is also used to differentiate clouds from bright soils since clouds tend to be very cold. One other difference between this band and the other multispectral ETM bands is that the resolution is half of the other bands (60 m instead of 30 m). Band 7 ( µm mid-infrared): This band is also used for vegetation moisture although generally band 5 is preferred for that application, as well as for soil and geology mapping. Now we can experiment with different band combinations. In Figure 4 you will see several commonly used band combinations with a brief explanation on why it is used. We also have an interactive band combination tool that you can use to experiment with different band combinations using Landsat Enhanced Thematic Mapper Plus (ETM+), ASTER, and MODIS imagery. One of the best ways to better understand which features one can see using different band combinations is to experiment to see what works for you.

11 Figure 4: Landsat TM (WRS-2) Path = 125 Row = 49, April 21, 2003, The city of Hue in Vietnam. Red=3, Green=2, Blue=1 This color composite is as close to true color that we can get with a Landsat ETM image. It is also useful for studying aquatic habitats. The downside of this set of bands is that they tend to produce a hazy image.

12 Figure 4.2: Landsat TM (WRS-2) Path = 125 Row = 49, April 21, 2003, The city of Hue in Vietnam. Red=4, Green=3, Blue=2 This has similar qualities to the image with bands 3,2,1 however, since this includes the near infrared channel (band 4) land water boundaries are clearer and different types of vegetation are more apparent. This was a popular band combination for Landsat MSS data since that did not have a midinfrared band.

13 Figure 4.3: Landsat TM (WRS-2) Path = 125 Row = 49, April 21, 2003, The city of Hue in Vietnam. Red=4, Green=5, Blue=3 This is crisper than the previous two images because the two shortest wavelength bands (bands 1 and 2) are not included. Different vegetation types can be more clearly defined and the land/water interface is very clear. Variations in moisture content are evident with this set of bands. This is probably the most common band combination for Landsat imagery.

14 Figure 4.4: Landsat TM (WRS-2) Path = 125 Row = 49, April 21, 2003, The city of Hue in Vietnam. Red=7, Green=4, Blue=2 This has similar properties to the 4,5,3 band combination with the biggest difference being that vegetation is green. This is the band combination that was selected for the global Landsat mosaic created for NASA.

Resolutions of Remote Sensing
 Resolutions of Remote Sensing 1. Spatial (what area and how detailed) 2. Spectral (what colors bands) 3. Temporal (time of day/season/year) 4. Radiometric (color depth) Spatial Resolution describes how
How Landsat Images are Made
 How Landsat Images are Made Presentation by: NASA s Landsat Education and Public Outreach team June 2006 1 More than just a pretty picture Landsat makes pretty weird looking maps, and it isn t always easy
TerraColor White Paper
 TerraColor White Paper TerraColor is a simulated true color digital earth imagery product developed by Earthstar Geographics LLC. This product was built from imagery captured by the US Landsat 7 (ETM+)
Finding and Downloading Landsat Data from the U.S. Geological Survey s Global Visualization Viewer Website
 January 1, 2013 Finding and Downloading Landsat Data from the U.S. Geological Survey s Global Visualization Viewer Website All Landsat data are available to the public at no cost from U.S. Geological Survey
Myths and misconceptions about remote sensing
 Myths and misconceptions about remote sensing Ned Horning (graphics support - Nicholas DuBroff) Version: 1.0 Creation Date: 2004-01-01 Revision Date: 2004-01-01 License: This document is licensed under
Review for Introduction to Remote Sensing: Science Concepts and Technology
 Review for Introduction to Remote Sensing: Science Concepts and Technology Ann Johnson Associate Director [email protected] Funded by National Science Foundation Advanced Technological Education program [DUE
Understanding image scale and resolution
 Understanding image scale and resolution Ned Horning Version: 1.0 Creation Date: 2004-01-01 Revision Date: 2004-01-01 License: This document is licensed under a Creative Commons Attribution-Share Alike
Using Remote Sensing Imagery to Evaluate Post-Wildfire Damage in Southern California
 Graham Emde GEOG 3230 Advanced Remote Sensing February 22, 2013 Lab #1 Using Remote Sensing Imagery to Evaluate Post-Wildfire Damage in Southern California Introduction Wildfires are a common disturbance
A remote sensing instrument collects information about an object or phenomenon within the
 Satellite Remote Sensing GE 4150- Natural Hazards Some slides taken from Ann Maclean: Introduction to Digital Image Processing Remote Sensing the art, science, and technology of obtaining reliable information
ANALYSIS OF FOREST CHANGE IN FIRE DAMAGE AREA USING SATELLITE IMAGES
 ANALYSIS OF FOREST CHANGE IN FIRE DAMAGE AREA USING SATELLITE IMAGES Joon Mook Kang, Professor Joon Kyu Park, Ph.D Min Gyu Kim, Ph.D._Candidate Dept of Civil Engineering, Chungnam National University 220
Night Microphysics RGB Nephanalysis in night time
 Copyright, JMA Night Microphysics RGB Nephanalysis in night time Meteorological Satellite Center, JMA What s Night Microphysics RGB? R : B15(I2 12.3)-B13(IR 10.4) Range : -4 2 [K] Gamma : 1.0 G : B13(IR
WATER BODY EXTRACTION FROM MULTI SPECTRAL IMAGE BY SPECTRAL PATTERN ANALYSIS
 WATER BODY EXTRACTION FROM MULTI SPECTRAL IMAGE BY SPECTRAL PATTERN ANALYSIS Nguyen Dinh Duong Department of Environmental Information Study and Analysis, Institute of Geography, 18 Hoang Quoc Viet Rd.,
2.3 Spatial Resolution, Pixel Size, and Scale
 Section 2.3 Spatial Resolution, Pixel Size, and Scale Page 39 2.3 Spatial Resolution, Pixel Size, and Scale For some remote sensing instruments, the distance between the target being imaged and the platform,
Mapping Earth from Space Remote sensing and satellite images. Remote sensing developments from war
 Mapping Earth from Space Remote sensing and satellite images Geomatics includes all the following spatial technologies: a. Cartography "The art, science and technology of making maps" b. Geographic Information
Land Use/Land Cover Map of the Central Facility of ARM in the Southern Great Plains Site Using DOE s Multi-Spectral Thermal Imager Satellite Images
 Land Use/Land Cover Map of the Central Facility of ARM in the Southern Great Plains Site Using DOE s Multi-Spectral Thermal Imager Satellite Images S. E. Báez Cazull Pre-Service Teacher Program University
Spectral Response for DigitalGlobe Earth Imaging Instruments
 Spectral Response for DigitalGlobe Earth Imaging Instruments IKONOS The IKONOS satellite carries a high resolution panchromatic band covering most of the silicon response and four lower resolution spectral
Filters for Black & White Photography
 Filters for Black & White Photography Panchromatic Film How it works. Panchromatic film records all colors of light in the same tones of grey. Light Intensity (the number of photons per square inch) is
Landsat Monitoring our Earth s Condition for over 40 years
 Landsat Monitoring our Earth s Condition for over 40 years Thomas Cecere Land Remote Sensing Program USGS ISPRS:Earth Observing Data and Tools for Health Studies Arlington, VA August 28, 2013 U.S. Department
SAMPLE MIDTERM QUESTIONS
 Geography 309 Sample MidTerm Questions Page 1 SAMPLE MIDTERM QUESTIONS Textbook Questions Chapter 1 Questions 4, 5, 6, Chapter 2 Questions 4, 7, 10 Chapter 4 Questions 8, 9 Chapter 10 Questions 1, 4, 7
Introduction to Remote Sensing and Image Processing
 Introduction to Remote Sensing and Image Processing Of all the various data sources used in GIS, one of the most important is undoubtedly that provided by remote sensing. Through the use of satellites,
Overview. What is EMR? Electromagnetic Radiation (EMR) LA502 Special Studies Remote Sensing
 LA502 Special Studies Remote Sensing") LA502 Special Studies Remote Sensing Electromagnetic Radiation (EMR) Dr. Ragab Khalil Department of Landscape Architecture Faculty of Environmental Design King AbdulAziz University Room 103 Overview What
LA502 Special Studies Remote Sensing Electromagnetic Radiation (EMR) Dr. Ragab Khalil Department of Landscape Architecture Faculty of Environmental Design King AbdulAziz University Room 103 Overview What
Remote sensing is the collection of data without directly measuring the object it relies on the
 Chapter 8 Remote Sensing Chapter Overview Remote sensing is the collection of data without directly measuring the object it relies on the reflectance of natural or emitted electromagnetic radiation (EMR).
Hyperspectral Satellite Imaging Planning a Mission
 Hyperspectral Satellite Imaging Planning a Mission Victor Gardner University of Maryland 2007 AIAA Region 1 Mid-Atlantic Student Conference National Institute of Aerospace, Langley, VA Outline Objective
GIS Lesson 6 MAPS WITH RASTER IMAGES III: SATELLITE IMAGERY TEACHER INFORMATION
 GIS Lesson 6 MAPS WITH RASTER IMAGES III: SATELLITE IMAGERY TEACHER INFORMATION Lesson Summary: During this lesson students use GIS to load and view truecolor and enhanced satellite images of Alaska. Based
Preface. Ko Ko Lwin Division of Spatial Information Science University of Tsukuba 2008
 1 Preface Remote Sensing data is one of the primary data sources in GIS analysis. The objective of this material is to provide fundamentals of Remote Sensing technology and its applications in Geographical
Digital image processing
 746A27 Remote Sensing and GIS Lecture 4 Digital image processing Chandan Roy Guest Lecturer Department of Computer and Information Science Linköping University Digital Image Processing Most of the common
MODIS IMAGES RESTORATION FOR VNIR BANDS ON FIRE SMOKE AFFECTED AREA
 MODIS IMAGES RESTORATION FOR VNIR BANDS ON FIRE SMOKE AFFECTED AREA Li-Yu Chang and Chi-Farn Chen Center for Space and Remote Sensing Research, National Central University, No. 300, Zhongda Rd., Zhongli
Treasure Hunt. Lecture 2 How does Light Interact with the Environment? EMR Principles and Properties. EMR and Remote Sensing
 Lecture 2 How does Light Interact with the Environment? Treasure Hunt Find and scan all 11 QR codes Choose one to watch / read in detail Post the key points as a reaction to http://www.scoop.it/t/env202-502-w2
ENVI Classic Tutorial: Atmospherically Correcting Multispectral Data Using FLAASH 2
 ENVI Classic Tutorial: Atmospherically Correcting Multispectral Data Using FLAASH Atmospherically Correcting Multispectral Data Using FLAASH 2 Files Used in this Tutorial 2 Opening the Raw Landsat Image
RESOLUTION MERGE OF 1:35.000 SCALE AERIAL PHOTOGRAPHS WITH LANDSAT 7 ETM IMAGERY
 RESOLUTION MERGE OF 1:35.000 SCALE AERIAL PHOTOGRAPHS WITH LANDSAT 7 ETM IMAGERY M. Erdogan, H.H. Maras, A. Yilmaz, Ö.T. Özerbil General Command of Mapping 06100 Dikimevi, Ankara, TURKEY - (mustafa.erdogan;
Using Remote Sensing to Monitor Soil Carbon Sequestration
 Using Remote Sensing to Monitor Soil Carbon Sequestration E. Raymond Hunt, Jr. USDA-ARS Hydrology and Remote Sensing Beltsville Agricultural Research Center Beltsville, Maryland Introduction and Overview
Generation of Cloud-free Imagery Using Landsat-8
 Generation of Cloud-free Imagery Using Landsat-8 Byeonghee Kim 1, Youkyung Han 2, Yonghyun Kim 3, Yongil Kim 4 Department of Civil and Environmental Engineering, Seoul National University (SNU), Seoul,
High Resolution Information from Seven Years of ASTER Data
 High Resolution Information from Seven Years of ASTER Data Anna Colvin Michigan Technological University Department of Geological and Mining Engineering and Sciences Outline Part I ASTER mission Terra
Research on Soil Moisture and Evapotranspiration using Remote Sensing
 Research on Soil Moisture and Evapotranspiration using Remote Sensing Prof. dr. hab Katarzyna Dabrowska Zielinska Remote Sensing Center Institute of Geodesy and Cartography 00-950 Warszawa Jasna 2/4 Field
Remote Sensing. Vandaag. Voordelen Remote Sensing Wat is Remote Sensing? Vier elementen Remote Sensing systeem
 Remote Sensing 1 Vandaag Voordelen Remote Sensing Wat is Remote Sensing? Vier elementen Remote Sensing systeem 2 Nederland Vanaf 700 km hoogte Landsat TM mozaïek 3 Europa vanaf 36000 km hoogte 4 5 Mount
How to calculate reflectance and temperature using ASTER data
 How to calculate reflectance and temperature using ASTER data Prepared by Abduwasit Ghulam Center for Environmental Sciences at Saint Louis University September, 2009 This instructions walk you through
Computer Vision: Machine Vision Filters. Computer Vision. Optical Filters. 25 August 2014
 Computer Vision Optical Filters 25 August 2014 Copyright 2001 2014 by NHL Hogeschool, Van de Loosdrecht Machine Vision BV and Klaas Dijkstra All rights reserved [email protected], [email protected],
Coastline change detection using remote sensing
 Int. J. Environ. Sci. Tech., 4 (1): 61-66, 2007 ISSN: 1735-1472 Winter 2007, IRSEN, CEERS, IAU A. A. Alesheikh, et al. Coastline change detection using remote sensing 1 A. A. Alesheikh, 2 A. Ghorbanali,
A KNOWLEDGE-BASED APPROACH FOR REDUCING CLOUD AND SHADOW ABSTRACT
 A KNOWLEDGE-BASED APPROACH FOR REDUCING CLOUD AND SHADOW Mingjun Song, Graduate Research Assistant Daniel L. Civco, Director Laboratory for Earth Resources Information Systems Department of Natural Resources
Landsat 7 Automatic Cloud Cover Assessment
 Landsat 7 Automatic Cloud Cover Assessment Richard R. Irish Science Systems and Applications, Inc. NASA s Goddard Space Flight Center, Greenbelt, Maryland ABSTRACT An automatic cloud cover assessment algorithm
EcoInformatics International Inc.
 1 von 10 03.08.2010 14:25 EcoInformatics International Inc. Home Services - solutions Projects Concepts Tools Links Contact EXPLORING BEAVER HABITAT AND DISTRIBUTION WITH GOOGLE EARTH: THE LONGEST BEAVER
1. Introduction to image processing
 1 1. Introduction to image processing 1.1 What is an image? An image is an array, or a matrix, of square pixels (picture elements) arranged in columns and rows. Figure 1: An image an array or a matrix
Remote sensing study on the Pisa plain
 Remote sensing study on the Pisa plain Bini M., Kukavicic M., Pappalardo M. MapPapers 5en-II, 2012, pp.201-211 doi:10.4456/mappa.2012.34 Multispectral images with medium-high resolution were acquired from
APPLICATION OF TERRA/ASTER DATA ON AGRICULTURE LAND MAPPING. Genya SAITO*, Naoki ISHITSUKA*, Yoneharu MATANO**, and Masatane KATO***
 APPLICATION OF TERRA/ASTER DATA ON AGRICULTURE LAND MAPPING Genya SAITO*, Naoki ISHITSUKA*, Yoneharu MATANO**, and Masatane KATO*** *National Institute for Agro-Environmental Sciences 3-1-3 Kannondai Tsukuba
Evaluation of Wildfire Duration Time Over Asia using MTSAT and MODIS
 Evaluation of Wildfire Duration Time Over Asia using MTSAT and MODIS Wataru Takeuchi * and Yusuke Matsumura Institute of Industrial Science, University of Tokyo, Japan Ce-504, 6-1, Komaba 4-chome, Meguro,
Outline of RGB Composite Imagery
 Outline of RGB Composite Imagery Data Processing Division, Data Processing Department Meteorological Satellite Center (MSC) JMA Akihiro SHIMIZU 29 September, 2014 Updated 6 July, 2015 1 Contents What s
Tracking Change Over Time
 Teacher Guide Tracking Change Over Time Earth Images for Education U.S. Department of the Interior U.S. Geological Survey General Information Product 133 2 Contents Tracking Change Over Time: Getting Started...
Choosing Colors for Data Visualization Maureen Stone January 17, 2006
 Choosing Colors for Data Visualization Maureen Stone January 17, 2006 The problem of choosing colors for data visualization is expressed by this quote from information visualization guru Edward Tufte:
The USGS Landsat Big Data Challenge
 The USGS Landsat Big Data Challenge Brian Sauer Engineering and Development USGS EROS [email protected] U.S. Department of the Interior U.S. Geological Survey USGS EROS and Landsat 2 Data Utility and Exploitation
Cloud Masking and Cloud Products
 Cloud Masking and Cloud Products MODIS Operational Algorithm MOD35 Paul Menzel, Steve Ackerman, Richard Frey, Kathy Strabala, Chris Moeller, Liam Gumley, Bryan Baum MODIS Cloud Masking Often done with
Expert Color Choices for Presenting Data
 Expert Color Choices for Presenting Data Maureen Stone, StoneSoup Consulting The problem of choosing colors for data visualization is expressed by this quote from information visualization guru Edward
Open-File Report 2010 1076. By Daniel H. Knepper, Jr. U.S. Department of the Interior U.S. Geological Survey
 Distribution of Potential Hydrothermally Altered Rocks in Central Colorado Derived From Landsat Thematic Mapper Data: A Geographic Information System Data Set By Daniel H. Knepper, Jr. Open-File Report
Field Techniques Manual: GIS, GPS and Remote Sensing
 Field Techniques Manual: GIS, GPS and Remote Sensing Section A: Introduction Chapter 1: GIS, GPS, Remote Sensing and Fieldwork 1 GIS, GPS, Remote Sensing and Fieldwork The widespread use of computers
Software requirements * :
 Title: Product Type: Developer: Target audience: Format: Software requirements * : Data: Estimated time to complete: Fire Mapping using ASTER Part I: The ASTER instrument and fire damage assessment Part
Electromagnetic Radiation (EMR) and Remote Sensing
 and Remote Sensing") Electromagnetic Radiation (EMR) and Remote Sensing 1 Atmosphere Anything missing in between? Electromagnetic Radiation (EMR) is radiated by atomic particles at the source (the Sun), propagates through
Electromagnetic Radiation (EMR) and Remote Sensing 1 Atmosphere Anything missing in between? Electromagnetic Radiation (EMR) is radiated by atomic particles at the source (the Sun), propagates through
1 The interaction of visible and near infrared EMR with soil
 PROPERTIES OF EARTH SURFACES AND THEIR INTERACTIONS WITH ELECTROMAGNETIC RADIATION AT VISIBLE AND NEAR INFRARED WAVELENGTHS For a fixed distribution of incident radiation, the particular properties of
MOD09 (Surface Reflectance) User s Guide
 User s Guide") MOD09 (Surface ) User s Guide MODIS Land Surface Science Computing Facility Principal Investigator: Dr. Eric F. Vermote Web site: http://modis-sr.ltdri.org Correspondence e-mail address: [email protected]
MOD09 (Surface ) User s Guide MODIS Land Surface Science Computing Facility Principal Investigator: Dr. Eric F. Vermote Web site: http://modis-sr.ltdri.org Correspondence e-mail address: [email protected]
Introduction to Imagery and Raster Data in ArcGIS
 Esri International User Conference San Diego, California Technical Workshops July 25, 2012 Introduction to Imagery and Raster Data in ArcGIS Simon Woo slides Cody Benkelman - demos Overview of Presentation
Active and Passive Microwave Remote Sensing
 Active and Passive Microwave Remote Sensing Passive remote sensing system record EMR that was reflected (e.g., blue, green, red, and near IR) or emitted (e.g., thermal IR) from the surface of the Earth.
Lake Monitoring in Wisconsin using Satellite Remote Sensing
 Lake Monitoring in Wisconsin using Satellite Remote Sensing D. Gurlin and S. Greb Wisconsin Department of Natural Resources 2015 Wisconsin Lakes Partnership Convention April 23 25, 2105 Holiday Inn Convention
Restoration Planning and Development of a Restoration Bank
 Restoration Planning and Development of a Restoration Bank Black Creek Pioneer Village, South Theatre 8:30 a.m. to 3:30 p.m. Habitat Restoration and Environmental Monitoring Projects Section Restoration
Received in revised form 24 March 2004; accepted 30 March 2004
 Remote Sensing of Environment 91 (2004) 237 242 www.elsevier.com/locate/rse Cloud detection in Landsat imagery of ice sheets using shadow matching technique and automatic normalized difference snow index
Assessing Hurricane Katrina Damage to the Mississippi Gulf Coast Using IKONOS Imagery
 Assessing Hurricane Katrina Damage to the Mississippi Gulf Coast Using IKONOS Imagery Joseph P. Spruce Science Systems and Applications, Inc. John C., MS 39529 Rodney McKellip NASA Project Integration
Measurement of the effect of biomass burning aerosol on inhibition of cloud formation over the Amazon
 Supporting Online Material for Koren et al. Measurement of the effect of biomass burning aerosol on inhibition of cloud formation over the Amazon 1. MODIS new cloud detection algorithm The operational
A Canada Centre for Remote Sensing Remote Sensing Tutorial
 Fundamentals of Remote Sensing A Remote Sensing Tutorial Natural Resources Canada Ressources naturelles Canada Fundamentals of Remote Sensing - Table of Contents Page 2 Table of Contents 1. Introduction
Name Class Date. spectrum. White is not a color, but is a combination of all colors. Black is not a color; it is the absence of all light.
 Exercises 28.1 The Spectrum (pages 555 556) 1. Isaac Newton was the first person to do a systematic study of color. 2. Circle the letter of each statement that is true about Newton s study of color. a.
INVESTIGA I+D+i 2013/2014
 INVESTIGA I+D+i 2013/2014 SPECIFIC GUIDELINES ON AEROSPACE OBSERVATION OF EARTH Text by D. Eduardo de Miguel October, 2013 Introducction Earth observation is the use of remote sensing techniques to better
AERIAL PHOTOGRAPHS. For a map of this information, in paper or digital format, contact the Tompkins County Planning Department.
 AERIAL PHOTOGRAPHS What are Aerial Photographs? Aerial photographs are images of the land taken from an airplane and printed on 9 x9 photographic paper. Why are Aerial Photographs Important? Aerial photographs
and satellite image download with the USGS GloVis portal
 Tutorial: NDVI calculation with SPRING GIS and satellite image download with the USGS GloVis portal Content overview: Downloading data from GloVis: p 2 Using SPRING GIS: p 11 This document is meant to
White Paper. "See" what is important
 Bear this in mind when selecting a book scanner "See" what is important Books, magazines and historical documents come in hugely different colors, shapes and sizes; for libraries, archives and museums,
Supervised Classification workflow in ENVI 4.8 using WorldView-2 imagery
 Supervised Classification workflow in ENVI 4.8 using WorldView-2 imagery WorldView-2 is the first commercial high-resolution satellite to provide eight spectral sensors in the visible to near-infrared
River Flood Damage Assessment using IKONOS images, Segmentation Algorithms & Flood Simulation Models
 River Flood Damage Assessment using IKONOS images, Segmentation Algorithms & Flood Simulation Models Steven M. de Jong & Raymond Sluiter Utrecht University Corné van der Sande Netherlands Earth Observation
NATIONAL OPEN UNIVERSITY OF NIGERIA SCHOOL OF SCIENCE AND TECHNOLOGY COURSE CODE: ESM 392
 NATIONAL OPEN UNIVERSITY OF NIGERIA SCHOOL OF SCIENCE AND TECHNOLOGY COURSE CODE: ESM 392 COURSE TITLE: REMOTE SENSING AND RADIATION PRINCIPLES MODULE 1 [INTRODUCTION TO REMOTE SENSING AND RADIATION PRINCIPLES]
Some elements of photo. interpretation
 Some elements of photo Shape Size Pattern Color (tone, hue) Texture Shadows Site Association interpretation Olson, C. E., Jr. 1960. Elements of photographic interpretation common to several sensors. Photogrammetric
Overview of the IR channels and their applications
 Ján Kaňák Slovak Hydrometeorological Institute [email protected] Overview of the IR channels and their applications EUMeTrain, 14 June 2011 Ján Kaňák, SHMÚ 1 Basics in satellite Infrared image interpretation
ENVI THE PREMIER SOFTWARE FOR EXTRACTING INFORMATION FROM GEOSPATIAL IMAGERY.
 ENVI THE PREMIER SOFTWARE FOR EXTRACTING INFORMATION FROM GEOSPATIAL IMAGERY. ENVI Imagery Becomes Knowledge ENVI software uses proven scientific methods and automated processes to help you turn geospatial
Table of Contents. An Introduction to Hyperspectral Imaging Technology
 Table of Contents 1.0 Introduction... 1 2.0 Electromagnetic Radiation... 1 2.1 The Electromagnetic Spectrum... 2 2.2 Electromagnetic Interactions with Matter... 3 3.0 Spectroscopy... 5 3.1 Refraction and
Volcanic Ash Monitoring: Product Guide
 Doc.No. Issue : : EUM/TSS/MAN/15/802120 v1a EUMETSAT Eumetsat-Allee 1, D-64295 Darmstadt, Germany Tel: +49 6151 807-7 Fax: +49 6151 807 555 Date : 2 June 2015 http://www.eumetsat.int WBS/DBS : EUMETSAT
Image Analysis CHAPTER 16 16.1 ANALYSIS PROCEDURES
 CHAPTER 16 Image Analysis 16.1 ANALYSIS PROCEDURES Studies for various disciplines require different technical approaches, but there is a generalized pattern for geology, soils, range, wetlands, archeology,
Best practices for RGB compositing of multi-spectral imagery
 Best practices for RGB compositing of multi-spectral imagery User Service Division, EUMETSAT Introduction Until recently imagers on geostationary satellites were limited to 2-3 spectral channels, i.e.
Hydrographic Surveying using High Resolution Satellite Images
 Hydrographic Surveying using High Resolution Satellite Images Petra PHILIPSON and Frida ANDERSSON, Sweden Key words: remote sensing, high resolution, hydrographic survey, depth estimation. SUMMARY The
INTRODUCTION TO REMOTE SENSING
 INTRODUCTION TO REMOTE SENSING Dr Robert Sanderson New Mexico State University Satellite picture of Las Cruces, NM Table of Contents Introduction...1 Electromagnetic energy...1 Reflection and absorption...2
Soil Moisture Estimation Using Active DTS at MOISST Site
 MOISST Workhsop, 2014 Soil Moisture Estimation Using Active DTS at MOISST Site June 4, 2014 Chadi Sayde, Daniel Moreno, John Selker Department of Biological and Ecological Engineering Oregon State University,
Digital Image Fundamentals. Selim Aksoy Department of Computer Engineering Bilkent University [email protected]
 Digital Image Fundamentals Selim Aksoy Department of Computer Engineering Bilkent University [email protected] Imaging process Light reaches surfaces in 3D. Surfaces reflect. Sensor element receives
Computer Vision. Color image processing. 25 August 2014
 Computer Vision Color image processing 25 August 2014 Copyright 2001 2014 by NHL Hogeschool and Van de Loosdrecht Machine Vision BV All rights reserved [email protected], [email protected] Color image
A Solar System Coloring Book
 A Solar System Coloring Book Courtesy of the Windows to the Universe Project http://www.windows2universe.org The Sun Size: The Sun is wider than 100 Earths. Temperature: ~27,000,000 F in the center, ~10,000
ArcGIS Agricultural Land Use Maps from the Mississippi Cropland Data Layer
 ArcGIS Agricultural Land Use Maps from the Mississippi Cropland Data Layer Fred L. Shore, Ph.D. Mississippi Department of Agriculture and Commerce Jackson, MS, USA [email protected] Rick Mueller
Recent advances in Satellite Imagery for Oil and Gas Exploration and Production. DESK AND DERRICK APRIL 2016 PRESENTED BY GARY CREWS---RETIRED
 Recent advances in Satellite Imagery for Oil and Gas Exploration and Production. DESK AND DERRICK APRIL 2016 PRESENTED BY GARY CREWS---RETIRED Agenda Brief review of state of the applications in 2010 Basics
3D VISUALIZATION OF GEOTHERMAL WELLS DIRECTIONAL SURVEYS AND INTEGRATION WITH DIGITAL ELEVATION MODEL (DEM)
") Presented at Short Course VII on Exploration for Geothermal Resources, organized by UNU-GTP, GDC and KenGen, at Lake Bogoria and Lake Naivasha, Kenya, Oct. 27 Nov. 18, 2012. GEOTHERMAL TRAINING PROGRAMME
Presented at Short Course VII on Exploration for Geothermal Resources, organized by UNU-GTP, GDC and KenGen, at Lake Bogoria and Lake Naivasha, Kenya, Oct. 27 Nov. 18, 2012. GEOTHERMAL TRAINING PROGRAMME
Joint Polar Satellite System (JPSS)
") Joint Polar Satellite System (JPSS) John Furgerson, User Liaison Joint Polar Satellite System National Environmental Satellite, Data, and Information Service National Oceanic and Atmospheric Administration
Joint Polar Satellite System (JPSS) John Furgerson, User Liaison Joint Polar Satellite System National Environmental Satellite, Data, and Information Service National Oceanic and Atmospheric Administration
MAPPING MINNEAPOLIS URBAN TREE CANOPY. Why is Tree Canopy Important? Project Background. Mapping Minneapolis Urban Tree Canopy.
 MAPPING MINNEAPOLIS URBAN TREE CANOPY Why is Tree Canopy Important? Trees are an important component of urban environments. In addition to their aesthetic value, trees have significant economic and environmental
Choosing a digital camera for your microscope John C. Russ, Materials Science and Engineering Dept., North Carolina State Univ.
 Choosing a digital camera for your microscope John C. Russ, Materials Science and Engineering Dept., North Carolina State Univ., Raleigh, NC One vital step is to choose a transfer lens matched to your
Remote Sensing Satellite Information Sheets Geophysical Institute University of Alaska Fairbanks
 Remote Sensing Satellite Information Sheets Geophysical Institute University of Alaska Fairbanks ASTER Advanced Spaceborne Thermal Emission and Reflection Radiometer AVHRR Advanced Very High Resolution
STAAR Science Tutorial 30 TEK 8.8C: Electromagnetic Waves
 Name: Teacher: Pd. Date: STAAR Science Tutorial 30 TEK 8.8C: Electromagnetic Waves TEK 8.8C: Explore how different wavelengths of the electromagnetic spectrum such as light and radio waves are used to
Clouds and the Energy Cycle
 August 1999 NF-207 The Earth Science Enterprise Series These articles discuss Earth's many dynamic processes and their interactions Clouds and the Energy Cycle he study of clouds, where they occur, and
COASTAL MONITORING & OBSERVATIONS LESSON PLAN Do You Have Change?
 Coastal Change Analysis Lesson Plan COASTAL MONITORING & OBSERVATIONS LESSON PLAN Do You Have Change? NOS Topic Coastal Monitoring and Observations Theme Coastal Change Analysis Links to Overview Essays