RIVM report / The RIVM-MNP contribution to the evaluation of the EMEP Unified (Eulerian) model
|
|
|
- Jeffrey Jones
- 10 years ago
- Views:
Transcription
1 RIVM report 5372 / 23 The RIVM-MNP contribution to the evaluation of the EMEP Unified (Eulerian) model G.J.M. Velders, E.S. de Waal, J.A. van Jaarsveld, J.F. de Ruiter This investigation was performed by order and for the account of the Directorate-General for Environmental Protection (DGM/KvI) of the Netherlands' Ministry of Housing, Spatial Planning and the Environment, within the framework of project M/537 "Nationaal Luchtbeleid", Milestone "EMEP model evaluation". RIVM, P.O. Box 1, 372 BA Bilthoven, phone: ; fax:
 of the Netherlands' Ministry of Housing, Spatial Planning and the Environment, within the framework of project M/537")
2 RIVM report 5372 page 2 of 32 Abstract A few aspects of the EMEP Unified (Eulerian) model have been evaluated by analysing the deposition parameterisation for acidifying compounds and the concentration and deposition of SO x, NO x, and NH x in the Netherlands. Evaluation was also carried out by analysing the source-receptor matrices for the Netherlands and the geographical distribution of the emissions, comparing results with both the model and measurements. The picture given of the Netherlands by the EMEP Unified model was found for most acidifying compounds to be a fair one. The source-receptor matrices calculated by the EMEP and models were seen to be in good agreement for oxidised sulphur, and in reasonable agreement for reduced nitrogen. Large discrepancies between the models were found for oxidised nitrogen. The contribution of the Dutch emissions to local deposition in the Netherlands came to a factor of 4 higher in the model, compared to the EMEP model. The contributions of Belgium and Germany to deposition are also much higher in the model. These differences can be traced back to the lower concentration and dry deposition, along with higher wet deposition, of NO x in the EMEP model. For oxidised nitrogen, there was a large difference in the influence of the boundary and initial conditions on the source-receptor matrix. The EMEP model suggests that almost 3% of the deposition is due to sources outside Europe. The SO 2 concentrations in the Netherlands calculated with the EMEP model are close to the measurements, while the NO x concentrations are about 4% lower and the NH 3 concentrations 3% to 4% lower than the measurements.

3 RIVM report 5372 page 3 of 32 Preface EMEP model output is used as input in the RAINS model, which, in turn, forms an important element of the scientific base for policy measures in the EU Clean Air for Europe (CAFE) programme and in the framework of the UNECE Convention on Long-Range Transboundary Air Pollution (CLRTAP). This report represents the results of evaluating the EMEP Unified model, as commissioned by the EMEP s Task Force on Measurements and Modelling (TFMM) through the EMEP Steering Body. The aim of the evaluation was to address the suitability of the model for assessing regional concentrations and long-range transboundary fluxes of sulphur, oxidised and reduced nitrogen, VOCs, ozone and suspended particulate matter. The activities described represent the RIVM-MNP contribution to the EMEP model s evaluation, intended to contribute to the quality of the EMEP model and the source-receptor matrices, and to assist in the policy-making process.

4 RIVM report 5372 page 4 of 32 Contents Executive Summary 5 Samenvatting 7 1. Introduction 9 2. Deposition parameterisation Comparison of overall dry deposition velocities EMEP and General comments on dry deposition parameterisations EMEP versus on a 5 x 5 km grid Source-receptor relationships for the Netherlands Distribution of emissions Discussion 3 Literature 31 Appendix Mailing list 32

5 RIVM report 5372 page 5 of 32 Executive Summary A selected set of analyses has been performed by RIVM-MNP to evaluate the EMEP Unified (Eulerian) model. The analyses concentrated on the deposition parameterisation for acidifying compounds, the concentration and deposition of SO x, NO x, and NH x in the Netherlands, the source-receptor matrices for the Netherlands and the geographical distribution of the emissions. For the evaluation, EMEP results were compared both with the results and observations in the Netherlands to yield the following conclusions for the EMEP Unified model: The EMEP Unified model was concluded to give a fair picture of the concentration and deposition of most acidifying compounds in the Netherlands. Source-receptor matrices The source-receptor matrices for oxidised sulphur (SO x ) calculated by the EMEP and models are in good agreement. The agreement for reduced nitrogen (NH x ) is reasonable. For reduced nitrogen, the EMEP model calculated a higher contribution to the deposition in the Netherlands from emissions in Belgium and Germany, and a lower contribution from the Netherlands. Large discrepancies between the EMEP and models were found in the sourcereceptor matrices for oxidised nitrogen (NO y ). The local deposition contribution of the Dutch emissions to the deposition in the Netherlands comes to a factor of 4 higher in the model than in the EMEP model. The Dutch emissions contribute only 8% to the deposition in the Netherlands. This was 3-35% in the pervious version of the Eulerian model and 15-2% in the EMEP Lagrangian model. The NO y contributions from Belgium and Germany are now also much lower in the EMEP model than in the model. These differences may have consequences for emission reductions in countries to meet environmental objectives. When comparing the model s results with observations in the Netherlands, we see that the EMEP model strongly underestimates NO x concentrations and dry deposition, and slightly overestimates wet deposition. The relative contribution of Dutch emissions to the deposition in the Netherlands is always higher in the model than in the EMEP model: for SO x (EMEP: 2%, : 24%), NH x (EMEP: 58%, : 73%), and NO y (EMEP: 8%, 36%). This is in line with the findings that the model calculates higher concentrations (NO x ) and/or uses higher dry deposition velocities. There is a striking difference in the influence of the Boundary and Initial conditions on the source-receptor matrices for oxidised nitrogen. The EMEP model suggests that about 3% of the deposition in the Netherlands is due to sources outside Europe, whereas in the case of oxidised sulphur, this is only 3%. This implies that for nitrogen oxide emission reductions, it might be necessary to go beyond Europe to reach environmental objectives for Europe. Concentration and Deposition The concentrations of SO 2 in the Netherlands as calculated by the EMEP model agree well with the measurements; however, the concentrations of NO x and NH 3 show differences when compared with the measurements. The SO 2 air concentrations in the Netherlands that were calculated with the EMEP model are similar to both the results and the LML measurements. The NO x concentrations calculated by the EMEP

6 RIVM report 5372 page 6 of 32 model are about 5% lower than the concentrations, and about 4% lower than the measured concentrations for all years. For the NH 3 concentrations, EMEP results are close to results, but both are 3% to 4% lower than the measured concentrations, confirming the existence of the so-called ammonia gap. The wet deposition in the Netherlands as calculated with the EMEP model is about 25% higher for oxidised nitrogen than the measurements and about 2% lower for reduced nitrogen. For oxidised sulphur the agreement with measurements improves, from about 3% higher for 199 to about the same for The wet deposition in the Netherlands as calculated by the EMEP model is about 2-5% higher for all compounds than the wet deposition calculated by the model. The differences between the EMEP and models for the wet deposition of oxidised sulphur decreased from 81% for 1985 to 19% for 2; especially the last few years showed good agreement with the measurements. The dry deposition in the Netherlands as calculated with the EMEP model is lower than that calculated with the model. On average, the EMEP model calculations for oxidised sulphur, oxidised nitrogen and reduced nitrogen were, respectively, about 15%, 55% and 35% lower than with the model. The total deposition (dry + wet) for oxidised sulphur and reduced nitrogen is about the same in both models. This is due to higher wet and lower dry deposition in the EMEP model compared with the model. The total deposition for oxidised nitrogen is about 2% lower in the EMEP than in the model. The parameterisation of dry deposition velocities in the EMEP model is not consistent. The influence of temperature, humidity and surface wetness on the canopy resistance varies between NH 3 and SO 2. The (uncertain) effect of the co-deposition of SO 2 -NH 3 was not modelled consistently for either gas. It is recommended here to re-evaluate the dry deposition formulation of nonstomatal resistance, especially for wet conditions, on the basis of original experimental data. Considerable discrepancies were found between models in the dry deposition of SO x, NO y, and NH x, while the impact of high dry deposition velocities on SO 2 and NH 3 transport and deposition is large. Although the total (dry + wet) deposition of these compounds is modelled similarly in the EMEP and models, the differences between the contributions of dry and wet deposition have large effects on source-receptor matrices, especially for NO y. The modelling of NO x in the EMEP model is probably not correct; this has implications for the NO x source-receptor matrices. Emissions The geographical distribution of SO x and NO x EMEP emissions does not change in the course of 198 to 2. This is valid for the low and high emission categories and all the sector emissions in a selected set of countries (Germany, The Netherlands, Poland), i.e., for all the years the same fraction of the total emissions of a sector is emitted per grid cell. This absence of changes in geographical distribution in emissions will likely affect the comparison between modelled and measured concentrations, especially for Eastern Europe. The ratio between the EMEP emissions in the high and low emission categories is, per grid cell, the same throughout This holds for both the SO x and NO x emissions for all grid cells in the three selected countries.

7 RIVM report 5372 page 7 of 32 Samenvatting Een geselecteerde set analyses zijn uitgevoerd dor RIVM-MNP voor de evaluatie van het EMEP Unified (Euleriaanse) model. De analyses concentreerden zich op de depositie parameterisatie voor verzurende stoffen, de concentratie en depositie van SO x, NO x, en NH x in Nederland, de bron-receptor matrices voor Nederland en de geografische verdeling van emissies. Voor de evaluatie zijn de resultaten van het EMEP model vergeleken met die van het model en met metingen in Nederland. De volgende conclusies kunnen worden getrokken met betrekking tot het EMEP Unified model: Het EMEP Unified model geeft vrij goede resultaten met betrekking tot de concentratie en depositie van de meeste verzurende stoffen in Nederland. Bron-receptor matrices De bron-receptor matrices voor geoxideerd zwavel (SO x ) berekend door het EMEP model komen goed overeen met die van het model. De overeenkomst voor gereduceerd stikstof (NH x ) is redelijk. Voor gereduceerd stikstof berekend het EMEP model een grotere bijdrage aan de depositie op Nederland van België en Duitsland en een lagere bijdrage van Nederland. Grote afwijkingen worden gevonden tussen het EMEP en model voor de bronreceptor matrices voor geoxideerd stikstof (NO y ). De lokale depositie bijdrage van Nederlandse emissies aan de depositie in Nederlandse is een factor vier hoger in het model dan in het EMEP model. De Nederlandse emissies dragen slechts 8% bij aan de depositie in Nederland. In de vorige versie van het Euleriaanse model was dit 3-35% en in het EMEP Lagrangiaanse model 15-2%. De NO y bijdragen van België en Duitsland zijn nu ook veel kleiner in het EMEP model dan in het model. Deze verschillen kunnen gevolgen hebben voor de emissiereducties in landen welke nodig zijn om milieukwaliteitsdoelstellingen te halen. Een vergelijk van de resultaten met metingen in Nederland laat zien dat het EMEP model de NO x concentraties en droge depositie sterk onderschat en de natte depositie licht onderschat. De relatieve bijdrage van de Nederlandse emissies aan de depositie in Nederland is altijd hoger in het model dan in het EMEP model. Voor SO x (EMEP: 2%, : 24%), NH x (EMEP: 58%, : 73%) en NO y (EMEP: 8%, 36%). Dit is in overeenstemming met de bevindingen dat het model hogere concentraties (NO x ) berekend en/of hogere droge depositie snelheden gebruikt. Er is een opvallend verschil in de invloed van de Grens- en Begincondities op de bron-receptor matrices van geoxideerd stikstof. Het EMEP suggereert dat ongeveer 3% van de depositie in Nederland is afkomstig van bronnen buiten Europa, terwijl dat slechts 3% is voor geoxideerd zwavel. Dit dat er emissies reducties voor stikstofoxiden buiten Europa nodig om milieukwaliteitsdoelstelling in Europa te halen. Concentratie en depositie De door het EMEP model berekende concentratie van SO 2 in Nederland komt goed overeen met metingen, maar de concentraties van NO x en NH 3 vertonen verschillen ten opzichte van de metingen. De concentraties in de lucht in Nederland berekend met het EMEP model liggen dicht bij de resultaten van het model en dicht bij de LML metingen. De NO x concentraties van het EMEP model liggen ongeveer 5% lager dan de concentraties en ongeveer 4% lager dan de metingen voor alle jaren. Voor NH 3

8 RIVM report 5372 page 8 of 32 liggen de EMEP resultaten dicht bij de resultaten, maar beide zijn 3% tot 4% lager dan de metingen, waarmee beide modellen het bestaan van het zo genoemde ammoniakgat bevestigen. De natte depositie in Nederland berekend met het EMEP model ligt voor geoxideerd stikstof ongeveer 25% hoger dan de metingen en voor gereduceerd stikstof ongeveer 2% lager. De overeenkomst met de metingen voor geoxideerd zwavel verbetert van ongeveer 3% hoger in 199 tot ongeveer gelijk in De natte depositie in Nederland berekend met het EMEP model is voor alle stoffen ongeveer 2-5% hoger dan berekend met het model. Het verschil tussen beide modellen in natte depositie van geoxideerd zwavel neemt af van 81% in 1985 tot 19% in 2 en speciaal voor de latere jaren is er een goede overeenkomst met de metingen. De droge depositie in Nederland berekend met het EMEP model is lager dan berekend met het model. Gemiddeld is het EMEP model ongeveer 15%, 55% en 35% lager dan het model voor respectievelijk, geoxideerd zwavel, geoxideerd stikstof en gereduceerd stikstof. De totale depositie (droog + nat) is ongeveer gelijk in beide modellen voor geoxideerd zwavel en gereduceerd stikstof. Dit komst door de hogere natte en lagere droge depositie in het EMEP model ten opzichte van het model. De totale depositie voor geoxideerd stikstof is ongeveer 2% lager in het EMEP dan het model. De parameterisatie van de droge depositiesnelheden in het EMEP model is niet erg consistent. De invloed van de temperatuur, vochtigheid en oppervlakte natheid op de canopy weerstand wordt verschillend behandeld voor NH 3 en SO 2. Tevens wordt het (onzekere) effect van de co-depositie SO 2 -NH 3 niet consistent gemodelleerd voor beide gassen. Het wordt aanbevolen om de formulering van de droge depositie voor de nietstomatale weerstand, speciaal voor natte condities, te herevalueren aan de hand van de originele experimenten. Er zijn aanzienlijke verschillen tussen modellen in de droge depositie van SO x, NO y en NH x, terwijl de invloed van grote droge depositiesnelheden op het transport van SO 2 en NH 3 groot is. Alhoewel de totale (droog + nat) depositie van deze stoffen ongeveer hetzelfde is voor het EMEP en model, hebben de verschillen in de bijdragen van de droge en natte depositie grote effecten voor de bron-receptor matrices, speciaal voor NO y. De modellering van NO x in het EMEP model is waarschijnlijk niet correct, hetgeen implicaties heeft voor de bron-receptor matrices. Emissies De geografische verdeling van de SO x en NO x EMEP emissies blijft constant door de jaren heen in de periode 198, Dit geldt zowel voor de hoge en lage emissiecategorieën als voor alle sectoremissies in een geselecteerde set landen (Duitsland, Nederland, Polen), dat wil zeggen, voor alle jaren wordt per gridcel dezelfde fractie van de totale emissies van een sector geëmitteerd. Dit ontbreken van een verandering in de geografische verdeling van de emissies kan effecten hebben voor het vergelijk tussen gemodelleerde en gemeten concentraties, speciaal voor Oost Europa. De verhouding tussen de EMEP emissies in de hoge en lage emissiecategorieën is, per gridcel, hetzelfde voor alle jaren in de periode 198, Dit geldt voor alle gridcellen in de drie geselecteerde landen en voor de SO x en NO x emissies.

9 RIVM report 5372 page 9 of Introduction The EMEP Steering Body commissioned its Task Force on Measurements and Modelling (TFMM) to arrange for an evaluation of the new EMEP Unified (Eulerian) model as part of its working plan for 23. At its 4 th meeting in Valencia, Spain, in April 23, the Task Force agreed on the general terms of the review to address the suitability of the model for assessing the regional concentrations and long range transboundary fluxes of sulphur, oxidised and reduced nitrogen, VOCs, ozone and suspended particulate matter. The Task Force agreed to have the review, commissioned by the Steering Body, completed for a workshop in Oslo in November 23. The EMEP Eulerian Model evaluation consists of three elements: I. Examination of processes included in the EMEP Eulerian model. II. Evaluation of the model performance compared with observations of key species. III. Evaluation of the source-receptor relationships for sulphur, nitrogen, ozone and suspended particulate matter (PM mass). Contributions from experts participating in the work of the TFMM are expected to: Consider the choice of process and meteorological parameterisations, chemical mechanisms and the sources of model input data employed in the EMEP Model. Quantify what would be considered as state-of-the-art in terms of model performance compared with observations based on their own national modelling studies. Identify key field campaigns for model evaluation purposes. Examine source-receptor relationships determined from their own national modelling studies. More details on the items I-III and the possible contributions from experts can be found in a document by MSC-West (L. Tarrasón). The results of the Eulerian model evaluation can be found in three EMEP reports (Simpson, 23; Tarrasón, 23a,b). TNO-MEP and RIVM-MNP have co-ordinated their contributions to the evaluation. The TNO-MEP contribution consists of a model intercomparison aimed at establishing the performance of the EMEP model compared with other models for several years (in task II-5) and of scenario calculations with the LOTOS model (in task III-3). The RIVM-MNP contribution, described in this report, consisted of the following: Evaluation of the EMEP deposition parameterisation for acidifying compounds (in task I-3); see section 2. Documentation on the parameterisations used in the EMEP model is compared with information available in the literature. Deposition velocities of primary (SO 2, NO x, NH 3 ) compounds are compared with values in the RIVM-MNP s DEPAC deposition parameterisation scheme (also used in the model). Evaluation of EMEP model results on a finer grid scale (in task II-6); see section 3. The grid size of the EMEP model has decreased from 15 x 15 km to a current resolution of 5 x 5 km. The locations of the EMEP observational network used to validate the EMEP model are located in Europe on background sites that are widely separated. The performance of the EMEP model on the 5 x 5 km grid is tested by comparing the EMEP results with output from the model (5 x 5 km grid) for yearly average

10 RIVM report 5372 page 1 of 32 concentrations and depositions of SO 2, NO x, and NH 3 for the Netherlands for In addition, the results of both models are compared with spatially averaged observations of the RIVM s Netherlands air quality monitoring network (LML). Evaluation of source-receptor relationship for the Netherlands (in task III); see section 4. The EMEP source-receptor relationship (blame-matrices) for NO x, SO x and NH x depositions are compared with the results, with the focus on the Netherlands, i.e. emissions in the Netherlands compared to deposition there, and foreign emissions compared to deposition in Netherlands for the year 2. Evaluation of the geographical distribution of emissions used by the EMEP model (in task I-3); see section 5. The changes in geographical distribution of the SO x and NO x emissions of several countries is compared for This evaluation is clearly not comprehensive. Due to the strict time-frame for the whole EMEP evaluation (less than six months) and the limited available time at RIVM-MNP for this new project (1 weeks), we had to make use of available data and analyses. The analyses discussed in this report are therefore limited to statements and observations. The research described in this report was presented at the EMEP s TFMM meeting in Oslo on November 3-5, 23.
 for NO x, SO x and NH x depositions are compared with the results, with the focus on the Netherlands, i.e. emissions in the Netherlands compared to deposition there, and foreign emissions compared to deposition in Netherlands for the year 2.")
11 RIVM report 5372 page 11 of Deposition parameterisation The dry deposition process is an important removal process for almost all gas-phase atmospheric pollutants. In emission areas it even dominates over wet removal processes, certainly if emission sources are close to the surface. As such, it largely determines not only the long-range transport of pollutants, but also the actual deposition load to ecosystems. The results of modelling wet deposition can be verified with (direct) observations. This is, unfortunately, not the case with dry deposition and, therefore, a comparison between models can be considered as the next best approach. Dry deposition is usually described in transport models with a dry deposition velocity, where the dry deposition load is the product of the dry deposition velocity (V d ) and the atmospheric concentration. In the first long-range transport models, a fixed velocity was used, e.g..8 m s -1 for SO 2. Such velocities were usually based on literature reviews of field experiments. In a next stage V d was simulated with the so-called resistance model, in which (substance-independent) meteorological processes were distinguished from and substancespecific processes, the former usually expressed as the aerodynamic resistance and the latter as the canopy resistance. In the present Eulerian EMEP model an attempt has been made to split the substance-specific processes into sub-processes such as stomatal leaf uptake and non-stomatal leaf surface uptake, the latter in relation to the level of other pollutants (codeposition). Dry deposition velocities can be measured in the field. The most common method is to determine the dry deposition-induced vertical concentration gradients. In practice this means that very small concentration differences have to be measured, which requires extremely sensitive and stable equipment. In addition, one has to be extremely careful to avoid local disturbances. In principle, the outcome of such experiments is only valid for a specific substance, a specific vegetation type and (probably) a specific pollution climate. It is not surprising that reviews of the earlier publications of dry deposition velocities showed a very wide range of values. Next to field campaigns one can simulate (measure) the dry deposition process in a laboratory. The advantage is that the conditions can be controlled and the influence of sub processes can be examined, but the disadvantage is that it is hard to translate laboratory results to field circumstances. In the present context it is not so much the question if certain dry deposition processes (such as co-deposition) exist, but more the question of there being enough data to support practical parameterisations. Several years ago, the dry deposition parameterisation scheme, DEPAC, (Erisman et al., 1994) was developed at RIVM. This scheme is based on measurements carried out in the framework of the EUROTRAC/BIATEX programme and on literature data. DEPAC has been implemented in (inferential) models such as EDACS (Van Pul et al., 1995; Erisman and Draaijers, 1995), in the Dutch model (Van Jaarsveld, 1995) and in (an older version of) the EMEP model (Seland et al., 1995). Since then experimental work has been done in the EC-financed LIFE programme (Erisman et al., 21) and in the framework of EUROTRAC-2 sub-project, BIATEX-2 (GRAMINAE project, Sutton et al., 1999).
 observations.")
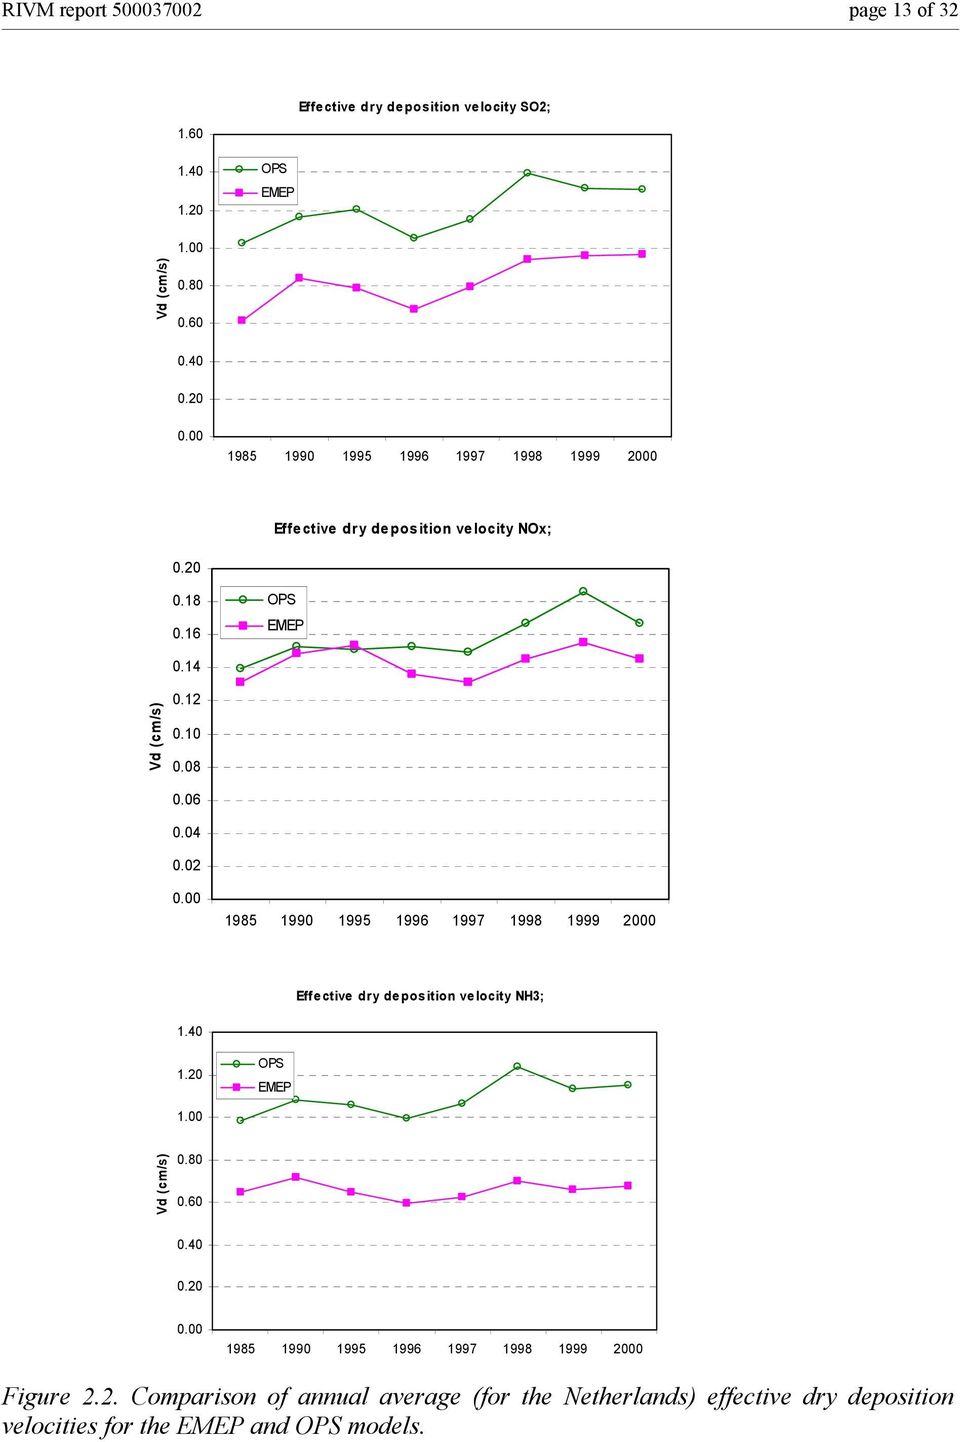
12 RIVM report 5372 page 12 of Comparison of overall dry deposition velocities EMEP and Nowadays dry deposition parameterisations have so many variables that it not easy to see what the relevant differences are. Therefore, as a first comparison, the effective annual average dry deposition velocity is calculated for the EMEP and models. This is done by dividing the total dry deposition flux by the concentration of the primary substance (SO 2, NO x, NH 3 ). This does not exactly provide the dry deposition velocity for the primary substance, since total dry deposition includes the dry deposition of secondary products. However, in case of the Netherlands, the error made is not large and, moreover, it is for purposes of comparison only. The effective dry deposition velocities are shown for the EMEP and models in Figure 2.2. The first conclusion is that year-to-year variations are quite similar, probably pointing to meteorological influences being similar in both models. The dry deposition velocities in the model are remarkably higher than in the EMEP model for SO 2 and NH 3, and comparable for NO y. To see what causes the difference between the two models it is necessary to look at the parameters used in both models. The resistance model for dry deposition of SO 2 or NH 3 to vegetation, applied in the EMEP model, is given in Figure 2.1. Common in almost all models are the aerodynamic resistance R a and the quasi-laminar layer resistance R b. Especially R a depends strongly on the roughness of the surface and is therefore very different for such aspects as forest- and grass-covered surfaces. Dry deposition is assumed to take place along two pathways: via the stomata characterised by R stom and via other (external or non-stomatal) pathways, here characterised by a single resistance R ns. Of these two resistances, R stom is the most elaborated in the literature and has, most of the time, by far also the highest value of the two. Therefore we concentrate on R ns. This resistance represents the uptake of SO 2 and NH 3 on the external parts of the vegetation, e.g., in droplets or water films at the leaf surfaces. It is therefore a function of the chemical composition of the moisture, temperature, air humidity and/or surface wetness. Resistance model for SO 2 and NH 3 R a R b R ns R stom Figure 2.1. The resistance model applied in the EMEP model.
.")
13 RIVM report 5372 page 13 of Effective dry deposition velocity SO2; EMEP 1. Vd (cm/s) Effective dry deposition velocity NOx; EMEP Vd (cm/s) Effective dry deposition velocity NH3; EMEP 1. Vd (cm/s) Figure 2.2. Comparison of annual average (for the Netherlands) effective dry deposition velocities for the EMEP and models.
14 RIVM report 5372 page 14 of 32 In Figure 2.3 the value of R ns is given as a function of the relative humidity for average conditions in the Netherlands (molar SO 2 /NH 3 ratio =.9, temperature = 9 o C). The model has a lower R ns under all conditions. For wet surfaces the model uses a value of 5 s/m, while the EMEP value has a lower limit of 17 s/m. Assuming that the sum of R a and R b has a value of 5 s/m, V d has a value of.18 m/s for the model and.15 for the EMEP model. In case of a relative humidity of 9% these values are.18 and.77 s/m, respectively. Except for the dependency on humidity, the approaches differ, also in their dependencies on parameters such as temperature and molar SO 2 /NH 3 ratios. However, the essential difference between the dry deposition parameterisation in the two models is shown in Figure 2.3; it explains to a large extent why the effective dry deposition velocity in Figure 2.2 (bottom panel) deviates so much between the two models. 1 Non-stom atal resistance NH3 vs RH 1 Rns (s/m) 1 EMEP RH (%) Figure 2.3. Comparison of the non-stomatal resistance formulations for NH 3. 1 Non-stomatal resistance vs relative humidity 1 Rns (s/m) 1 1 EMEP: dry conditions EMEP:wet conditions : dry conditions : wet conditions RH (%) Figure 2.4. Comparison of the non-stomatal resistance formulations for SO 2.

15 RIVM report 5372 page 15 of 32 A similar difference between the EMEP and models exists for the non-stomatal resistance of SO 2. Here, the EMEP model recognises two conditions: dry and wet, while in both conditions the resistance varies as a function of the molar SO 2 /NH 3 ratio. The 'dry' resistance approaches the wet resistance at 1% relative humidity. The DEPAC parameterisation as applied in the model considers a 'wet' condition at a relative humidity of more than 87%. R ns is independent of the SO 2 /NH 3 ratio. In the EMEP model the 'wet' condition exists if there is actual rainfall. The frequency of occurrence of 'wet' is likely to be much higher in the model than in the EMEP model. This leads to lower R ns (on average) and, consequently, higher dry deposition velocities. Given the discrepancies and considering the impact of high V d values on SO 2 and NH 3 transport and deposition, it is recommended to re-evaluate R ns formulations (especially for wet conditions) on the basis of original experimental data. 2.2 General comments on dry deposition parameterisations Dry deposition determines to a large extent the long-range transport capabilities of pollutants and at the same time the atmospheric load of the pollutants to ecosystems. Therefore, sourcereceptor matrices calculated by long-range transport models are sensitive to the choice of dry deposition parameters (see section 4). The non-stomatal resistance for ozone is formulated in the EMEP model in a more complex way than for SO 2 or NH 3. The reason mentioned for this is that the ozone case has been evaluated more extensively. The resistance model for ozone includes an additional dry deposition pathway, namely via the canopy through the soil or ground cover. One of the variables is the Leaf Area Index, a function of vegetation type. Basically, there is no difference between dry deposition pathways for the various substances. A uniform approach could make parameterisations more transparent, also in terms of the differences between land use types. The non-stomatal resistance formulation for NH 3 in the EMEP model contains dependencies on temperature, molar SO 2 /NH 3 ratios and humidity. One should expect similar dependencies for SO 2 and other soluble gases because the same processes and the same interaction are concerned. In the EMEP model the formulation for SO 2 is much simpler, while probably much more literature data is available. When it comes to non-linearity issues, the dry deposition dependency between NH 3 and SO 2 may play an important role in future. The non-stomatal resistance formulation for NH 3 in the EMEP model describes more or less the expected dependencies on parameters such as temperature, humidity and the pollution climate. All these parameters are theoretically defendable and to some extent observed in the laboratory. However, current field experiments are not distinctive enough to positively support a reliable quantification of the necessary parameters.

16 RIVM report 5372 page 16 of EMEP versus on a 5 x 5 km grid The grid size of the EMEP model has decreased from about 15 x 15 km to a current resolution of about 5 x 5 km (the EMEP grid cells are exactly 5 x 5 km but only at 6ºN). The EMEP observational network used to validate the model are located far apart on background sites in Europe. These observations alone might not be sufficient to validate the variability of the EMEP model on the 5 x 5 km grid scale. To test the performance of the EMEP model on the 5 x 5 km grid, we compared its results with output from the model (Van Jaarsveld, 1995) for yearly average concentrations of SO 2, NO x, and NH 3, as well as dry and wet depositions of oxidised sulphur, oxidised nitrogen and reduced nitrogen for the Netherlands for 1985, 199 and The EMEP results are also compared with observations for the Netherlands. In the Netherlands the model is used for the calculation concentrations and deposition of acidifying compounds. By combining a Gaussian plume model for local transport using a trajectory model for the long-range transport, the model is capable of calculating the effects of very local emission sources (< 1 m), as well as contributions from foreign sources, for example. The model has been validated by comparing SO 2, NO x and NH 3 concentrations and depositions with measurements from the RIVM s Netherlands air quality monitoring network (LML) (Elzakker, 21). To compare the model results (RIVM, 23) with the EMEP model results, the model results on a 5 x 5 km grid resolution were converted to the EMEP grid format on a 5 x 5 km resolution. The conversion was done as follows: the average of all the grid cells was taken for each EMEP grid cell. Of the cell centres lying in the EMEP grid cell, only cells of which more than 45% of the area of the EMEP grid cell occurred within the area were considered for the comparison; the average and standard deviation in the results was calculated. Background values were added to the dry and wet depositions calculated by the model to account for emissions from outside Europe and the North Sea. The background values for the dry and wet deposition of oxidised sulphur were 38 and 134 mg S/m 2, respectively. For the dry and wet deposition of oxidised nitrogen, these were 18 and 5 mg N/m 2, respectively, and for the dry and wet deposition of reduced nitrogen, 67 and 38 mg N/m 2, respectively. As an example of the conversion, the concentrations of NH 3 in air are shown in Figure 3.1. The top panel in Figure 3.1 shows the NH 3 concentration on the grid of 5 x 5 km and the bottom left panel shows the concentration on the EMEP grid of 5 x 5 km. For comparison, the bottom right panel of Figure 3.1 shows the NH 3 concentrations of the EMEP model. In Figure 3.2, the concentrations and depositions calculated with the model are compared with those of the EMEP model per grid cell for the year 2, being representative of all years between with respect to the correlation and the slope of the leastsquares fit of the correlation s. In general, there is a large dispersion in the converted results for each EMEP grid cell, especially at high concentrations (Figure 3.2). For SO 2 and NH 3, the EMEP and concentrations agree quite well, the EMEP concentrations are slightly higher for most grid cells. For NO x, the model calculates much higher concentrations for each cell than the EMEP model, almost a factor of two. This underestimation of the NO x concentration in the EMEP model might be related to the fact that Eulerian (grid) models often have difficulties with the large spatial gradients in NO x close to emission sources. After being emitted, NO x is distributed over the whole grid cell, resulting in a larger reduction in concentration than in reality.

17 RIVM report 5372 page 17 of 32 The dry deposition (Figure 3.2) calculated by the EMEP model is much lower than that calculated by the model for oxidised and reduced nitrogen. For most grid cells, the dry deposition of the EMEP model is, for oxidised sulphur, lower than that of the model, but for low values, both agree quite well. The wet deposition calculated by the EMEP model is always much higher than in the model for all three components. In Tables 3.1 to 3.4 and Figures 3.3 to 3.6 the averaged concentrations and depositions of the EMEP model are compared with those of the model and with measurements. For comparing the averaged concentrations and depositions the data are averaged over the area of the Netherlands. The average values are calculated using a weighted mean of the fraction of the EMEP cell covering the Netherlands. The measurements are taken from the RIVM s Netherlands air quality monitoring network (LML) (Elzakker, 21). Figure 3.1. Air concentration of NH 3 (in µg m -3 ) in the Netherlands from the model (top panel), from the model converted to the EMEP grid (bottom left panel), and from the EMEP model (bottom right panel).

18 RIVM report 5372 page 18 of concentration SO2, 2 y =.835x R 2 =.7299 concentration NOx, 2 25 y = 1.944x R 2 = concentration NH3, 2 y =.8688x R 2 = (µg S/m3) (µg N/m3) 15 1 (µg N/m3) EMEP (µg S/m3) EMEP (µg N/m3) EMEP (µg N/m3) dry deposition, oxidised Sulphur, 2 dry deposition, oxidised Nitrogen, 2 12 y = x R 2 = dry deposition, reduced Nitrogen, 2 25 y = 1.491x R 2 = (mg S/m2) (mg N/m2) (mg N/m2) EMEP (mg S/m2) EMEP (mg N/m2) EMEP (mg N/m2) 12 1 wet deposition, oxidised Sulphur, wet deposition, oxidised Nitrogen, 2 y =.649x R 2 =.515 wet deposition, reduced Nitrogen, 2 16 y =.6561x R 2 = (mg S/m2) (mg N/m2) (mg N/m2) EMEP (mg S/m2) EMEP (mg N/m2) EMEP (mg N/m2) Figure 3.2. Correlation between the EMEP and results for the concentrations in air of SO 2, NO x and NH 3 and the dry and wet deposition of oxidised sulphur (SO x ) along with oxidised (NO y ) and reduced (NH x ) nitrogen in the Netherlands for 2. The results were converted to the EMEP grid. The vertical bars represent the variability (standard deviation) in the grid cells.

19 RIVM report 5372 page 19 of 32 Table 3.1. Concentration 1 of SO 2 (µg S m -3 ), NO x and NH 3 (µg N m -3 ) in the Netherlands from the model, the Eulerian EMEP model and LML observations 2. SO 2 NO x NH 3 year EMEP 3 LML EMEP 3 LML EMEP 3 LML (.74) (3.6) (1.58) (.5) (2.8) (1.78) (.32) (2.5) (1.66) (.31) (2.5) (1.35) (.28) (2.4) (1.48) (.26) (1.9) (1.23) (.24) (2.) (1.46) (.22) (1.9) (1.26) 4.8 Table 3.2. Dry deposition 1 of oxidised sulphur (mg S m -2 ) and oxidised and reduced nitrogen (mg N m -2 ) in the Netherlands from the model and the Eulerian EMEP model. oxidised Sulphur, SO x oxidised Nitrogen, NO y reduced Nitrogen, NH x year EMEP 3 LML EMEP 3 LML EMEP 3 LML (799) (143) (365) (618) (12) (451) (373) (18) (415) (349) (113) (333) (33) (15) (381) (317) (1) (377) (272) (16) (45) (253) ( 95) (357) - Table 3.3. Wet deposition 1 of oxidised sulphur (mg S m -2 ) and oxidised and reduced nitrogen (mg N m -2 ) in the Netherlands from the model, the Eulerian EMEP model and LML observations 1. oxidised Sulphur, SO x oxidised Nitrogen, NO y reduced Nitrogen, NH x year EMEP 3 LML EMEP 3 LML EMEP 3 LML (85) (16) (72) (63) (12) (7) (43) (11) (54) (33) ( 7) (39) (38) ( 7) (46) (55) (11) (62) (44) (13) (52) (43) (11) (5) 939 Table 3.4. Total (dry + wet) deposition 1 of oxidised sulphur (mg S m -2 ) and oxidised and reduced nitrogen (mg N m -2 ) in the Netherlands from the model and the Eulerian EMEP model. oxidised Sulphur, SO x oxidised Nitrogen, NO y reduced Nitrogen, NH x year EMEP LML EMEP LML EMEP LML ) Values are averaged over the area of the Netherlands using the EMEP grid. 2) Observations from the LML network (Elzakker, 21) represent the average for the area of the Netherlands. 3) The average variability (standard deviation of the average) in the grid cells mapped onto the EMEP grid is given in parentheses.
 1.5 5.49 1.7 (1.9) 9.3 3.45 3.6 (1.23) 4.6 1999 1.81 1.67 (.24) 1.57 5.15 1. (2.) 8.4 3.51 3.55 (1.46) 5.2 2 1.85 1.6 (.22) 1.54 5.43 1.2 (1.9) 8.2 3.38 3.7 (1.26) 4.8 Table 3.2. Dry deposition 1 of oxidised sulphur (mg S m -2 ) and oxidised and reduced nitrogen (mg N m -2 ) in the Netherlands from the model and the Eulerian EMEP model.")
20 RIVM report 5372 page 2 of 32 Concentration of SO2 Concentration of NOx Concentration of NH3 ug S m LML EMEP ug N m LML EMEP ug N m LML EMEP Figure 3.3. Comparison of the concentrations in air of SO 2, NO x and NH 3 in the Netherlands for the EMEP and models and the LML measurements. Dry deposition of oxidised Sulphur Dry deposition of oxidised Nitrogen Dry deposition of reduced Nitrogen mg S m EMEP mg N m EMEP mg N m EMEP Figure 3.4. Comparison of the dry deposition of oxidised sulphur and oxidised and reduced nitrogen in the Netherlands for the EMEP and models. 25 Wet deposition of oxidised Sulphur 8 Wet deposition of oxidised Nitrogen 12 Wet deposition of reduced Nitrogen mg S m LML EMEP mg N m LML EMEP mg N m LML EMEP Figure 3.5. Comparison of the wet deposition of oxidised sulphur and oxidised and reduced nitrogen in the Netherlands for the EMEP and models and the LML measurements. 4 Total deposition of oxidised Sulphur 14 Total deposition of oxidised Nitrogen 25 Total deposition of reduced Nitrogen mg S m EMEP mg N m mg N m EMEP 5 EMEP Figure 3.6. Comparison of the total (dry + wet) deposition of oxidised sulphur and oxidised and reduced nitrogen in the Netherlands for the EMEP and models.

21 RIVM report 5372 page 21 of 32 Comparing the yearly averaged SO 2 concentration in the Netherlands (Table 3.1 and Figure 3.3, we found that concentrations calculated with the EMEP model for the later years were close to the results and the measurements. The EMEP values are always slightly higher than the results and the measurements, except for 1985 when the EMEP model yielded values about 15% below the measurements. The NO x concentrations calculated with the EMEP model are about 5% lower than the concentrations and about 4% lower than the measured concentrations for all the years. This underestimation of the NO x concentrations by the EMEP model, compared with the measurements, is in agreement with the EMEP report (Simpson et al., 23). They find a somewhat smaller underestimation by considering two stations (Kollumerwaard and Vredepeel) with for Dutch standards low NO x concentrations. For the NH 3 concentrations, the EMEP results are close to the results, but both are 3 to 4% lower than the measured concentrations. This occurrence, in combination with the fact that both models underestimate the wet deposition of NH x, confirms the existence of the so-called ammonia gap (Van Jaarsveld and Van Pul, 22). The dry deposition calculated with the EMEP model is lower than that calculated with the model for all compounds, while the wet deposition is always higher. Consequently, the total (dry + wet) deposition of both models are similar, especially for oxidised sulphur. The dry deposition of the EMEP model is lower than the model, by an average of about 15%, 55%, and 35%, for oxidised sulphur, oxidised nitrogen, and reduced nitrogen, respectively. There are no measurements to compare these dry depositions with. The dry deposition is determined by the concentration in the air and the dry deposition velocity (see section 4.1). Using a larger dry deposition, velocity will almost proportionally increase the dry deposition, but result in a (small) decrease in the atmospheric concentration. Due to conservation of mass, the wet deposition decreases if the dry deposition increases, resulting in only a small change in the total deposition. The wet deposition calculated with the EMEP model is higher for all compounds (about 2-5%) than that calculated with the model. The differences between the EMEP and models for the wet deposition of oxidised sulphur decreased from 81% in 1985 to 19% in 2. Especially for the later years, there is a good agreement with the measurements. The wet deposition of oxidised and reduced nitrogen of the EMEP model is about 25% higher and about 2% lower, respectively, than the measurements. The standard deviation around the average values in the grid cells is shown in Figure 3.2 and Tables 3.1 to 3.3 to express the fact that the concentrations and depositions of the grid cells on a 5 x 5 km grid scale exhibit considerable variation. Closer investigation of this variability shows that it is about a constant percentage of the average value and that there is no trend over the years in this variability. For example, the standard deviation of the grid cells for the SO 2 concentration in air is on average about 12% for all years.
22 RIVM report 5372 page 22 of Source-receptor relationships for the Netherlands The model (Van Jaarsveld, 1995) is used at RIVM-MNP to calculate source-receptor relationships for NO x, SO x and NH x deposition. A full evaluation of the source-receptor relationship for Europe requires a large number of scenario calculations with a European model due to the non-linearity of the processes involved. This is outside the scope of this analysis and of the current version of the model. This chapter compares the contribution of countries to the deposition in the Netherlands, as calculated by the EMEP and models. For this purpose the year 2 is selected. The EMEP data is taken from the EMEP Status Report 1/23 Part III (Tarrasón et al., 23) and the data from the calculations carried out in the framework of the Netherlands Environmental Balance 23 (RIVM, 23). The data are calculated on the basis of the same national emission totals as used in the EMEP model; however, the spatial distribution was not the same nor were the physical properties of the emission sources (release height, heat content, spatial resolution). The spatial resolution for emissions in the Netherlands, Belgium and Germany was 5 x 5 km, while large point source emissions were treated as point sources conforming with their exact locations. Separate 5 x 5 km distributions were used for the remaining (non-point source) emissions, segregated into specific categories (industrial, mobile sources, inland shipping, agricultural sources etc.). The comparison is based on the sum of the deposition on the Netherlands territory. Because the area considered in the two models is not the same surface area (: km 2, EMEP: km 2 ), the data will be systematically lower than the EMEP data. However, a simple scaling on the basis of the respective surface areas would lead to an overestimation, because the EMEP area includes more of the surrounding waters where deposition is lower than on the land area. In order to be compatible with the comparison in section 3, we have not applied a correction factor. The comparison on the total deposition may therefore differ from what is given in section 3. Results are given in Table 4.2 and Figure 4.1 One difference in approach between the EMEP and the models is that the Eulerian EMEP model applies a much larger Boundary Initial Conditions (BIC) at the model domain boundaries than the model. One can consider them as background concentrations accounting for trans-atlantic transport, for example. The initial concentrations represent, in fact, a source term and signify a certain contribution to the Netherlands. A similar problem applies to the model. Since only anthropogenic emissions in Europe are considered and no shipping emissions are taken into account (except North Sea emissions), background contributions are added to the model results. These depositions are based on estimates made by Locht and Van Aalst (1988). Table 4.1 provides the values for the different compounds. Table 4.1. Background depositions applied to the Netherlands. Unit dry wet total NO y mg N m -2 a NH x mg N m -2 a SO x mg S m -2 a
23 RIVM report 5372 page 23 of 32 Table 4.2. Deposition contributions to the Netherlands 1 according to the EMEP and the models for the year 2. SO x (1 tonne S) NO y (1 tonne N) NH x (1 tonne N) EMEP EMEP EMEP NL BE DE FR GB other Eur countries NOS BAS MED ATL BIC # # 37 # Total ) The grid and total area used in the EMEP model differs here from the area used in the model, which gives a difference in the absolute values between the models. Furthermore, figures in this table can not be directly compared with those in section 3 (Figure 3.6 and Table 3.4). 2) NOS = North Sea; BAS = Baltic Sea; MED = Mediterranean; ATL = Atlantic; BIC = Boundary and Initial Conditions #) Background value, accounting for non-european and natural source contributions (see section 3). The following observations can be made with respect to the source-receptor matrices (Table 4.2 and Figure 4.1): The source-receptor matrices for SO x calculated by the two models are in good agreement. The agreement for reduced nitrogen is reasonable. The EMEP model calculates larger contributions from Belgium and Germany and a lower contribution from the Netherlands. The relative contribution from the Netherlands to the Netherlands is always higher in the model than in the EMEP model: for SO x EMEP is 2% and : 24%), for NH x, EMEP is 58% and 73% and for NO y EMEP is 8% and 36%). This is in line with the findings in chapter 3 that the model calculates higher concentrations (NO x ) and/or uses higher dry deposition velocities (SO 2 and NH 3 ; see also chapter 2, Figure 2.1). The largest discrepancies are found for oxidised nitrogen. Here, the local deposition contribution of Dutch emissions to the Netherlands is a factor of 4 higher than in the EMEP model. The Dutch emissions contribute only 8% to the emissions in the Netherlands. This was 3-35% in the pervious version of the Eulerian model and 15-2% in the Lagrangian model (EMEP, 21). The NO y contributions from Belgium and Germany are now also much lower in the EMEP model than in the model. A comparison of model results with observations in the Netherlands (chapter 3) illustrates that the EMEP model strongly underestimates NO x concentrations and dry deposition, while the wet deposition is overestimated. This is not related to the combination of low sources and a low vertical resolution of the model, as can be seen in the case of NH 3 where local concentrations are much less underestimated.
24 RIVM report 5372 page 24 of 32 Another striking difference is the influence of BIC for oxidised nitrogen. The EMEP model suggests that almost 3% of the deposition is due to sources outside Europe. In the previous version of the EMEP Eulerian model, this BIC term contributed only 3-5% to the deposition of NO y in the Netherlands. Apparently, the EMEP model has difficulties modelling oxidised nitrogen. The EMEP model reports no contributions of BIC for NH x. It is unclear if these are either not taken into account or are not significant. At the TFMM workshop in Oslo in November 23 the data of Table 4.2 was discussed with EMEP. They explained that the SRMs calculated by the EMEP UNIFIED model (EMEP Status Report 1/23 Part III, Tarrasón et al., 23) are not the final results. They explained that the large BIC term for NO y is not a true boundary condition, but comes from the way the SRMs for NO y are calculated. They are still working on the SRM calculations and expect to have SRMs ready for integrated assessment studies by May 24.
25 RIVM report 5372 page 25 of 32 EM EP SOx deposition to NL in 2 SOx deposition to NL in 2 Northsea 14% BIC+ oceans 5% NL 2% BIC+ oceans 13% NL 24% other Eur. Countries 8% GB 16% FR 1% DE 9% BE 18% Northsea 13% other Eur. Countries 6% GB 13% FR 7% DE 9% BE 15% EMEP model NHx deposition to NL in 2 m odel NHx deposition to NL in 2 GB 3% FR 1 % other Eur. Countries 3% B IC+ oceans % GB 2% FR 3% DE 7% o ther Eur. Countries 1% B IC+ o ceans 6% DE 11% BE 8% NL 58% BE 15 % NL 73% EMEP model NOx deposition to NL in 2 model NOx deposition to NL in 2 BIC+ oceans 35% NL 8% BE 4% DE 6% o ther Eur. Countries 6% Northsea 1 % BIC+ oceans 7% NL 36% FR 12 % GB 13 % Northsea 9% other Eur. Countries 8% GB 18 % Figure 4.1. Deposition contributions to the Netherlands according to the EMEP and models for the year 2. FR 8% DE 12 % BE 8%
26 RIVM report 5372 page 26 of Distribution of emissions In Task I of the evaluation EMEP compared the model results with measurements for This comparison depends strongly on the emissions and their geographical distribution as used in the EMEP model. Countries were requested to report their emissions and the geographical distribution of the emissions to EMEP. We have compared the geographical distributions of the EMEP s SO x and NO x emissions on the 5 x 5 km grid for selected countries, i.e., Germany, The Netherlands and Poland and selected years, 198 and from In Germany and Poland significant changes in the geographical distribution of the SO x and NO x emissions from 198 to 2 are be expected as a result of changes in the economies of these countries. Investigated were the low and high emission categories and the emissions per sector. Tables 5.1 and 5.2 show the SO x and NO x emissions for the low and high emission categories, as obtained from the EMEP website (Webdab, 22). The ratios between the emissions in both categories are shown as the percentage emitted per grid cell (compared with the total emission in the country). It can be seen that: 1. the ratio between the emissions in the high and low emission categories is, per grid cell, the same for all the years in the period (i.e., 198, ). This holds for all grid cells in the three selected countries and for both the SO x and NO x emissions. 2. the geographical distribution of the SO x and NO x emissions (low and high emission categories) in the selected countries is identical for all of 198 and , i.e. the same fraction of the total emissions in a country is emitted in the grid cells for all years. 3. the ratio between emissions in the high and low emission categories for Poland is the same for all cells and all years. The EMEP emissions are also subdivided in 11 sectors, e.g. combustion, transport, etc. The percentage of the emissions in the grid cells, compared with the total emission in the country, is analysed for Germany, The Netherlands and Poland for the years 198 and The data for Germany are shown in Table 5.3 for the three sectors with the largest emissions and for the years 198 and 2. From this table it can be seen that: 4. the geographical distribution of the SO x and NO x emissions of all sectors in the selected countries does not change through the years 198-2, i.e. the same fraction of the total emissions of a sector in a country is emitted in the grid cells for all years. The absence of changes in geographical distribution in the EMEP emissions from 198 to 2 will likely affect the comparison between modelled and measured concentrations. This will hold especially for Eastern Europe, where large changes in emissions and their geographical distributions are expected due to the changes in their economies since the 198s. The effects for Western Europe will probably be much smaller. The emissions discussed here are obtained from the EMEP website (Webdab, 22). By the end of October 23 EMEP released the new version of the emission database, Webdab 23. An analysis of the new emissions showed that, although some numbers have changed, the conclusions about the constant geographical distributions, are still valid. The emissions show changes in geographical distributions only for the years 2 and 21. In a discussion, after this report was placed on the EMEP website, EMEP explained that the low and high emissions of Webdab 22 have not been used for the Unified model. They also explained that, although countries are requested to report geographical distributions of their emissions, many don't send this information to EMEP and EMEP uses what is available.
27 RIVM report 5372 page 27 of 32 Table 5.1. Geographical distribution of SO x emissions on the EMEP 5 x 5 km grid for Germany, The Netherlands and Poland for 198 and 2, showing the emissions (in Mg SO 2 ) in the low and high emission categories for the grid cells with the largest emissions (in 198), and the ratio between the high and low emission categories and the percentage of the emissions in the grid cells compared with the total emission in the country 1. Country Cell Low emissions High emissions Ratio high/low Percentage total: low Percentage total: high i j Germany Germany Germany Germany Germany Germany Germany Germany Germany Germany Country total Netherlands Netherlands Netherlands Netherlands Netherlands Netherlands Netherlands Netherlands Netherlands Netherlands Country total Poland Poland Poland Poland Poland Poland Poland Poland Poland Poland Country total ) The data of only a few grid cells per country and two years are shown, but the same results can be seen for all grid cells and all the years in 198 and ) The country total is calculated over all grid cells in a country in general, not only the ones shown here.
28 RIVM report 5372 page 28 of 32 Table 5.2. Geographical distribution of NO x emissions on the EMEP 5 x 5 km grid for Germany, The Netherlands, and Poland for 198 and 2. Shown are the emissions (in Mg NO 2 ) in the low and high emission categories for the grid cells with the largest emissions (in 198), as well as the ratio between the high and low emission categories and the percentage of the emissions in the grid cells compared with the total emission in the country 1. Country Cell Low emissions High emissions Ratio high/low Percentage total: low Percentage total: high i j Germany Germany Germany Germany Germany Germany Germany Germany Germany Germany Country total Netherlands Netherlands Netherlands Netherlands Netherlands Netherlands Netherlands Netherlands Netherlands Netherlands Country total Poland Poland Poland Poland Poland Poland Poland Poland Poland Poland Country total ) The data of only a few grid cells per country and two years are shown, but the same results can be seen for all grid cells and all of 198 and ) The country total is calculated over all grid cells in a country in general, not only the ones shown here.
29 RIVM report 5372 page 29 of 32 Table 5.3. Geographical distribution of SO x emissions on the EMEP 5 x 5 km grid for the three largest emissions sectors for Germany for 198 and 2. Shown are the emissions (in Mg SO 2 ) for the grid cells with the largest emissions (in 198, as well as the percentage of the emissions in the grid cells compared with the total emission in the country 1. Cell Emissions in 198 Emissions in 2 Percentage of country total i j 1 Energy industries 2 Nonindustrial 3 Manufacturing 1 Energy industries 2 Nonindustrial 3 Manufacturing 1 Energy industries 2 Non-industrial 3 Manufacturing Total ) The data of only a few grid cells for some sectors and two years are shown. However, the same results can be seen for all grid cells, for Germany, The Netherlands and Poland, for all 11 sectors and for all of 198, and , as well as for the NO x emissions. 2) The country total is calculated over all grid cells in a country in general, not only the ones shown here.
30 RIVM report 5372 page 3 of Discussion The EMEP Unified model gives a fair picture of the Netherlands for most acidifying compounds. The source-receptor matrices for oxidised sulphur calculated by the EMEP and models are in good agreement, while the agreement for reduced nitrogen is reasonable. Large discrepancies between the models are found for oxidised nitrogen. The total deposition of NO y in the EMEP model is about the same as in the model, but the contribution from emissions in the Netherlands is much lower in the EMEP model. This difference can be traced back to the lower dry deposition and higher wet deposition of NO y in the EMEP model compared with the model. Consequently, in the EMEP model the deposition of NO y is more a transboundary issue than in the model. Furthermore, the NO x concentration in the EMEP is about 4% less than the measurements, indicating that a large fraction of the NO x emissions is transported out of the Netherlands. We have shown that this can not be the result of a dry deposition velocity in the EMEP model that is too low, since the model also calculates a low dry deposition. It is also not likely that it is caused by sources outside Europe that are too large. Possible causes of the problems with NO x /NO y in the EMEP model might be that: The model does not properly take into account the contribution of low emission sources, e.g., cars, heating of houses. The limited vertical resolution of the model results in surface concentrations of NO x that are too low. A surface correction term might be needed to convert the grid concentration to a surface concentration. There is a mismatch in the chemical balance of nitrogen species (NO x, NO y ), e.g., too much HNO 3, PAN or other secondary species are produced, reducing the NO x concentration. The contributions of the boundary and initial conditions are too large in the model, resulting in a too large contribution to NO x concentrations from a long distance relative to local contributions. A detailed study of all the nitrogen species in the EMEP model is necessary to resolve this issue.
31 RIVM report 5372 page 31 of 32 Literature EMEP, Transboundary acidification, eutrophication and ground level ozone in Europe, EMEP Summary report 1/21, ISSN , 21. Elzakker, B.G., Monitoring activities in the Dutch national air quality monitoring network, RIVM report no , RIVM, Bilthoven, Netherlands, 21. Erisman, J.W., van Pul, A., and Wyers P., Parameterization of surface resistance for the quantification of atmospheric deposition of acidifying pollutants and ozone, Atmos. Environment, 28, , Erisman, J.W., and Draaijers, G.P.J., Atmospheric deposition in relation to acidification and eutrophication, Studies in Environmental Research, 63, Elsevier, Netherlands, 45, Erisman, J.W, Hensen, A., Fowler, D., Flechard, C.R., Grüner, A., Spindler, J.H. Duyzer, J.H., Weststrate, H.,Römer, F., Vonk, A.W. and van Jaarsveld, H., Dry deposition monitoring in Europe. Water, Air and Soil Pollution, Focus, 1, 17-27, 21. Locht, J.V., and van Aalst, R.M., Deposition of acidifying compounds to the Netherlands due to non-anthropogenic sources, TNO Report R 88/458 (in Dutch), Apeldoorn, NL, RIVM, website Seland, O., A. van Pul, A. Sorteberg, and J.-P. Tuovinen, Implementation of a resistance dry deposition module and a variable local correction factor in the Lagrangian EMEP model, EMEP/MSC-W report 3/95, ISSN , Simpson, D., H. Fagerli, J.E. Jonson, S. Tsyro, P. Wind, J.-P. Tuovinen, Transboundary acidification, eutrophication and ground level ozone in Europe, Part I, Unified EMEP model description, EMEP status report 23, ISSN , 23. Sutton, M.A., Nemitz, E., Milford, C., Fowler, D., Schjoerring, J.K., Husted,S., Mattson, M., Erisman, J.W., Cellier, P., Loubet, B., Neftel, A., Blatter, A., Horvath, L., Führer, E., Papakosta D., Kokoura, Z., Mantzanas, K., Gallagher, M., and Williams, P., GRAMINAE: A new initiative to examine biosphere-atmosphere interactions of ammonia with grasslands across Europe. In: Proceedings of EUROTRAC Symposium 1998, , P.M. Borrell and P. Borrell, eds., WIT press, Southampton, UK, Tarrasón, L. (ed), H. Fagerli, D. Simpson, S. Tsyro, S. Solberg, W. Ass, Transboundary acidification, eutrophication and ground level ozone in Europe, Part II, Unified EMEP model performance, EMEP status report 23, ISSN , 23a. Tarrasón, L., J.E. Jonson, H. Fagerli, A. Benedictow, P. Wind, D. Simpson, H. Klein, Transboundary acidification, eutrophication and ground level ozone in Europe, Part III, Source-receptor relationships, EMEP status report 23, ISSN , 23b. Van Jaarsveld, J.A., Modelling the long-term atmospheric behaviour of pollutants on various spatial scales, Thesis University Utrecht, RIVM report , RIVM, Bilthoven, Van Jaarsveld, J.A., and van Pul, W.A.J., Berekende ammoniakconcentraties in Nederland vergeleken met de intensiveringsmetingen met passieve samplers, RIVM report (in Dutch), RIVM, Bilthoven, 22. Van Pul, W.A.J., C.J.M. Potma, E.P. van Leeuwen, G.P.J. Draaijers, andj.w. Erisman, EDACS: European deposition maps of acidyfying components on a small scale, Model description and preliminary results, RIVM report , RIVM, Bilthoven, Webdab, UNECE/EMEP WebDab emissions database 22, 22.
32 RIVM report 5372 page 32 of 32 Appendix Mailing list 1 Directeur DGM Klimaatverandering en Industrie, C.M. Zwartepoorte 2 Directeur Milieu- en Natuurplanbureau, N.D. van Egmond 3 Adjunct Directeur Milieu- en Natuurplanbureau, F. Langeweg 4 A.P.M. Blom (DGM/KvI) 5 K. Krijgsheld (DGM/KvI) 6 J. Lenstra (DGM/KvI) 7 P. Ruyssenaars (DGM/KvI) 8 K. Sanders (DGM/KvI) 9 C.J. Sliggers (DGM/KvI) 1 M. Amann (IIASA) 11 P.J.H. Builtjes (TNO/MEP) 12 R. Derwent (EMEP/TFMM) 13 J.W. Erisman (ECN) 14 M. van Loon (TNO/MEP) 15 L. Tarrason (EMEP) 16 J. Aben (LED) 17 R. Albers (LVM) 18 J.P. Beck (LED) 19 R.J.M. Folkert (LED) 2 P. Hammingh (LED) 21 J.-P. Hettelingh (LED) 22 B.A. Jimmink (LED) 23 F. Langeweg (MNP) 24 F. de Leeuw (LED) 25 R.J.M. Maas (NMD) 26 J. Matthijsen (LED) 27 W.A.J. van Pul (LDL) 28 M.B. Posch (LED) 29 F. Sauter (LED) 3 C.J.P.P. Smeets (LED) 31 K. Wieringa (LED) Auteurs 36 Depot Nederlandse Publicaties en Nederlandse Bibliografie 37 SBC/Communicatie 38 Bureau Rapporten registratie 39 Bibliotheek RIVM 4-44 Bureau Rapportenbeheer Reserve exemplaren
Cost overruns in Dutch transportation infrastructure projects
 Cost overruns in Dutch transportation infrastructure projects Chantal C. Cantarelli Delft University of Technology [email protected] Bijdrage aan het Colloquium Vervoersplanologisch Speurwerk 19
EMISSIONS OF AIR POLLUTANTS IN THE UK, 1970 TO 2014
 STATISTICAL RELEASE: 17 DECEMBER 2015 EMISSIONS OF AIR POLLUTANTS IN THE UK, 1970 TO 2014 There has been a long term decrease in the emissions of all of the air pollutants covered by this statistical release
Revealing the costs of air pollution from industrial facilities in Europe a summary for policymakers
 Revealing the costs of air pollution from industrial facilities in Europe a summary for policymakers A new European Environment Agency (EEA report, Revealing the costs of air pollution from industrial
Impacts of air pollution on human health, ecosystems and cultural heritage
 Impacts of air pollution on human health, ecosystems and cultural heritage Air pollution causes damage to human health, crops, ecosystems and cultural heritage The scientific data presented in this brochure
Impact Assessment of Dust, NOx and SO 2
 Impact Assessment of Dust, NOx and SO 2 By Pat Swords Content of the Presentation Historical Basis for Air Pollution Control Impacts of air pollutants on human health, etc. Impact Pathway Approach to assessing
GMP-Z Annex 15: Kwalificatie en validatie
 -Z Annex 15: Kwalificatie en validatie item Gewijzigd richtsnoer -Z Toelichting Principle 1. This Annex describes the principles of qualification and validation which are applicable to the manufacture
Economic and Social Council
 United Nations Economic and Social Council ECE/EB.AIR/WG.1/2013/10 Distr.: General 30 July 2013 English only Economic Commission for Europe Executive Body for the Convention on Long-range Transboundary
Sintermann discussion measurement of ammonia emission from field-applied manure
 Sintermann discussion measurement of ammonia emission from field-applied manure Jan Huijsmans, Julio Mosquera and Arjan Hensen 9 April 2013 During the1990 s the measurement methods for ammonia (NH 3 )
Costs of air pollution from European industrial facilities 2008 2012 an updated assessment
 Costs of air pollution from European industrial facilities 2008 2012 an updated assessment Summary In 2012, air pollution from European industrial facilities cost at least EUR 59 billion (and up to EUR
CO-BRANDING RICHTLIJNEN
 A minimum margin surrounding the logo keeps CO-BRANDING RICHTLIJNEN 22 Last mei revised, 2013 30 April 2013 The preferred version of the co-branding logo is white on a Magenta background. Depending on
Emissions estimate from forest fires: methodology, software and European case studies
 Emissions estimate from forest fires: methodology, software and European case studies Carlo Trozzi, Rita Vaccaro, Enzo Piscitello Techne srl, Via Nicola Zabaglia, 3 I00153 Roma, Italy [email protected]
Trends in Particulate Matter
 Trends in Particulate Matter This is a publication of the Netherlands Research Program on Particulate Matter BOP report Trends in Particulate Matter R. Hoogerbrugge (RIVM), H. A. C. Denier van der Gon
Air Quality Appraisal Damage Cost Methodology
 www.defra.gov.uk Air Quality Appraisal Damage Cost Methodology Interdepartmental Group on Costs and Benefits, Air Quality Subject Group February 2011 Damage costs are one way of approximating the impacts
A Comparative Case Study on the Relationship between EU Unity and its Effectiveness in Multilateral Negotiations
 Is the Sum More than its Parts? A Comparative Case Study on the Relationship between EU Unity and its Effectiveness in Multilateral Negotiations PhD thesis by: Louise van Schaik, July 2010 Promoter/ PhD
Research Department. J. Jakulj, N. Jonker and H.M.M. Peeters. Research Memorandum WO no. 742. De Nederlandsche Bank
 Research Department Employment dynamics within small, medium and large establishments in the Netherlands at the end of the 1990s: Where and to what extent did job creation and job destruction occur? J.
Is het nodig risico s te beheersen op basis van een aanname..
 Is het nodig risico s te beheersen op basis van een aanname.. De mens en IT in de Zorg Ngi 19 april 2011 René van Koppen Agenda Er zijn geen feiten, slechts interpretaties. Nietzsche Geen enkele interpretatie
Review on the scientific underpinning of calculation of ammonia emission and deposition in the Netherlands
 Review on the scientific underpinning of calculation of ammonia emission and deposition in the Netherlands Members of the Review Panel Mark A. Sutton (chair) Ulrike Dragosits Camilla Geels Steen Gyldenkærne
Relationele Databases 2002/2003
 1 Relationele Databases 2002/2003 Hoorcollege 5 22 mei 2003 Jaap Kamps & Maarten de Rijke April Juli 2003 Plan voor Vandaag Praktische dingen 3.8, 3.9, 3.10, 4.1, 4.4 en 4.5 SQL Aantekeningen 3 Meer Queries.
Review of the Gothenburg Protocol
 Review of the Gothenburg Protocol Review of the Gothenburg Protocol Report of the Task Force on Integrated Assessment Modelling and the Centre for Integrated Assessment Modelling CIAM report 1/2007 With
Klimaatverandering. IPCC (2013) & KNMI klimaatscenario s (2014) Rob van Dorland. GroenLinks, Utrecht 4 november 2014
 & KNMI klimaatscenario s (2014) Rob van Dorland. GroenLinks, Utrecht 4 november 2014") Klimaatverandering IPCC (2013) & KNMI klimaatscenario s (2014) Rob van Dorland KNMI GroenLinks, Utrecht 4 november 2014 Intergovernmental Panel on Climate Change, 2013 Detection observation Attribution
Klimaatverandering IPCC (2013) & KNMI klimaatscenario s (2014) Rob van Dorland KNMI GroenLinks, Utrecht 4 november 2014 Intergovernmental Panel on Climate Change, 2013 Detection observation Attribution
RIPE NCC Update. Axel Pawlik. APNIC 16, 22 August, Seoul. http://www.ripe.net
 RIPE NCC Update 1 Droogte Dried in Nederland in the Netherlands en record and lage record low water positions waterstanden (links) In de ochtenduren van 17 augustus bereikte de waterstand in de Rijn een
Emission performance of a diesel plug-in hybrid vehicle
 TNO report TNO 2015 R10858 v1 Emission performance of a diesel plug-in hybrid vehicle Van Mourik Broekmanweg 6 2628 XE Delft P.O. Box 49 2600 AA Delft The Netherlands www.tno.nl T +31 88 866 30 00 F +31
Air Pollution. Copenhagen, 3 rd September 2014. Valentin Foltescu Project manager air quality European Environment Agency
 Air Pollution Copenhagen, 3 rd September 2014 Valentin Foltescu Project manager air quality European Environment Agency Air pollution, transport and noise MAWP Strategic Area 1.1 Objective To support and
REGIONAL CLIMATE AND DOWNSCALING
 REGIONAL CLIMATE AND DOWNSCALING Regional Climate Modelling at the Hungarian Meteorological Service ANDRÁS HORÁNYI (horanyi( [email protected]@met.hu) Special thanks: : Gabriella Csima,, Péter Szabó, Gabriella
Parameterization of Cumulus Convective Cloud Systems in Mesoscale Forecast Models
 DISTRIBUTION STATEMENT A. Approved for public release; distribution is unlimited. Parameterization of Cumulus Convective Cloud Systems in Mesoscale Forecast Models Yefim L. Kogan Cooperative Institute
ATTAINMENT PROJECTIONS
 ATTAINMENT PROJECTIONS Modeling is required to assess monitored exceedances of the PM10 NAAQS at all sites that cause the District to be classified as nonattainment for the 24-hour standard. Modeling is
2) Relevance for environmental policy... 2. 4) Data sources and reporting... 5 5) References at the international level... 6
 Relevance for environmental policy... 2. 4) Data sources and reporting... 5 5) References at the international level... 6") A- 2: Ambient air quality in urban areas 1) General description... 2 1.1) Brief definition... 2 1.2) Units of measurement... 2 1.3) Context...2 2) Relevance for environmental policy... 2 2.1) Purpose...
A- 2: Ambient air quality in urban areas 1) General description... 2 1.1) Brief definition... 2 1.2) Units of measurement... 2 1.3) Context...2 2) Relevance for environmental policy... 2 2.1) Purpose...
Trace Gas Exchange Measurements with Standard Infrared Analyzers
 Practical Environmental Measurement Methods Trace Gas Exchange Measurements with Standard Infrared Analyzers Last change of document: February 23, 2007 Supervisor: Charles Robert Room no: S 4381 ph: 4352
Verona, 29-30 ottobre 2013!
 Verona, 29-30 ottobre 2013! University of Padua Dept. of Chemical Engineering Processes (DPCI) Environmental Systems Analysis Lab(LASA) Eng. Laura Ranzato Comparison between a sensorial technique (Field
measured (empirical) data from CCC. The modelled values are of value for all (ecosystem specific modelling work deposition)
 data from CCC. The modelled values are of value for all (ecosystem specific modelling work deposition)") TABLE 1. PLANNED ACTIVITIES CONCERNING ACIDIFICATION AND EUTROPHICATION DELIVERABLES WGE DELIVERABLES EMEP - Approved Eulerian modelling results - Ecosystem specific depositions - IAM as basis for negotiations
TABLE 1. PLANNED ACTIVITIES CONCERNING ACIDIFICATION AND EUTROPHICATION DELIVERABLES WGE DELIVERABLES EMEP - Approved Eulerian modelling results - Ecosystem specific depositions - IAM as basis for negotiations
IP-NBM. Copyright Capgemini 2012. All Rights Reserved
 IP-NBM 1 De bescheidenheid van een schaker 2 Maar wat betekent dat nu 3 De drie elementen richting onsterfelijkheid Genomics Artifical Intelligence (nano)robotics 4 De impact van automatisering en robotisering
A MODEL PERFORMANCE EVALUATION SOFTWARE: DESCRIPTION AND APPLICATION TO REGIONAL HAZE MODELING
 A MODEL PERFORMANCE EVALUATION SOFTWARE: DESCRIPTION AND APPLICATION TO REGIONAL HAZE MODELING Betty Pun, Kristen Lohman, Shiang-Yuh Wu, Shu-Yun Chen and Christian Seigneur Atmospheric and Environmental
Self-test SQL Workshop
 Self-test SQL Workshop Document: e0087test.fm 07/04/2010 ABIS Training & Consulting P.O. Box 220 B-3000 Leuven Belgium TRAINING & CONSULTING INTRODUCTION TO THE SELF-TEST SQL WORKSHOP Instructions The
Engineering Natural Lighting Experiences
 Engineering Natural Lighting Experiences Elke den Ouden & Emile Aarts Earth from outer space is beautiful Andre Kuipers during his ISS Expedition 31/32, 2011-2012 Earth in a sun eclipse Nothern polar region
TABLET DETERGENTS Towards A More Sustainable Future
 TABLET DETERGENTS Towards A More Sustainable Future Unilever Supports Sustainable Development of Detergents with Tablets THE CONTRIBUTION OF TABLETS Unilever is committed to meeting the needs of customers
Overweight, underpaid?
 Tilburg University Overweight, underpaid? Research on the influence of obesity on wages in the Netherlands Master thesis Sanne Metsemakers December 2010 2 Overweight, underpaid? Research on the influence
Inclusive Education : An international perspective
 Inclusive Education : An international perspective Dr Cor Meijer, director www.european-agency.org Member countries of the Agency Presently, the Agency has 27 full member countries: Austria, Belgium (French),
ABN AMRO Bank N.V. The Royal Bank of Scotland N.V. ABN AMRO Holding N.V. RBS Holdings N.V. ABN AMRO Bank N.V.
 Op 6 februari 2010 is de naam ABN AMRO Bank N.V. (geregistreerd bij de Kamer van Koophandel onder nummer 33002587) gewijzigd in The Royal Bank of Scotland N.V. Op 1 april 2010 is de naam van ABN AMRO Holding
Use of numerical weather forecast predictions in soil moisture modelling
 Use of numerical weather forecast predictions in soil moisture modelling Ari Venäläinen Finnish Meteorological Institute Meteorological research [email protected] OBJECTIVE The weather forecast models
The design of the Romanian national air quality monitoring network
 The design of the Romanian national air quality monitoring network Ecaterina SZABO NRC Air Quality Romania Senior Councilor Pollution Control and Air Quality Department Ministry of Environment and Forestry
High Resolution Modeling, Clouds, Precipitation and Climate
 High Resolution Modeling, Clouds, Precipitation and Climate Pier Siebesma, Ramon Mendez Gomez, Jerome Schalkwijk, Stephan de Roode Jisk Attema, Jessica Loreaux, Geert Lenderink, Harm Jonker 1. Precipitation
Birmingham City University / Students Union Aspects and Impacts Register. Waste. Impacts description
 Birmingham City University / Students Union and Impacts Register Waste Production of non - hazardous waste Production of hazardous waste Storage of non - hazardous waste Potential for waste to be disposed
Citrix Access Gateway: Implementing Enterprise Edition Feature 9.0
 coursemonstercom/uk Citrix Access Gateway: Implementing Enterprise Edition Feature 90 View training dates» Overview Nederlands Deze cursus behandelt informatie die beheerders en andere IT-professionals
Risk-Based Monitoring
 Risk-Based Monitoring Evolutions in monitoring approaches Voorkomen is beter dan genezen! Roelf Zondag 1 wat is Risk-Based Monitoring? en waarom doen we het? en doen we het al? en wat is lastig hieraan?
Climate Models: Uncertainties due to Clouds. Joel Norris Assistant Professor of Climate and Atmospheric Sciences Scripps Institution of Oceanography
 Climate Models: Uncertainties due to Clouds Joel Norris Assistant Professor of Climate and Atmospheric Sciences Scripps Institution of Oceanography Global mean radiative forcing of the climate system for
Spread. B&R Beurs. March 2010
 B&R Beurs March 2010 Spread Find out about the latest investment proposals of B&R's investment groups. Check the agenda, and the upcoming activities we organized for you! B&R Beurs Website: www.bnrbeurs.nl
Load Balancing Lync 2013. Jaap Wesselius
 Load Balancing Lync 2013 Jaap Wesselius Agenda Introductie Interne Load Balancing Externe Load Balancing Reverse Proxy Samenvatting & Best Practices Introductie Load Balancing Lync 2013 Waarom Load Balancing?
Fire Weather Index: from high resolution climatology to Climate Change impact study
 Fire Weather Index: from high resolution climatology to Climate Change impact study International Conference on current knowledge of Climate Change Impacts on Agriculture and Forestry in Europe COST-WMO
The information in this report is confidential. So keep this report in a safe place!
 Bram Voorbeeld About this Bridge 360 report 2 CONTENT About this Bridge 360 report... 2 Introduction to the Bridge 360... 3 About the Bridge 360 Profile...4 Bridge Behaviour Profile-Directing...6 Bridge
COMMISSION DECISION C(2013)343. of 22 January 2013
343. of 22 January 2013") COMMISSION DECISION C(2013)343 of 22 January 2013 on the adoption of 2013 work programme in the Climate Action policy area, serving as a financing decision. THE EUROPEAN COMMISSION, Having regard to the
COMMISSION DECISION C(2013)343 of 22 January 2013 on the adoption of 2013 work programme in the Climate Action policy area, serving as a financing decision. THE EUROPEAN COMMISSION, Having regard to the
Self Assessment Exercise
 Self Assessment Exercise Read the following extract of supporting documentation for Permit Application for Galvos plc galvanising facility and the accompanying tables. Decide if the proposed control techniques
What are the causes of air Pollution
 What are the causes of air Pollution Pollutant Particulate Matter (PM-PM 10 and PM 2.5 ) Description and main UK sources Particulate Matter is generally categorised on the basis of the size of the particles
Coupling Forced Convection in Air Gaps with Heat and Moisture Transfer inside Constructions
 Coupling Forced Convection in Air Gaps with Heat and Moisture Transfer inside Constructions M. Bianchi Janetti 1, F. Ochs 1 and R. Pfluger 1 1 University of Innsbruck, Unit for Energy Efficient Buildings,
Big data, the future of statistics
 Big data, the future of statistics Experiences from Statistics Netherlands Dr. Piet J.H. Daas Senior-Methodologist, Big Data research coordinator and Marco Puts, Martijn Tennekes, Alex Priem, Edwin de
CCI-HYDR Perturbation Tool. A climate change tool for generating perturbed time series for the Belgian climate MANUAL, JANUARY 2009
 CCI-HYDR project (contract SD/CP/03A) for: Programme SSD «Science for a Sustainable Development» MANUAL, JANUARY 2009 CCI-HYDR Perturbation Tool A climate change tool for generating perturbed time series
New Zealand s response to climate change. March 2008 www.nzinstitute.org
 New Zealand s response to climate change March 2008 www.nzinstitute.org THE AIM OF THIS PRESENTATION This presentation summarises the research, analysis, and recommendations made in the New Zealand Institute
Partnership in Environmental Governance. Swedish Environmental Protection Agency
 Partnership in Environmental Governance Swedish Environmental Protection Agency ISBN 978-91-620-8495-0. PRINT: CM Gruppen, Stockholm, 10-11. PRODUCTION: Swedish EPA. DESIGN: Peter Hönig. PHOTO: SXC if
Assuring the Cloud. Hans Bootsma Deloitte Risk Services [email protected] +31 (0)6 1098 0182
6 1098 0182") Assuring the Cloud Hans Bootsma Deloitte Risk Services [email protected] +31 (0)6 1098 0182 Need for Assurance in Cloud Computing Demand Fast go to market Support innovation Lower costs Access everywhere
Assuring the Cloud Hans Bootsma Deloitte Risk Services [email protected] +31 (0)6 1098 0182 Need for Assurance in Cloud Computing Demand Fast go to market Support innovation Lower costs Access everywhere
employager 1.0 design challenge
 employager 1.0 design challenge a voyage to employ(ment) EMPLOYAGER 1.0 On the initiative of the City of Eindhoven, the Red Bluejay Foundation organizes a new design challenge around people with a distance
Name of research institute or organization: École Polytechnique Fédérale de Lausanne (EPFL)
") Name of research institute or organization: École Polytechnique Fédérale de Lausanne (EPFL) Title of project: Study of atmospheric ozone by a LIDAR Project leader and team: Dr. Valentin Simeonov, project
Name of research institute or organization: École Polytechnique Fédérale de Lausanne (EPFL) Title of project: Study of atmospheric ozone by a LIDAR Project leader and team: Dr. Valentin Simeonov, project
Big Data andofficial Statistics Experiences at Statistics Netherlands
 Big Data andofficial Statistics Experiences at Statistics Netherlands Peter Struijs Poznań, Poland, 10 September 2015 Outline Big Data and official statistics Experiences at Statistics Netherlands with:
Comparison of the Vertical Velocity used to Calculate the Cloud Droplet Number Concentration in a Cloud-Resolving and a Global Climate Model
 Comparison of the Vertical Velocity used to Calculate the Cloud Droplet Number Concentration in a Cloud-Resolving and a Global Climate Model H. Guo, J. E. Penner, M. Herzog, and X. Liu Department of Atmospheric,
Business opportunities by legislative developments in infrastructure, environment, water and waste management
 Source: Agency NL Poland: Business opportunities by legislative developments in infrastructure, environment, water and waste management 05-07-2012 1-6 1.1 Motorways National roads and motorways are owned
COOLS COOLS. Cools is nominated for the Brains Award! www.brainseindhoven.nl/nl/top_10/&id=507. www.cools-tools.nl. Coen Danckmer Voordouw
 Name Nationality Department Email Address Website Coen Danckmer Voordouw Dutch / Nederlands Man and Activity [email protected] www.danckmer.nl Project: Image: Photographer: Other images: COOLS CoenDVoordouw
Dutch Mortgage Market Pricing On the NMa report. Marco Haan University of Groningen November 18, 2011
 Dutch Mortgage Market Pricing On the NMa report Marco Haan University of Groningen November 18, 2011 Introductory remarks My comments are complementary: I do not focus so much on this market as such, more
GUIDELINE FOR THE INSTALLATION AND OPERATION OF CONTINUOUS EMISSION MONITORING SYSTEMS (CEMS) AND THEIR USE FOR REPORTING UNDER THE PROVISIONS OF
 AND THEIR USE FOR REPORTING UNDER THE PROVISIONS OF") GUIDELINE FOR THE INSTALLATION AND OPERATION OF CONTINUOUS EMISSION MONITORING SYSTEMS (CEMS) AND THEIR USE FOR REPORTING UNDER THE PROVISIONS OF REGULATION O.Reg. 127/01 Ontario Ministry of the Environment
GUIDELINE FOR THE INSTALLATION AND OPERATION OF CONTINUOUS EMISSION MONITORING SYSTEMS (CEMS) AND THEIR USE FOR REPORTING UNDER THE PROVISIONS OF REGULATION O.Reg. 127/01 Ontario Ministry of the Environment
Six greenhouse gases covered by the United Nations Framework Convention on Climate Change (UNFCCC) and its Kyoto Protocol are:
 and its Kyoto Protocol are:") Fact sheet: The need for mitigation United Nations Framework Convention on Climate Change Along with adaptation, mitigation is one of the two central approaches in the international climate change process.
Fact sheet: The need for mitigation United Nations Framework Convention on Climate Change Along with adaptation, mitigation is one of the two central approaches in the international climate change process.
COMMUNICATION FROM THE COMMISSION TO THE EUROPEAN PARLIAMENT, THE COUNCIL, THE EUROPEAN ECONOMIC AND SOCIAL COMMITTEE AND THE COMMITTEE OF THE REGIONS
 EUROPEAN COMMISSION Brussels, 15.7.2011 COM(2011) 441 final COMMUNICATION FROM THE COMMISSION TO THE EUROPEAN PARLIAMENT, THE COUNCIL, THE EUROPEAN ECONOMIC AND SOCIAL COMMITTEE AND THE COMMITTEE OF THE
Hydrological transport modeling
 Hydrological transport modeling Catchment modeling example from the EU EUROCAT project Catchment - river - coast continuum modeling example from MONERIS modeling Sea-air exchange modeling example from
100 Series Keyboard Tray Pivot
 00 Series Keyboard Tray Pivot INSTALLATION MANUAL USA -800-888-8458 Europe +3 0 3.9.39 A B 3/3" 4x 8-3 x 5/6" Ergonomics Ergonomía Ergonomie Ergonomi 888-99-04 REMOVE PIVOT COVERS IF ALREADY ATTACHED.
Policy on Monitoring of Stack Emissions to Air at EPA Licensed Sites
 Policy on Monitoring of Stack Emissions to Air at EPA Licensed Sites 1. OVERVIEW In Ireland at present there are no mandatory minimum criteria specified in relation to the completion of stationary source
Regulation for the upstream and downstream navigation of 8,000 and more TEU container vessels to the port of Antwerp with a maximum draught of 145 dm
 Regulation for the upstream and downstream navigation of 8,000 and more TEU container vessels to the port of Antwerp with a maximum draught of 145 dm 1. In general In order to gain an insight into the
MAYORGAME (BURGEMEESTERGAME)
") GATE Pilot Safety MAYORGAME (BURGEMEESTERGAME) Twan Boerenkamp Who is it about? Local council Beleidsteam = GBT or Regional Beleidsteam = RBT Mayor = Chairman Advisors now = Voorlichting? Official context
GATE Pilot Safety MAYORGAME (BURGEMEESTERGAME) Twan Boerenkamp Who is it about? Local council Beleidsteam = GBT or Regional Beleidsteam = RBT Mayor = Chairman Advisors now = Voorlichting? Official context
EEA Technical report No 6/2012
 EEA Technical report No 6/2012 Reporting by the Member States under Directive 2001/81/EC of the European Parliament and of the Council of 23 October 2001 on national emission ceilings for certain atmospheric
MCQ - ENERGY and CLIMATE
 1 MCQ - ENERGY and CLIMATE 1. The volume of a given mass of water at a temperature of T 1 is V 1. The volume increases to V 2 at temperature T 2. The coefficient of volume expansion of water may be calculated
IMPACT OF TRAUMA HELICOPTERS ON AIR QUALITY INSIDE HOSPITALS. J.F.W. Koopmans Peutz bv, Mook, The Netherlands, [email protected].
 IMPACT OF TRAUMA HELICOPTERS ON AIR QUALITY INSIDE HOSPITALS ABSTRACT J.F.W. Koopmans Peutz bv, Mook, The Netherlands, [email protected] Many modern hospitals use trauma helicopters (air ambulances)
Air Quality Modeling and Simulation
 Air Quality Modeling and Simulation A Few Issues for HPCN Bruno Sportisse CEREA, Joint Laboratory Ecole des Ponts/EDF R&D INRIA/ENPC CLIME project TeraTech, 20 June 2007 B. Sportisse Air Quality Modeling
Titelmasterformat durch Klicken. bearbeiten
 Evaluation of a Fully Coupled Atmospheric Hydrological Modeling System for the Sissili Watershed in the West African Sudanian Savannah Titelmasterformat durch Klicken June, 11, 2014 1 st European Fully
SOUTH EAST EUROPE TRANSNATIONAL CO-OPERATION PROGRAMME
 SOUTH EAST EUROPE TRANSNATIONAL CO-OPERATION PROGRAMME 3 rd Call for Proposals Terms of reference Climate Change Adaptation: assessing vulnerabilities and risks and translating them to implementation actions
THE EMOTIONAL VALUE OF PAID FOR MAGAZINES. Intomart GfK 2013 Emotionele Waarde Betaald vs. Gratis Tijdschrift April 2013 1
 THE EMOTIONAL VALUE OF PAID FOR MAGAZINES Intomart GfK 2013 Emotionele Waarde Betaald vs. Gratis Tijdschrift April 2013 1 CONTENT 1. CONCLUSIONS 2. RESULTS Reading behaviour Appreciation Engagement Advertising
Safety Analysis Nitrogen Vessel
 Safety Analysis Nitrogen Vessel Nikhef number: Item number: Date: 18/10/2010 Page: 1 of 21 47110-MT-00004 AA1409 Status: In Work Revision: A.6 Project: Gravitational Waves Virgo Cryogenic Link Department: