Cluster Analysis. Isabel M. Rodrigues. Lisboa, Instituto Superior Técnico
|
|
|
- Antony Johns
- 10 years ago
- Views:
Transcription
1 Instituto Superior Técnico Lisboa, 2014

2 Introduction: Cluster analysis What is? Finding groups of objects such that the objects in a group will be similar (or related) to one another and different from (or unrelated to) the objects in other groups Intra-cluster distances are minimized Inter-cluster distances are maximized
 the objects in other groups Intra-cluster distances are minimized")
3 Introduction: Cluster analysis What is? Cluster: a collection of data objects Similar to one another within the same cluster Dissimilar to the objects in other clusters Cluster analysis Grouping a set of data objects into clusters Clustering is unsupervised classification: no predefined classes Typical applications: As a stand-alone tool to get insight into data distribution As a preprocessing step for other algorithms

4 Introduction: Clustering Applications Marketing: discovering of distinct customer groups Land use: Identification of areas of similar land use in an earth observation database Insurance: Identifying groups of motor insurance policy holders with a high average claim cost City-planning: Identifying groups of houses according to their house type, value, and geographical location

5 Introduction: Clustering Applications Pattern Recognition Data Mining Image Processing Economic Science (especially market research) WWW Document classification Weblog clustering to identify groups of users

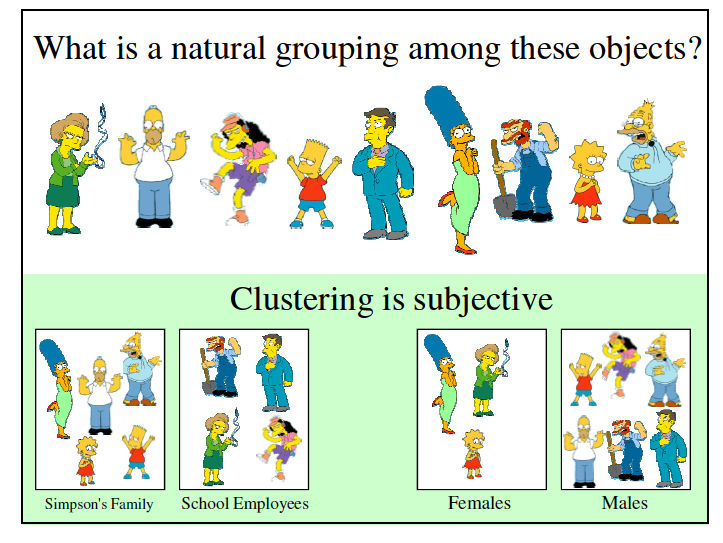
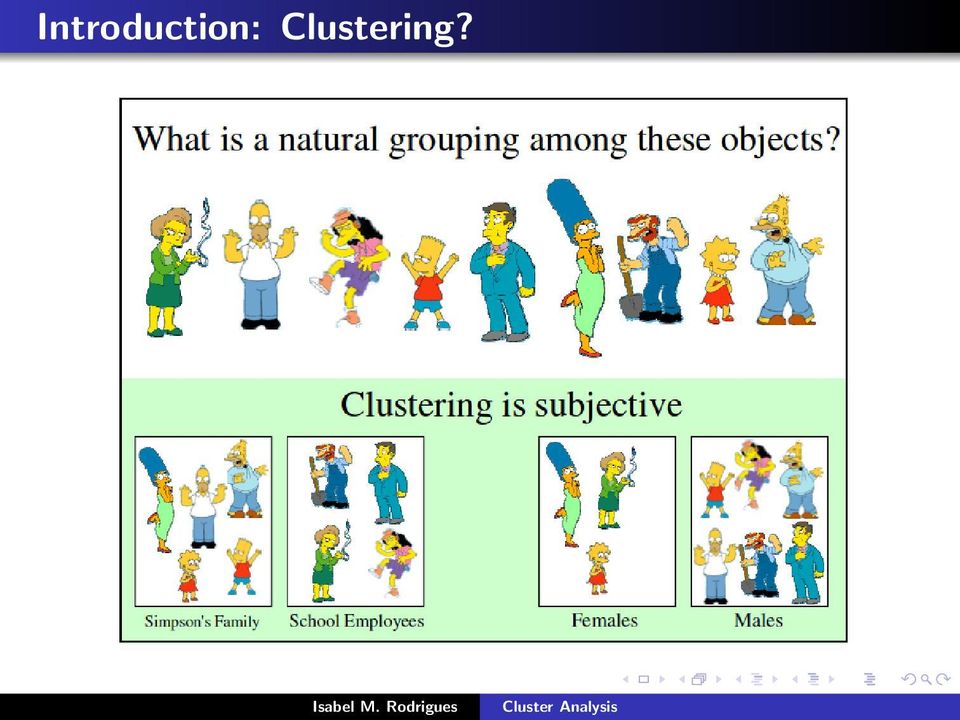
6 Introduction: Clusters analysis The notion of a cluster cannot be precisely defined. There is a common denominator: a group of data objects with homogeneity and separation principles A clustering method differs in the different notions of clusters and in the different notions of similarity/proximity

7 Introduction: Clustering?
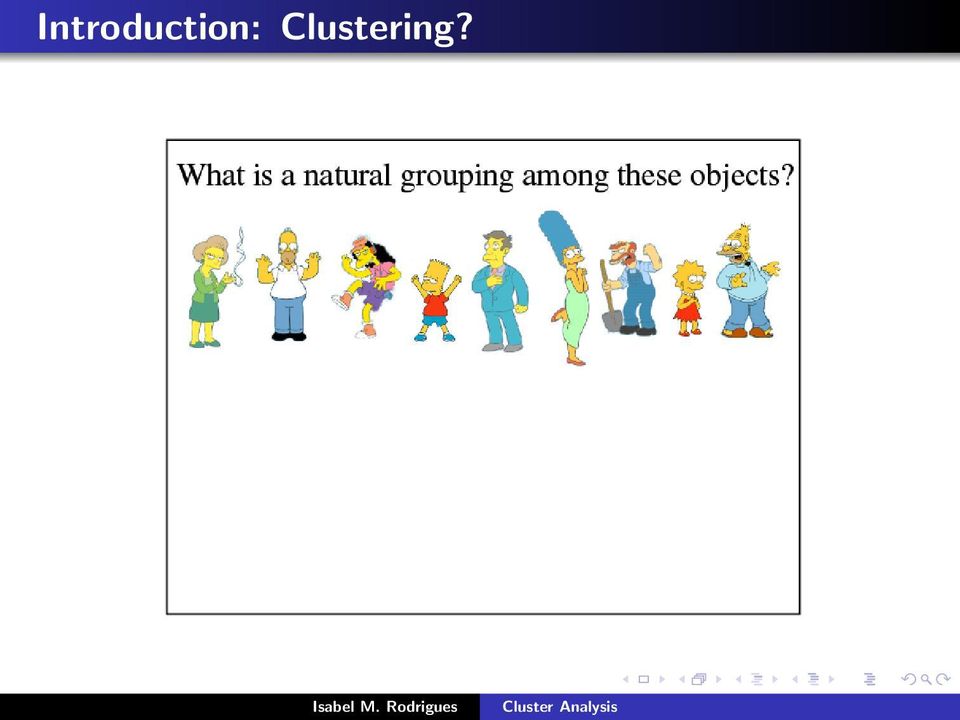
8 Introduction: Clustering?
9 Introduction: Cluster types Partitional algorithms: Construct various partitions and then evaluate them by some criterion Hierarchical algorithms: Create a hierarchical decomposition of the set of objects using some criterion

10 Introduction: Data Structures Cluster analysis operates on two kinds of data structure: Data Matrix (or design/profile matrix) - structure already used in previous methods: X = [x ij ], i = 1, 2,..., n; j = 1, 2,..., p, where x ij is the value of variable j for object i. This matrix may include: Quantitative variables (continuous or discrete) Qualitative variables (nominal or ordinal) Dissimilarity (or similarity) matrix - structure already mentioned previously: D = [d ij ] i, j = 1, 2,..., n is a square, in general symmetrical matrix, where d ij element equal to the value of a chosen measure of distinction between the i th and the j th object. This matrix can be calculated from the data or by direct observation.

11 Introduction: Data Structures Cluster analysis operates on two kinds of data structure: Data Matrix (or design/profile matrix) - structure already used in previous methods: X = [x ij ], i = 1, 2,..., n; j = 1, 2,..., p, where x ij is the value of variable j for object i. This matrix may include: Quantitative variables (continuous or discrete) Qualitative variables (nominal or ordinal) Dissimilarity (or similarity) matrix - structure already mentioned previously: D = [d ij ] i, j = 1, 2,..., n is a square, in general symmetrical matrix, where d ij element equal to the value of a chosen measure of distinction between the i th and the j th object. This matrix can be calculated from the data or by direct observation.

12 Introduction: Steps in cluster analysis 1 Object selection 2 Variable selection 3 Variable transformation 4 Create a matrix of relative dissimilarities/similarities between all objects 5 Decision on the method of combining objects into groups (graphical; hierarchic; partition; other) 6 Discussion and presentation of results (number of clusters validation/description/interpretation;)
 6 Discussion and presentation of results (number of clusters")
13 Introduction: Steps in cluster analysis 1 Object selection 2 Variable selection 3 Variable transformation 4 Create a matrix of relative dissimilarities/similarities between all objects 5 Decision on the method of combining objects into groups (graphical; hierarchic; partition; other) 6 Discussion and presentation of results (number of clusters validation/description/interpretation;)
 6 Discussion and presentation of results (number of clusters")
14 Graphical Methods Stars library(graphics) stars(setosa)

15 Graphical Methods Chernoff Faces library(aplpack) faces(setosa)

16 Hierarchical Methods There are two major types of hierarchical techniques: divisive and agglomerative Agglomerative hierarchical techniques are the more commonly used Agglomerative: This is a bottom up approach: each observation starts in its own cluster, and pairs of clusters are merged as one moves up the hierarchy. Divisive: This is a top down approach: all observations start in one cluster, and splits are performed recursively as one moves down the hierarchy The results of hierarchical clustering are usually presented in a two-dimensional diagram known ad dendrogram.


17 Hierarchical Methods: Dendrogram
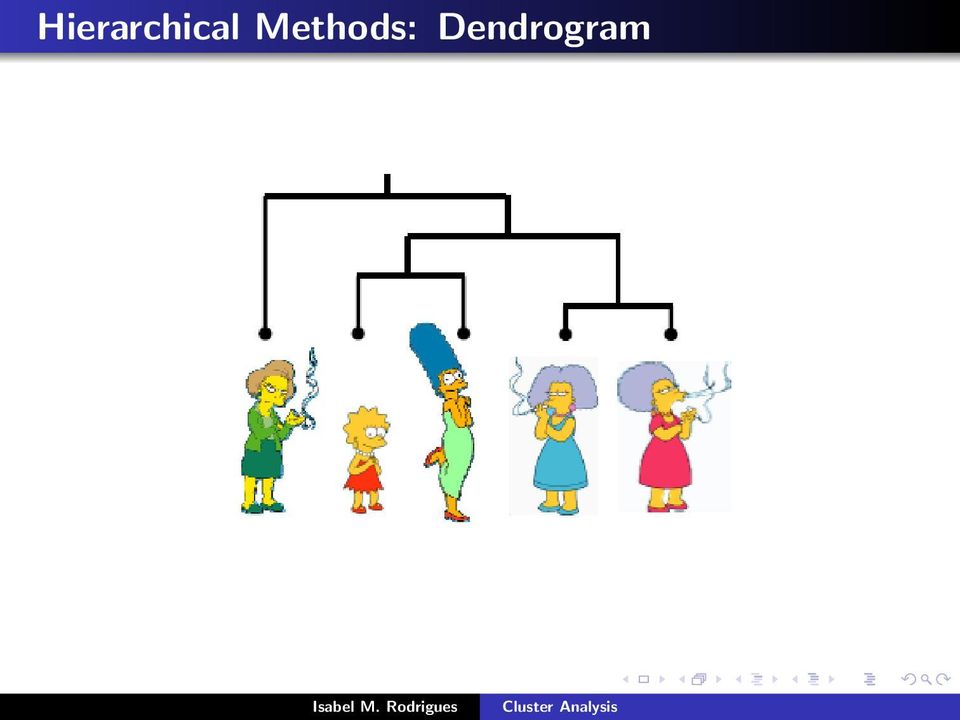
18 Hierarchical Methods 1 A dendrogram provides a highly interpretable complete description of the hierarchical clustering in a graphical format. This is one of the main reasons for the popularity of hierarchical clustering methods. 2 Cutting the dendrogram horizontally at a particular height we obtain a partition of the data into clusters 3 A dendrogram is often viewed as a graphical summary of the data rather than a description of the results of the algorithm 4 Different hierarchical methods, as well as small changes in the data, can lead to quite different dendrograms

19 Hierarchical Methods 1 A dendrogram provides a highly interpretable complete description of the hierarchical clustering in a graphical format. This is one of the main reasons for the popularity of hierarchical clustering methods. 2 Cutting the dendrogram horizontally at a particular height we obtain a partition of the data into clusters 3 A dendrogram is often viewed as a graphical summary of the data rather than a description of the results of the algorithm 4 Different hierarchical methods, as well as small changes in the data, can lead to quite different dendrograms

20 Hierarchical Methods 1 A dendrogram provides a highly interpretable complete description of the hierarchical clustering in a graphical format. This is one of the main reasons for the popularity of hierarchical clustering methods. 2 Cutting the dendrogram horizontally at a particular height we obtain a partition of the data into clusters 3 A dendrogram is often viewed as a graphical summary of the data rather than a description of the results of the algorithm 4 Different hierarchical methods, as well as small changes in the data, can lead to quite different dendrograms

21 Hierarchical Methods 1 A dendrogram provides a highly interpretable complete description of the hierarchical clustering in a graphical format. This is one of the main reasons for the popularity of hierarchical clustering methods. 2 Cutting the dendrogram horizontally at a particular height we obtain a partition of the data into clusters 3 A dendrogram is often viewed as a graphical summary of the data rather than a description of the results of the algorithm 4 Different hierarchical methods, as well as small changes in the data, can lead to quite different dendrograms
22 Hierarchical Methods Dendrogram A clustering of the data objects is obtained by cutting the dendrogram at the desired level, then each connected component forms a cluster 2
23 Hierarchical Methods Agglomerative approach... start at the bottom and at each level recursively merge a selected pair of clusters into a single cluster. This produces a grouping at the next higher level with one less cluster. The pair chosen for merging consist of the two groups with the smallest intergroup dissimilarity Divisive approach... start at the top and at each level recursively split one of the existing clusters at that level into two new clusters. The split is chosen to produce two new groups with the largest between-group dissimilarity. In both approaches there are n 1 levels of hierarchy
24 Hierarchical Methods Hierarchical Clustering Agglomerative approach a a b b a b c d e c c d e d d e e Initialization: Each object is a cluster Iteration: Merge two clusters which are most similar to each other; Until all objects are merged into a single cluster Step 0 Step 1 Step 2 Step 3 Step 4 bottom-up
25 Hierarchical Methods Hierarchical Clustering Divisive Approaches a a b b a b c d e c c d e d d e e Initialization: All objects stay in one cluster Iteration: Select a cluster and split it into two sub clusters Until each leaf cluster contains only one object Step 4 Step 3 Step 2 Step 1 Step 0 Top-down
26 Hierarchical Methods In the general case, the complexity of agglomerative clustering is O(n 3 ), which makes them too slow for large data sets. Divisive clustering with an exhaustive search is O(2 n ), which is even worse. However, for some special cases, optimal efficient agglomerative methods (of complexity O(n 2 )) are known: SLINK for single-linkage and CLINK for complete-linkage clustering The procedure described can lead to various methods of grouping, each differing in the use of each of the following concepts: similarity/dissimilarity between two objects similarity/dissimilarity between two groups, also called linkage (or fusion)
27 Proximity measures: What is Similarity? The quality or state of being similar; likeness;... Similarity is hard to define, but We know it when we see it

28 Proximity measures: What is Similarity? The real meaning of similarity is a philosophical question. We will take a more pragmatic approach
29 Proximity measures: Similarity/Dissimilarity between objects the degree of similarity measures the degree of similarity or proximity between the objects more similar objects = larger similarity more distinct objects = larger dissimilarity Dissimilarities and distances dissimilarities d ij between the objects i and j are measures that allows to translate quantitatively the larger or smaller differences between the objects in the set of p variables
30 Proximity measures: Similarity/Dissimilarity between objects Given two objects i and j, d ij is a dissimilarity measure if have the following proprieties: 1 d ij 0, i, j = 1, 2,... n 2 d ii = 0, i = 1, 2,... n 3 d ij = d ji, i, j = 1, 2,... n Notes: Almost always requires the positivity (properties 1 and 2) The property of symmetry (3) sometimes is not verified, although the measure continues to be useful for defining the dissimilarity. For example, the case of dissimilarity between two cities i and j can be measured by the number of people who travel from i to j. The symmetric property can be re-established if we consider dij = d ij +d ji 2
31 Proximity measures: Similarity/Dissimilarity between objects If in addition, also satisfy the triangular inequality: d ij d ik + d kj, i, j, k = 1, 2,... n the dissimilarity is a metric or a distance Many dissimilarities did not satisfy the previous property. However, some dissimilarity satisfy another property, too strong, that is ultrametric, i.e. d ij max(d ik, d jk ), i, j, k = 1, 2,... n
32 Proximity measures: Similarity/Dissimilarity between objects The dissimilarity measures depends on the characteristics (variables type) that we are observing in the objects. Quantitative variables: Euclidean distance and its derivatives (weighted Euclidean or generalized, (eg. Mahalanobis, when the weighting matrix is the covariance matrix); Minkowski metrics (Manhattan distance); Canberra metric; Correlation coefficient (it is a similarity should be transformed into dissimilarity)
33 Proximity measures: Similarity/Dissimilarity between objects Qualitative variables: (typically measures of similarity) Coefficient of concordance Jaccard coefficient Gower and Legendre coefficient and many others... For mixed variables: Romesburg strategy - ignore the type of variables and consider them all quantitative type, encoding the qualitative; Perform separate analyses; Reduce all the variables to binary variables; Building coefficient of similarity combined (for example, Gower)
34 Proximity measures: Similarity/Dissimilarity between objects If they used similarities measures sometimes is possible to convert these similarities in dissimilarities, for example: d ij = 1 sij d ij = 1 s 2 ij d ij = 1 sij d ij = 1 s 2 ij
35 Similarity/Dissimilarity between cluster/groups Defining Closeness of Clusters The key in a hierarchical clustering algorithm is specifying how to determine the two closest clusters at any given step For the first step, it s easy: Join the two objects whose distance is smallest After that, we have a choice: Do we join two individual objects together, or merge an object into a cluster that already has multiple objects?
36 Similarity/Dissimilarity between cluster/groups How to Merge Clusters? How to measure the distance between clusters? Distance? Hint: Distance between clusters is usually defined on the basis of distance between objects.
37 Similarity/Dissimilarity between cluster/groups How to Merge Clusters? How to measure the distance between clusters? MIN single-linkage MAX complete -linkage
38 Similarity/Dissimilarity between cluster/groups How to Merge Clusters? How to measure the distance between clusters? average-linkage Centroides
39 Similarity/Dissimilarity between cluster/groups Let A and B represent two such groups The single linkage (also called nearest neighbour), at each step, joins the clusters whose minimum distance between objects is smallest, i.e., joins the clusters A and B with the smallest D AB = min {d ij : i A, j B}
40 Similarity/Dissimilarity between cluster/groups Let A and B represent two such groups Complete linkage (also called farthest neighbour), at each step, joins the clusters whose maximum distance between objects is smallest, i.e., joins the clusters A and B with the smallest D AB = max {d ij : i A, j B}
41 Similarity/Dissimilarity between cluster/groups Average linkage (also called Group average) Here the distance between two clusters is defined as the average distance between all possible pairs of objects with one object in each pair belonging to a distinct cluster, i.e. D AB = 1 n A n B n A n B d ij i=l j=1 Centroid method. The distance between two groups A and B is the distance between group centres or other points considered groups representatives (centroid), i.e.: i A x i where x A = n A e x B = de p observations for object i. D AB = d( x A, x B ), i B x i n B, where x i is the vector of
42 Similarity/Dissimilarity between cluster/groups Ward method (also called minimum variance method). Ward s minimum variance criterion minimizes the total within-cluster variance. At each step the pair of clusters with minimum between-cluster distance are merged. This method uses as a criterion for merger two groups A and B the increased sum of squares that occurs when the groups A and B are merged together in a group C = A B where SSW C (SSWA + SSW B ) SSW A = i A p (x ija x ja ) 2 j=1 is the A group sum of squares. Similar expressions for the sum of squares of B and C.
43 Consider the following distance matrix
44 Nearest neighbour clustering Decision to merge groups is based on the distance of the nearest member of the group to the nearest other object. In our example, with a distance of 2, individuals a and b are the most similar.
45 Next step: What do we merge next?
46 Next step:
47 And so on...
48 We can plot this information
49 Furthest neighbour / Complete linkage Objects are merged when the furthest member of the group is close enough to the new object
50 Furthest neighbour / Complete linkage
51 Furthest neighbour / Complete linkage Actually we still merge d and e, but note the height!
52 Furthest neighbour / Complete linkage Completing the clustering
53 Furthest neighbour / Complete linkage Final merge at height 10
54 We can plot this information
55 Group average link Merge two groups is the average distance between them is small enough
56 Group average link Next merge (same order, different height)
57 Group average link and leaping on a bit
58 We can plot this information
59 We can plot this information
60 Cophenetic Correlation Obs: d ij is the ordinary Euclidean distance between the ith and jth observations and h ij is the dendrogrammatic distance between the model points i and j. This distance is the height of the node at which these two points are first joined together.
61 Agglomerative coefficient Agglomerative coefficient (AC):(cluster library in R) is a measure of the clustering structure of the dataset. For each observation i, denote by m(i) its dissimilarity to the first cluster it is merged with, divided by the dissimilarity of the merger in the final step of the algorithm. The AC is the average of all 1 m(i).
62 Reminder: linkages
63 Centroid linkage
64 Pros and Cons of Hierarchical Clustering An advantage of hierarchical clustering methods is their computational speed for small data sets Another advantage is that the dendrogram gives a picture of the clustering solution for a variety of choices of k On the other hand, a major disadvantage is that once two clusters have been joined, they can never be split apart later in the algorithm, even if such a move would improve the clustering The so-called partitioning methods of cluster analysis do not have this restriction In addition, hierarchical methods can be less efficient than partitioning methods for large data sets, when n is much greater than k
65 Centroid-based clustering (Partitioning method) In centroid-based clustering, clusters are represented by a central vector, which may not necessarily be a member of the data set. When the number of clusters is fixed to k, k-means clustering gives a formal definition as an optimization problem: find the k cluster center and assign the objects to the nearest cluster center, such that the squared distances from the cluster are minimized. The optimization problem itself is known to be NP-hard, and thus the common approach is to search only for approximate solutions. A particularly well known approximative method is k-means algorithm (multivariate statistics) often actually referred to as Lloyd s algorithm (computer science).
66 How Do Partitioning Methods Work? Given n objects and k clusters, find a partition of k clusters that minimizes a given score Each of the k clusters is usually identified by its centroid C m with m is the cluster identifier Sum of squares is a rather typical score for partitioning methods Global optimal is possible exhaustively enumerate all partitions Heuristic methods are always used (k-means and k-medoids)
67 k-means The K-means algorithm is one of the most popular iterative descent clustering methods. It is intended for situations in which all variables are of the quantitative type, and squared Euclidean distance is chosen as the dissimilarity measure k-means Given n objects with measures (x 1,..., x n ), we want to split in k clusters/groups C = C 1, C 2,..., C k, k n, such that minimize the sum of squared distances in each cluster: arg min C k i=1 where µ i is the mean in group C i. x j C i x j µ i 2,
68 k-means algorithm Given a current set of k means m (1) 1, m(1) 2,..., m(1) k : Assignment step: Assigning each object to the closest (current) cluster mean: = { x p : x p m (t) x p m (t) 1 j k }, C (t) i i where each object with measure x p is assign exactly to one group C (t). Update step: Calculate the new means to be the centroids of the observations in the new clusters: m (t+1) i = 1 C (t) i j x j C (t) i x j
69 k-means algorithm This is done iteratively by repeating the two steps until a stopping criterion is met. We can apply one of the following termination conditions: A fixed number of iterations has been completed. This condition limits the runtime of the clustering algorithm, but in some cases the quality of the clustering will be poor because of an insufficient number of iterations Assignment of objects to clusters (the partitioning function) does not change between iterations Centroids m i do not change between iterations. This is equivalent to partitioning function not changing Let s take a look: k-means
70 Pros and Cons of k-means Drawbacks Sensitive to initial seed points Converge to a local optimum that may be unwanted solution Need to specify k, the number of clusters, in advance Unable to handle noisy data and outliers Not suitable for discovering clusters with non-convex shapes Applicable only when mean is defined, then what about categorical data? Advantages Efficient in computation O(tkn), where n is number of objects, k is number of clusters, and t is number of iterations. Normally, k, t << n
71 k-means The final clustering depend on the initial cluster center. Sometimes, different initial center lead to very different final outputs. So, we typically run k-means multiple times (e.g., 10 times), randomly initializing clusters center for each run, then choose among from collection of center based on which on gives the smallest within-clusters variation
72 k-medoids As discussed above, the k-means algorithm is appropriate when the dissimilarity measure is taken to be squared Euclidean distance This requires all of the variables to be of the quantitative type. In addition, using squared Euclidean distance places the highest influence on the largest distances. This causes the procedure to lack robustness against outliers that produce very large distances. These restrictions can be removed at the expense of computation
73 k-medoids The only part of the k-means algorithm that assumes squared Euclidean distance is the minimization step; the cluster representatives {m 1,..., m k } are taken to be the means of the currently assigned clusters. The algorithm can be generalized for use with arbitrarily defined dissimilarities d(x i, x j ) by replacing this step by an explicit optimization with respect to {m 1,..., m k } > k-medoids algorithm
74 k-medoids The k-medoids algorithm is a clustering algorithm related to the k-means algorithm and the medoidshift algorithm. Both the k-means and k-medoids algorithms are partitional (breaking the dataset up into groups) and both attempt to minimize the distance between points labelled to be in a cluster and a point designated as the centre of that cluster. In contrast to the k-means algorithm, k-medoids chooses data points as centres (medoids or representatives) and works with an arbitrary matrix of distances between data points
75 k-medoids The most common realisation of k-medoid clustering is the Partitioning Around Medoids (PAM) algorithm: 1 Initialize: randomly select k of the n data points as the medoids 2 Associate each data point to the closest medoid. ( closest here is defined using any valid similarity measure) 3 For each medoid m 1 For each non-medoid data point l 1 Swap m and l and compute the total cost of the configuration 4 Select the configuration with the lowest cost 5 Repeat steps 2 to 4 until there is no change in the medoid
76 k-medoids It is more robust to noise and outliers as compared to k-means because it minimizes a sum of pairwise dissimilarities instead of a sum of squared Euclidean distances. A medoid can be defined as the object of a cluster, whose average dissimilarity to all the objects in the cluster is minimal i.e. it is a most centrally located point in the cluster. A useful tool for determining k is the silhouette
77 Silhouette Silhouette refers to a method of interpretation and validation of clusters of data. The technique provides a succinct graphical representation of how well each object lies within its cluster Figure 1. Silhouette width was calculated and the average silhouette width for all samples within one cluster was shown below according to different clusters (left panel). The robust cluster was pointed out by blue symbol (left panel) and the silhouette width of each sample in robust cluster was shown on right panel
78 Silhouette From Peter J. Rousseeuw (1986): Is a graphical display proposed for partitioning techniques. Each cluster is represented by a so-called silhouette, which is based on the comparison of its tightness and separation This silhouette shows which objects lie well within their cluster, and which ones are merely somewhere in between clusters The entire clustering is displayed by combining the silhouettes into a single plot, allowing an appreciation of the relative quality of the clusters and an overview of the data configuration The average silhouette width provides an evaluation of clustering validity, and might be used to select an appropriate number of clusters

79 Choosing the number of clusters
80 This is a hard problem
81 Within-cluster variation
82 That is not going to work
83 Between-cluster variation
84 Still not going to work
85 CH index
86 Example: CH index
87 Observations Same final notes
88 Standardization of Observations If the variables in our data set are of different types or are measured on very different scales, then some variables may play an inappropriately dominant role in the clustering process In this case, it is recommended to standardize the variables in some way before clustering the objects. Possible standardization approaches: 1. Divide each column by its sample standard deviation, so that all variables have standard deviation 1 2. Divide each variable by its sample range (max-min); Milligan and Cooper (1988) found that this approach best preserved the clustering structure 3. Convert data to z-scores by (for each variable) subtracting the sample mean and then dividing by the sample standard deviation - a common option in clustering software package
89 - Interpreting the clusters The cluster centroid (a mean profile of the cluster on each cluster variable) is particularly useful in the interpretation stage Interpretation involves: Examining and distinguishing characteristics of each cluster s profile and identifying substantial differences between clusters Cluster solution failing to reveal significant differences indicate that other solutions should be examined The cluster centroid should also be assessed for correspondence to researcher s prior expectation based on theory or practical experience
90 - Validation The validation of clustering structures is the most difficult and frustrating part of cluster analysis. Without a strong effort in this direction, cluster analysis will remain a black art accessible only to those true believers who have experience and great courage. 1. Determining the clustering tendency of a set of data, i.e., distinguishing whether nonrandom structure actually exists in the data 2. Comparing the results of a cluster analysis to externally known results, e.g., to externally given class labels 3. Evaluating how well the results of a cluster analysis fit the data without reference to external information 4. Comparing the results of two different sets of cluster analyses to determine the stability of the solution 5. Determining the correct number of clusters
91 Some numbers...
Unsupervised learning: Clustering
 Unsupervised learning: Clustering Salissou Moutari Centre for Statistical Science and Operational Research CenSSOR 17 th September 2013 Unsupervised learning: Clustering 1/52 Outline 1 Introduction What
Chapter 7. Cluster Analysis
 Chapter 7. Cluster Analysis. What is Cluster Analysis?. A Categorization of Major Clustering Methods. Partitioning Methods. Hierarchical Methods 5. Density-Based Methods 6. Grid-Based Methods 7. Model-Based
Clustering UE 141 Spring 2013
 Clustering UE 141 Spring 013 Jing Gao SUNY Buffalo 1 Definition of Clustering Finding groups of obects such that the obects in a group will be similar (or related) to one another and different from (or
Neural Networks Lesson 5 - Cluster Analysis
 Neural Networks Lesson 5 - Cluster Analysis Prof. Michele Scarpiniti INFOCOM Dpt. - Sapienza University of Rome http://ispac.ing.uniroma1.it/scarpiniti/index.htm [email protected] Rome, 29
DATA MINING CLUSTER ANALYSIS: BASIC CONCEPTS
 DATA MINING CLUSTER ANALYSIS: BASIC CONCEPTS 1 AND ALGORITHMS Chiara Renso KDD-LAB ISTI- CNR, Pisa, Italy WHAT IS CLUSTER ANALYSIS? Finding groups of objects such that the objects in a group will be similar
Clustering. 15-381 Artificial Intelligence Henry Lin. Organizing data into clusters such that there is
 Clustering 15-381 Artificial Intelligence Henry Lin Modified from excellent slides of Eamonn Keogh, Ziv Bar-Joseph, and Andrew Moore What is Clustering? Organizing data into clusters such that there is
Social Media Mining. Data Mining Essentials
 Introduction Data production rate has been increased dramatically (Big Data) and we are able store much more data than before E.g., purchase data, social media data, mobile phone data Businesses and customers
There are a number of different methods that can be used to carry out a cluster analysis; these methods can be classified as follows:
 Statistics: Rosie Cornish. 2007. 3.1 Cluster Analysis 1 Introduction This handout is designed to provide only a brief introduction to cluster analysis and how it is done. Books giving further details are
Data Mining Clustering (2) Sheets are based on the those provided by Tan, Steinbach, and Kumar. Introduction to Data Mining
 Sheets are based on the those provided by Tan, Steinbach, and Kumar. Introduction to Data Mining") Data Mining Clustering (2) Toon Calders Sheets are based on the those provided by Tan, Steinbach, and Kumar. Introduction to Data Mining Outline Partitional Clustering Distance-based K-means, K-medoids,
Data Mining Clustering (2) Toon Calders Sheets are based on the those provided by Tan, Steinbach, and Kumar. Introduction to Data Mining Outline Partitional Clustering Distance-based K-means, K-medoids,
Medical Information Management & Mining. You Chen Jan,15, 2013 [email protected]
 Medical Information Management & Mining You Chen Jan,15, 2013 [email protected] 1 Trees Building Materials Trees cannot be used to build a house directly. How can we transform trees to building materials?
Clustering. Danilo Croce Web Mining & Retrieval a.a. 2015/201 16/03/2016
 Clustering Danilo Croce Web Mining & Retrieval a.a. 2015/201 16/03/2016 1 Supervised learning vs. unsupervised learning Supervised learning: discover patterns in the data that relate data attributes with
Distances, Clustering, and Classification. Heatmaps
 Distances, Clustering, and Classification Heatmaps 1 Distance Clustering organizes things that are close into groups What does it mean for two genes to be close? What does it mean for two samples to be
Data Mining Cluster Analysis: Basic Concepts and Algorithms. Lecture Notes for Chapter 8. Introduction to Data Mining
 Data Mining Cluster Analysis: Basic Concepts and Algorithms Lecture Notes for Chapter 8 Introduction to Data Mining by Tan, Steinbach, Kumar Tan,Steinbach, Kumar Introduction to Data Mining 4/8/2004 Hierarchical
Clustering. Adrian Groza. Department of Computer Science Technical University of Cluj-Napoca
 Clustering Adrian Groza Department of Computer Science Technical University of Cluj-Napoca Outline 1 Cluster Analysis What is Datamining? Cluster Analysis 2 K-means 3 Hierarchical Clustering What is Datamining?
Data Mining Cluster Analysis: Basic Concepts and Algorithms. Clustering Algorithms. Lecture Notes for Chapter 8. Introduction to Data Mining
 Data Mining Cluster Analsis: Basic Concepts and Algorithms Lecture Notes for Chapter 8 Introduction to Data Mining b Tan, Steinbach, Kumar Clustering Algorithms K-means and its variants Hierarchical clustering
Steven M. Ho!and. Department of Geology, University of Georgia, Athens, GA 30602-2501
 CLUSTER ANALYSIS Steven M. Ho!and Department of Geology, University of Georgia, Athens, GA 30602-2501 January 2006 Introduction Cluster analysis includes a broad suite of techniques designed to find groups
Chapter ML:XI (continued)
") Chapter ML:XI (continued) XI. Cluster Analysis Data Mining Overview Cluster Analysis Basics Hierarchical Cluster Analysis Iterative Cluster Analysis Density-Based Cluster Analysis Cluster Evaluation Constrained
Chapter ML:XI (continued) XI. Cluster Analysis Data Mining Overview Cluster Analysis Basics Hierarchical Cluster Analysis Iterative Cluster Analysis Density-Based Cluster Analysis Cluster Evaluation Constrained
Data Mining Project Report. Document Clustering. Meryem Uzun-Per
 Data Mining Project Report Document Clustering Meryem Uzun-Per 504112506 Table of Content Table of Content... 2 1. Project Definition... 3 2. Literature Survey... 3 3. Methods... 4 3.1. K-means algorithm...
Cluster analysis Cosmin Lazar. COMO Lab VUB
 Cluster analysis Cosmin Lazar COMO Lab VUB Introduction Cluster analysis foundations rely on one of the most fundamental, simple and very often unnoticed ways (or methods) of understanding and learning,
Data Mining 5. Cluster Analysis
 Data Mining 5. Cluster Analysis 5.2 Fall 2009 Instructor: Dr. Masoud Yaghini Outline Data Structures Interval-Valued (Numeric) Variables Binary Variables Categorical Variables Ordinal Variables Variables
How To Solve The Cluster Algorithm
 Cluster Algorithms Adriano Cruz [email protected] 28 de outubro de 2013 Adriano Cruz [email protected] () Cluster Algorithms 28 de outubro de 2013 1 / 80 Summary 1 K-Means Adriano Cruz [email protected]
Cluster Analysis: Basic Concepts and Methods
 10 Cluster Analysis: Basic Concepts and Methods Imagine that you are the Director of Customer Relationships at AllElectronics, and you have five managers working for you. You would like to organize all
Hierarchical Cluster Analysis Some Basics and Algorithms
 Hierarchical Cluster Analysis Some Basics and Algorithms Nethra Sambamoorthi CRMportals Inc., 11 Bartram Road, Englishtown, NJ 07726 (NOTE: Please use always the latest copy of the document. Click on this
Standardization and Its Effects on K-Means Clustering Algorithm
 Research Journal of Applied Sciences, Engineering and Technology 6(7): 399-3303, 03 ISSN: 040-7459; e-issn: 040-7467 Maxwell Scientific Organization, 03 Submitted: January 3, 03 Accepted: February 5, 03
How To Cluster
 Data Clustering Dec 2nd, 2013 Kyrylo Bessonov Talk outline Introduction to clustering Types of clustering Supervised Unsupervised Similarity measures Main clustering algorithms k-means Hierarchical Main
An Introduction to Cluster Analysis for Data Mining
 An Introduction to Cluster Analysis for Data Mining 10/02/2000 11:42 AM 1. INTRODUCTION... 4 1.1. Scope of This Paper... 4 1.2. What Cluster Analysis Is... 4 1.3. What Cluster Analysis Is Not... 5 2. OVERVIEW...
UNSUPERVISED MACHINE LEARNING TECHNIQUES IN GENOMICS
 UNSUPERVISED MACHINE LEARNING TECHNIQUES IN GENOMICS Dwijesh C. Mishra I.A.S.R.I., Library Avenue, New Delhi-110 012 [email protected] What is Learning? "Learning denotes changes in a system that enable
Information Retrieval and Web Search Engines
 Information Retrieval and Web Search Engines Lecture 7: Document Clustering December 10 th, 2013 Wolf-Tilo Balke and Kinda El Maarry Institut für Informationssysteme Technische Universität Braunschweig
Data Mining Cluster Analysis: Basic Concepts and Algorithms. Lecture Notes for Chapter 8. Introduction to Data Mining
 Data Mining Cluster Analsis: Basic Concepts and Algorithms Lecture Notes for Chapter 8 Introduction to Data Mining b Tan, Steinbach, Kumar Tan,Steinbach, Kumar Introduction to Data Mining /8/ What is Cluster
Machine Learning using MapReduce
 Machine Learning using MapReduce What is Machine Learning Machine learning is a subfield of artificial intelligence concerned with techniques that allow computers to improve their outputs based on previous
15.062 Data Mining: Algorithms and Applications Matrix Math Review
 .6 Data Mining: Algorithms and Applications Matrix Math Review The purpose of this document is to give a brief review of selected linear algebra concepts that will be useful for the course and to develop
0.1 What is Cluster Analysis?
 Cluster Analysis 1 2 0.1 What is Cluster Analysis? Cluster analysis is concerned with forming groups of similar objects based on several measurements of different kinds made on the objects. The key idea
Data Mining Cluster Analysis: Basic Concepts and Algorithms. Lecture Notes for Chapter 8. Introduction to Data Mining
 Data Mining Cluster Analysis: Basic Concepts and Algorithms Lecture Notes for Chapter 8 by Tan, Steinbach, Kumar 1 What is Cluster Analysis? Finding groups of objects such that the objects in a group will
A comparison of various clustering methods and algorithms in data mining
 Volume :2, Issue :5, 32-36 May 2015 www.allsubjectjournal.com e-issn: 2349-4182 p-issn: 2349-5979 Impact Factor: 3.762 R.Tamilselvi B.Sivasakthi R.Kavitha Assistant Professor A comparison of various clustering
Data Mining for Knowledge Management. Clustering
 Data Mining for Knowledge Management Clustering Themis Palpanas University of Trento http://disi.unitn.eu/~themis Data Mining for Knowledge Management Thanks for slides to: Jiawei Han Eamonn Keogh Jeff
. Learn the number of classes and the structure of each class using similarity between unlabeled training patterns
 Outline Part 1: of data clustering Non-Supervised Learning and Clustering : Problem formulation cluster analysis : Taxonomies of Clustering Techniques : Data types and Proximity Measures : Difficulties
Cluster Analysis. Alison Merikangas Data Analysis Seminar 18 November 2009
 Cluster Analysis Alison Merikangas Data Analysis Seminar 18 November 2009 Overview What is cluster analysis? Types of cluster Distance functions Clustering methods Agglomerative K-means Density-based Interpretation
Clustering. Data Mining. Abraham Otero. Data Mining. Agenda
 Clustering 1/46 Agenda Introduction Distance K-nearest neighbors Hierarchical clustering Quick reference 2/46 1 Introduction It seems logical that in a new situation we should act in a similar way as in
Cluster Analysis: Basic Concepts and Algorithms
 Cluster Analsis: Basic Concepts and Algorithms What does it mean clustering? Applications Tpes of clustering K-means Intuition Algorithm Choosing initial centroids Bisecting K-means Post-processing Strengths
A Demonstration of Hierarchical Clustering
 Recitation Supplement: Hierarchical Clustering and Principal Component Analysis in SAS November 18, 2002 The Methods In addition to K-means clustering, SAS provides several other types of unsupervised
Example: Document Clustering. Clustering: Definition. Notion of a Cluster can be Ambiguous. Types of Clusterings. Hierarchical Clustering
 Overview Prognostic Models and Data Mining in Medicine, part I Cluster Analsis What is Cluster Analsis? K-Means Clustering Hierarchical Clustering Cluster Validit Eample: Microarra data analsis 6 Summar
STATISTICA. Clustering Techniques. Case Study: Defining Clusters of Shopping Center Patrons. and
 Clustering Techniques and STATISTICA Case Study: Defining Clusters of Shopping Center Patrons STATISTICA Solutions for Business Intelligence, Data Mining, Quality Control, and Web-based Analytics Table
ARTIFICIAL INTELLIGENCE (CSCU9YE) LECTURE 6: MACHINE LEARNING 2: UNSUPERVISED LEARNING (CLUSTERING)
 LECTURE 6: MACHINE LEARNING 2: UNSUPERVISED LEARNING (CLUSTERING)") ARTIFICIAL INTELLIGENCE (CSCU9YE) LECTURE 6: MACHINE LEARNING 2: UNSUPERVISED LEARNING (CLUSTERING) Gabriela Ochoa http://www.cs.stir.ac.uk/~goc/ OUTLINE Preliminaries Classification and Clustering Applications
ARTIFICIAL INTELLIGENCE (CSCU9YE) LECTURE 6: MACHINE LEARNING 2: UNSUPERVISED LEARNING (CLUSTERING) Gabriela Ochoa http://www.cs.stir.ac.uk/~goc/ OUTLINE Preliminaries Classification and Clustering Applications
Unsupervised Learning and Data Mining. Unsupervised Learning and Data Mining. Clustering. Supervised Learning. Supervised Learning
 Unsupervised Learning and Data Mining Unsupervised Learning and Data Mining Clustering Decision trees Artificial neural nets K-nearest neighbor Support vectors Linear regression Logistic regression...
K-Means Cluster Analysis. Tan,Steinbach, Kumar Introduction to Data Mining 4/18/2004 1
 K-Means Cluster Analsis Chapter 3 PPDM Class Tan,Steinbach, Kumar Introduction to Data Mining 4/18/4 1 What is Cluster Analsis? Finding groups of objects such that the objects in a group will be similar
SoSe 2014: M-TANI: Big Data Analytics
 SoSe 2014: M-TANI: Big Data Analytics Lecture 4 21/05/2014 Sead Izberovic Dr. Nikolaos Korfiatis Agenda Recap from the previous session Clustering Introduction Distance mesures Hierarchical Clustering
Cluster Analysis. Aims and Objectives. What is Cluster Analysis? How Does Cluster Analysis Work? Postgraduate Statistics: Cluster Analysis
 Aims and Objectives By the end of this seminar you should: Cluster Analysis Have a working knowledge of the ways in which similarity between cases can be quantified (e.g. single linkage, complete linkage
Time series clustering and the analysis of film style
 Time series clustering and the analysis of film style Nick Redfern Introduction Time series clustering provides a simple solution to the problem of searching a database containing time series data such
Cluster Analysis: Advanced Concepts
 Cluster Analysis: Advanced Concepts and dalgorithms Dr. Hui Xiong Rutgers University Introduction to Data Mining 08/06/2006 1 Introduction to Data Mining 08/06/2006 1 Outline Prototype-based Fuzzy c-means
Categorical Data Visualization and Clustering Using Subjective Factors
 Categorical Data Visualization and Clustering Using Subjective Factors Chia-Hui Chang and Zhi-Kai Ding Department of Computer Science and Information Engineering, National Central University, Chung-Li,
CLUSTER ANALYSIS FOR SEGMENTATION
 CLUSTER ANALYSIS FOR SEGMENTATION Introduction We all understand that consumers are not all alike. This provides a challenge for the development and marketing of profitable products and services. Not every
How To Identify Noisy Variables In A Cluster
 Identification of noisy variables for nonmetric and symbolic data in cluster analysis Marek Walesiak and Andrzej Dudek Wroclaw University of Economics, Department of Econometrics and Computer Science,
Cluster Analysis: Basic Concepts and Algorithms
 8 Cluster Analysis: Basic Concepts and Algorithms Cluster analysis divides data into groups (clusters) that are meaningful, useful, or both. If meaningful groups are the goal, then the clusters should
Cluster Analysis using R
 Cluster analysis or clustering is the task of assigning a set of objects into groups (called clusters) so that the objects in the same cluster are more similar (in some sense or another) to each other
Clustering. Chapter 7. 7.1 Introduction to Clustering Techniques. 7.1.1 Points, Spaces, and Distances
 240 Chapter 7 Clustering Clustering is the process of examining a collection of points, and grouping the points into clusters according to some distance measure. The goal is that points in the same cluster
Data Mining Cluster Analysis: Basic Concepts and Algorithms. Lecture Notes for Chapter 8. Introduction to Data Mining
 Data Mining Cluster Analsis: Basic Concepts and Algorithms Lecture Notes for Chapter 8 Introduction to Data Mining b Tan, Steinbach, Kumar Tan,Steinbach, Kumar Introduction to Data Mining 4/8/4 What is
EM Clustering Approach for Multi-Dimensional Analysis of Big Data Set
 EM Clustering Approach for Multi-Dimensional Analysis of Big Data Set Amhmed A. Bhih School of Electrical and Electronic Engineering Princy Johnson School of Electrical and Electronic Engineering Martin
Data Preprocessing. Week 2
 Data Preprocessing Week 2 Topics Data Types Data Repositories Data Preprocessing Present homework assignment #1 Team Homework Assignment #2 Read pp. 227 240, pp. 250 250, and pp. 259 263 the text book.
Statistical Databases and Registers with some datamining
 Unsupervised learning - Statistical Databases and Registers with some datamining a course in Survey Methodology and O cial Statistics Pages in the book: 501-528 Department of Statistics Stockholm University
A Survey of Clustering Techniques
 A Survey of Clustering Techniques Pradeep Rai Asst. Prof., CSE Department, Kanpur Institute of Technology, Kanpur-0800 (India) Shubha Singh Asst. Prof., MCA Department, Kanpur Institute of Technology,
Data Mining. Cluster Analysis: Advanced Concepts and Algorithms
 Data Mining Cluster Analysis: Advanced Concepts and Algorithms Tan,Steinbach, Kumar Introduction to Data Mining 4/18/2004 1 More Clustering Methods Prototype-based clustering Density-based clustering Graph-based
USING THE AGGLOMERATIVE METHOD OF HIERARCHICAL CLUSTERING AS A DATA MINING TOOL IN CAPITAL MARKET 1. Vera Marinova Boncheva
 382 [7] Reznik, A, Kussul, N., Sokolov, A.: Identification of user activity using neural networks. Cybernetics and computer techniques, vol. 123 (1999) 70 79. (in Russian) [8] Kussul, N., et al. : Multi-Agent
Data Clustering Techniques Qualifying Oral Examination Paper
 Data Clustering Techniques Qualifying Oral Examination Paper Periklis Andritsos University of Toronto Department of Computer Science [email protected] March 11, 2002 1 Introduction During a cholera
Exploratory data analysis (Chapter 2) Fall 2011
 Fall 2011") Exploratory data analysis (Chapter 2) Fall 2011 Data Examples Example 1: Survey Data 1 Data collected from a Stat 371 class in Fall 2005 2 They answered questions about their: gender, major, year in school,
Exploratory data analysis (Chapter 2) Fall 2011 Data Examples Example 1: Survey Data 1 Data collected from a Stat 371 class in Fall 2005 2 They answered questions about their: gender, major, year in school,
PERFORMANCE ANALYSIS OF CLUSTERING ALGORITHMS IN DATA MINING IN WEKA
 PERFORMANCE ANALYSIS OF CLUSTERING ALGORITHMS IN DATA MINING IN WEKA Prakash Singh 1, Aarohi Surya 2 1 Department of Finance, IIM Lucknow, Lucknow, India 2 Department of Computer Science, LNMIIT, Jaipur,
Visualizing non-hierarchical and hierarchical cluster analyses with clustergrams
 Visualizing non-hierarchical and hierarchical cluster analyses with clustergrams Matthias Schonlau RAND 7 Main Street Santa Monica, CA 947 USA Summary In hierarchical cluster analysis dendrogram graphs
The Science and Art of Market Segmentation Using PROC FASTCLUS Mark E. Thompson, Forefront Economics Inc, Beaverton, Oregon
 The Science and Art of Market Segmentation Using PROC FASTCLUS Mark E. Thompson, Forefront Economics Inc, Beaverton, Oregon ABSTRACT Effective business development strategies often begin with market segmentation,
SPECIAL PERTURBATIONS UNCORRELATED TRACK PROCESSING
 AAS 07-228 SPECIAL PERTURBATIONS UNCORRELATED TRACK PROCESSING INTRODUCTION James G. Miller * Two historical uncorrelated track (UCT) processing approaches have been employed using general perturbations
Environmental Remote Sensing GEOG 2021
 Environmental Remote Sensing GEOG 2021 Lecture 4 Image classification 2 Purpose categorising data data abstraction / simplification data interpretation mapping for land cover mapping use land cover class
Clustering Techniques: A Brief Survey of Different Clustering Algorithms
 Clustering Techniques: A Brief Survey of Different Clustering Algorithms Deepti Sisodia Technocrates Institute of Technology, Bhopal, India Lokesh Singh Technocrates Institute of Technology, Bhopal, India
Summary Data Mining & Process Mining (1BM46) Content. Made by S.P.T. Ariesen
 Content. Made by S.P.T. Ariesen") Summary Data Mining & Process Mining (1BM46) Made by S.P.T. Ariesen Content Data Mining part... 2 Lecture 1... 2 Lecture 2:... 4 Lecture 3... 7 Lecture 4... 9 Process mining part... 13 Lecture 5... 13
Summary Data Mining & Process Mining (1BM46) Made by S.P.T. Ariesen Content Data Mining part... 2 Lecture 1... 2 Lecture 2:... 4 Lecture 3... 7 Lecture 4... 9 Process mining part... 13 Lecture 5... 13
Robust Outlier Detection Technique in Data Mining: A Univariate Approach
 Robust Outlier Detection Technique in Data Mining: A Univariate Approach Singh Vijendra and Pathak Shivani Faculty of Engineering and Technology Mody Institute of Technology and Science Lakshmangarh, Sikar,
Data Mining Cluster Analysis: Advanced Concepts and Algorithms. Lecture Notes for Chapter 9. Introduction to Data Mining
 Data Mining Cluster Analysis: Advanced Concepts and Algorithms Lecture Notes for Chapter 9 Introduction to Data Mining by Tan, Steinbach, Kumar Tan,Steinbach, Kumar Introduction to Data Mining 4/18/2004
Segmentation & Clustering
 EECS 442 Computer vision Segmentation & Clustering Segmentation in human vision K-mean clustering Mean-shift Graph-cut Reading: Chapters 14 [FP] Some slides of this lectures are courtesy of prof F. Li,
Decision Support System Methodology Using a Visual Approach for Cluster Analysis Problems
 Decision Support System Methodology Using a Visual Approach for Cluster Analysis Problems Ran M. Bittmann School of Business Administration Ph.D. Thesis Submitted to the Senate of Bar-Ilan University Ramat-Gan,
Chapter 4 Data Mining A Short Introduction. 2006/7, Karl Aberer, EPFL-IC, Laboratoire de systèmes d'informations répartis Data Mining - 1
 Chapter 4 Data Mining A Short Introduction 2006/7, Karl Aberer, EPFL-IC, Laboratoire de systèmes d'informations répartis Data Mining - 1 1 Today's Question 1. Data Mining Overview 2. Association Rule Mining
CHAPTER 6 DATA MINING
 Camm, Cochran, Fry, Ohlmann 1 Chapter 6 CHAPTER 6 DATA MINING CONTENTS 6.1 DATA SAMPLING 6.2 DATA PREPARATION Treatment of Missing Data Identification of Erroneous Data and Outliers Variable Representation
Data Mining: Exploring Data. Lecture Notes for Chapter 3. Slides by Tan, Steinbach, Kumar adapted by Michael Hahsler
 Data Mining: Exploring Data Lecture Notes for Chapter 3 Slides by Tan, Steinbach, Kumar adapted by Michael Hahsler Topics Exploratory Data Analysis Summary Statistics Visualization What is data exploration?
Fortgeschrittene Computerintensive Methoden: Fuzzy Clustering Steffen Unkel
 Fortgeschrittene Computerintensive Methoden: Fuzzy Clustering Steffen Unkel Institut für Statistik LMU München Sommersemester 2013 Outline 1 Setting the scene 2 Methods for fuzzy clustering 3 The assessment
Introduction to Machine Learning Using Python. Vikram Kamath
 Introduction to Machine Learning Using Python Vikram Kamath Contents: 1. 2. 3. 4. 5. 6. 7. 8. 9. 10. Introduction/Definition Where and Why ML is used Types of Learning Supervised Learning Linear Regression
Vector Quantization and Clustering
 Vector Quantization and Clustering Introduction K-means clustering Clustering issues Hierarchical clustering Divisive (top-down) clustering Agglomerative (bottom-up) clustering Applications to speech recognition
Using multiple models: Bagging, Boosting, Ensembles, Forests
 Using multiple models: Bagging, Boosting, Ensembles, Forests Bagging Combining predictions from multiple models Different models obtained from bootstrap samples of training data Average predictions or
Performance Metrics for Graph Mining Tasks
 Performance Metrics for Graph Mining Tasks 1 Outline Introduction to Performance Metrics Supervised Learning Performance Metrics Unsupervised Learning Performance Metrics Optimizing Metrics Statistical
Introduction to Clustering
 Introduction to Clustering Yumi Kondo Student Seminar LSK301 Sep 25, 2010 Yumi Kondo (University of British Columbia) Introduction to Clustering Sep 25, 2010 1 / 36 Microarray Example N=65 P=1756 Yumi
The SPSS TwoStep Cluster Component
 White paper technical report The SPSS TwoStep Cluster Component A scalable component enabling more efficient customer segmentation Introduction The SPSS TwoStep Clustering Component is a scalable cluster
Movie Classification Using k-means and Hierarchical Clustering
 Movie Classification Using k-means and Hierarchical Clustering An analysis of clustering algorithms on movie scripts Dharak Shah DA-IICT, Gandhinagar Gujarat, India [email protected] Saheb Motiani
Comparison and Analysis of Various Clustering Methods in Data mining On Education data set Using the weak tool
 Comparison and Analysis of Various Clustering Metho in Data mining On Education data set Using the weak tool Abstract:- Data mining is used to find the hidden information pattern and relationship between
Territorial Analysis for Ratemaking. Philip Begher, Dario Biasini, Filip Branitchev, David Graham, Erik McCracken, Rachel Rogers and Alex Takacs
 Territorial Analysis for Ratemaking by Philip Begher, Dario Biasini, Filip Branitchev, David Graham, Erik McCracken, Rachel Rogers and Alex Takacs Department of Statistics and Applied Probability University
Dynamical Clustering of Personalized Web Search Results
 Dynamical Clustering of Personalized Web Search Results Xuehua Shen CS Dept, UIUC [email protected] Hong Cheng CS Dept, UIUC [email protected] Abstract Most current search engines present the user a ranked
Data Exploration Data Visualization
 Data Exploration Data Visualization What is data exploration? A preliminary exploration of the data to better understand its characteristics. Key motivations of data exploration include Helping to select
Computer program review
 Journal of Vegetation Science 16: 355-359, 2005 IAVS; Opulus Press Uppsala. - Ginkgo, a multivariate analysis package - 355 Computer program review Ginkgo, a multivariate analysis package Bouxin, Guy Haute
Chapter 9 Cluster Analysis
 Chapter 9 Cluster Analysis Learning Objectives After reading this chapter you should understand: The basic concepts of cluster analysis. How basic cluster algorithms work. How to compute simple clustering
SPSS Tutorial. AEB 37 / AE 802 Marketing Research Methods Week 7
 SPSS Tutorial AEB 37 / AE 802 Marketing Research Methods Week 7 Cluster analysis Lecture / Tutorial outline Cluster analysis Example of cluster analysis Work on the assignment Cluster Analysis It is a
IMPROVISATION OF STUDYING COMPUTER BY CLUSTER STRATEGIES
 INTERNATIONAL JOURNAL OF ADVANCED RESEARCH IN ENGINEERING AND SCIENCE IMPROVISATION OF STUDYING COMPUTER BY CLUSTER STRATEGIES C.Priyanka 1, T.Giri Babu 2 1 M.Tech Student, Dept of CSE, Malla Reddy Engineering
Personalized Hierarchical Clustering
 Personalized Hierarchical Clustering Korinna Bade, Andreas Nürnberger Faculty of Computer Science, Otto-von-Guericke-University Magdeburg, D-39106 Magdeburg, Germany {kbade,nuernb}@iws.cs.uni-magdeburg.de
Multivariate Analysis of Ecological Data
 Multivariate Analysis of Ecological Data MICHAEL GREENACRE Professor of Statistics at the Pompeu Fabra University in Barcelona, Spain RAUL PRIMICERIO Associate Professor of Ecology, Evolutionary Biology
Data Mining Cluster Analysis: Advanced Concepts and Algorithms. Lecture Notes for Chapter 9. Introduction to Data Mining
 Data Mining Cluster Analysis: Advanced Concepts and Algorithms Lecture Notes for Chapter 9 Introduction to Data Mining by Tan, Steinbach, Kumar Tan,Steinbach, Kumar Introduction to Data Mining 4/18/2004