The Segway annotation of ENCODE data
|
|
|
- Daniela May
- 10 years ago
- Views:
Transcription
1 The Segway annotation of ENCODE data Michael M. Hoffman Department of Genome Sciences University of Washington

2 Overview 1. ENCODE Project 2. Semi-automated genomic annotation 3. Chromatin 4. RNA-seq

3 Functional genomics ENCODE Project Consortium PLoS Biol 9:e

4 Chromatin immunoprecipitation (ChIP) Park PJ Nat Rev Genet 10:669.

5 ChIP sequence


6 sequence signal: Wiggler Extends tags in strand direction Extension length determined by crosscorrelation peak Signal only in mappable regions 1-bp resolution Anshul Kundaje Hoffman MM et al Nucleic Acids Res 41:827.

7 signal tracks extended reads per base Fine-scale data H3K4me2 H3K27me3 Histone modifications Pol2b Egr-1 GABP Pol2 (Myers) Transcription factors Sin3Ak-20 TAF1 300 bp
 Transcription factors Sin3Ak-20")
8 2685 data sets Maher B Nature 489:46.

9 2685 data sets Now what? Maher B Nature 489:46.

10 Overview 1. ENCODE Project 2. Semi-automated genomic annotation 3. Chromatin 4. RNA-seq

11 Semi-automated annotation signal tracks annotation pattern discovery visualization interpretation

12 Genomic segmentation

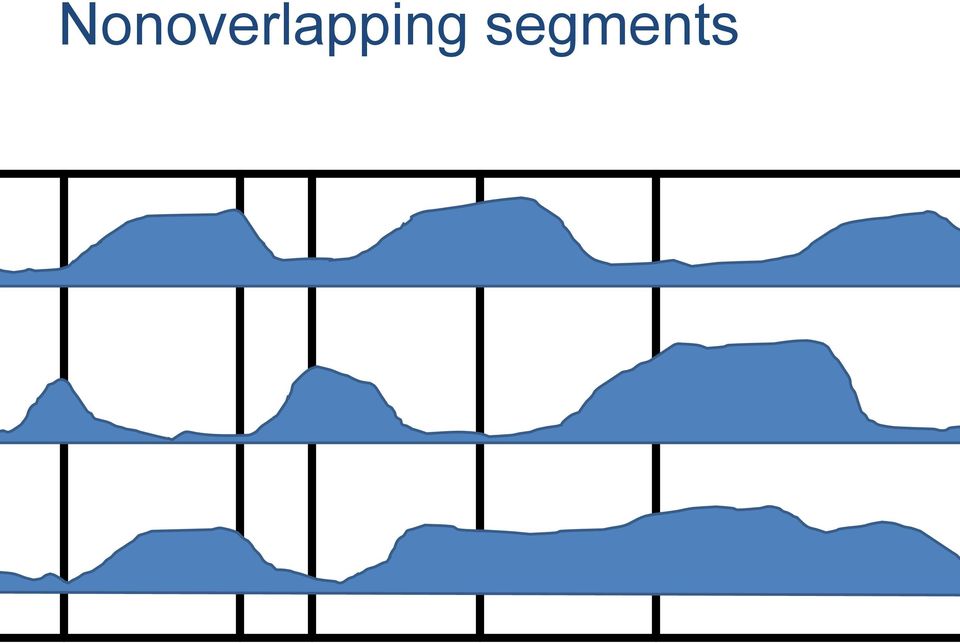
13 Nonoverlapping segments

14 Nonoverlapping segments
15 Finite number of labels

16 Maximize similarity in labels

17 Bayesian network for ChIP-seq X t signal at position t observed random variable continuous

18 Bayesian network for ChIP-seq Q t transcription factor present at position t? 0: transcription factor is not present 1: transcription factor is present X t signal at position t hidden random variable observed random variable discrete continuous

19 Bayesian network for ChIP-seq Q t TF present at position t? µ 0 σ 0 µ 1 σ 1 P(X t Q t = 0) ~ N(µ 0, σ 0 ) P(X t Q t = 1) ~ N(µ 1, σ 1 ) X t signal at position t hidden random variable observed random variable emission probability parameter discrete continuous conditional relationship

20 Bayesian network: 2 positions Q t Q t+1 µ 0 σ 0 µ 1 σ 1 µ 0 σ 0 µ 1 σ 1 X t X t+1 hidden random variable observed random variable emission probability parameter discrete continuous conditional relationship

21 Bayesian network: 2 positions Q t Q t+1 µ 0 σ 0 µ 1 σ 1 µ 0 σ 0 µ 1 σ 1 P(Q t+1 = 0 Q t = 0) = 0.99 P(Q t+1 = 1 Q t = 0) = 0.01 P(Q t+1 = 0 Q t = 1) = 0.01 P(Q t+1 = 1 Q t = 1) = 0.99 X t X t+1 hidden random variable observed random variable transition probability parameter emission probability parameter discrete continuous conditional relationship
22 Dynamic Bayesian network (DBN) Q t Q t+1 Q t Q µ 0 σ 0 µ 0 σ 0 µ 0 σ 0 µ µ 1 σ 1 µ 1 σ 1 µ 1 σ 1 µ X t X t+1 X t+2 X hidden random variable observed random variable transition probability parameter emission probability parameter discrete continuous conditional relationship
23 Dynamic BN for segmentation segment label DNaseI H3K36me3 CTCF hidden random variable observed random variable transition probability parameter emission probability parameter discrete continuous conditional relationship

24 Heterogeneous missing data Hoffman MM et al Nat Methods 9:473.
25 Handling missing data segment µ 0 σ 0 µ 1 σ 1 µ 0 σ 0 µ 1 σ DNaseI hidden random variable observed random variable transition probability parameter emission probability parameter discrete continuous conditional switching
26 Handling missing data present(dnasei) segment label present(h3k36me3) DNaseI present(ctcf) H3K36me3 CTCF hidden random variable observed random variable transition probability parameter emission probability parameter discrete continuous conditional switching
27 Length distribution present(dnasei) segment label present(h3k36me3) DNaseI present(ctcf) H3K36me3 CTCF
28 Length distribution frame index ruler segment countdown segment transition present(dnasei) Minimum segment length Maximum segment length present(h3k36me3) Trained geometric length distribution present(ctcf) Dirichlet prior on segment length Weight of prior versus observed data segment label DNaseI H3K36me3 CTCF
29 Segway A way to segment the genome Hoffman MM et al Nat Methods 9:473.
30 Overview 1. ENCODE Project 2. Semi-automated genomic annotation 3. Chromatin 4. RNA-seq
31 embryoblast mesendoderm H1 hesc embryonic stem cell endoderm mesoderm lateral mesoderm intermediate mesoderm hemangioblast liver blood vessel endothelium myeloid progenitor hemocytoblast lymphoid progenitor lymphoblast cervix HepG2 hepatocelluar carcinoma cell HUVEC umbilical vein endothelial cell K562 chronic myeloid leukemia cell GM12878 lymphoblastoid cell HeLa-S3 cervical carcinoma cell
32 Input tracks 49 tracks ENCODE K ChIP-seq DNase-seq FAIRE-seq 8 different labs
33 Picking the number of labels 25 labels
34 Emission parameters Each cell represents a Gaussian. Means are rownormalized so the highest mean value for a track is red and the lowest mean value is blue. Standard deviation is proportional to the length of the black bar
35 TSS transcription star GS gene start GM gene middle GE gene end E enhancer I insulator R repression D dead

36 Transcription start site (TSS) Hoffman MM et al Nucleic Acids Res 41:827.
37 Rediscovering genes
38 Zooming out 10 TSS segments occur near 5 ends of genes TSS/G* segments missing in gene deserts R*/D* segments occur more in gene deserts
39 3' gene ends Jason Ernst Hoffman MM et al Nucleic Acids Res 41:827.
40 A puzzling region Lots of genes but very few TSS/GS segments. Why? Because these genes are not expressed in K562.
41 Experimental validation Testing <1000bp sequences for promoter activity predicted + in K562 predicted in K562 predicted + in GM12878 predicted in GM

42 Luciferase assay results Hoffman MM et al Nat Methods 9:473.

43 Comparison with GWAS catalog Bob Harris, Ross Hardison Hoffman MM et al Nucleic Acids Res 41:827.
44 Summary of results Semi-automated genomic annotation begins with pattern discovery from multiple functional genomics data sets and enables: A simple annotation with a single label for each part of the genome. Visualization reducing multivariate data to a comprehensible representation. Interpretation of the context and potential regulatory impact of variants.
45 Software availability Segway data tracks segmentation Hoffman MM et al Nat Methods 9: Segtools segmentation plots and summary statistics Buske OJ et al BMC Bioinformatics 12:415 Genomedata efficient access to numeric data anchored to genome Hoffman MM et al Bioinformatics 26:
46 Acknowledgments Bill Noble Jeff Bilmes Orion Buske Paul Ellenbogen University of Washington: Harshad Petwe, Meg Olson, Sheila Reynolds, Noble Research Group. University of Massachusetts Medical School: Zhiping Weng. SwitchGear Genomics: Patrick Collins. Stanford University: Anshul Kundaje. Pennsylvania State University: Ross Hardison, Bob Harris. European Bioinformatics Institute: Ewan Birney, Ian Dunham. University of California, Santa Cruz: Kate Rosenbloom, Brian Raney. Cold Spring Harbor Laboratory: Tom Gingeras, Carrie Davis. CRG: Sarah Djebali. RIKEN: Timo Lassmann. ENCODE Project Consortium. NIH/NHGRI: K99HG006259, U54HG
GMQL Functional Comparison with BEDTools and BEDOPS
 GMQL Functional Comparison with BEDTools and BEDOPS Genomic Computing Group Dipartimento di Elettronica, Informazione e Bioingegneria Politecnico di Milano This document presents a functional comparison
A Brief Introduction on DNase-Seq Data Aanalysis
 A Brief Introduction on DNase-Seq Data Aanalysis Hashem Koohy, Thomas Down, Mikhail Spivakov and Tim Hubbard Spivakov s and Fraser s Lab September 13, 2014 1 Introduction DNaseI is an enzyme which cuts
Shouguo Gao Ph. D Department of Physics and Comprehensive Diabetes Center
 Computational Challenges in Storage, Analysis and Interpretation of Next-Generation Sequencing Data Shouguo Gao Ph. D Department of Physics and Comprehensive Diabetes Center Next Generation Sequencing
Analysis and Integration of Big Data from Next-Generation Genomics, Epigenomics, and Transcriptomics
 Analysis and Integration of Big Data from Next-Generation Genomics, Epigenomics, and Transcriptomics Christopher Benner, PhD Director, Integrative Genomics and Bioinformatics Core (IGC) idash Webinar,
Analysis of ChIP-seq data in Galaxy
 Analysis of ChIP-seq data in Galaxy November, 2012 Local copy: https://galaxy.wi.mit.edu/ Joint project between BaRC and IT Main site: http://main.g2.bx.psu.edu/ 1 Font Conventions Bold and blue refers
Visualisation tools for next-generation sequencing
 Visualisation tools for next-generation sequencing Simon Anders EBI is an Outstation of the European Molecular Biology Laboratory. Outline Exploring and checking alignment with alignment viewers Using
Genetomic Promototypes
 Genetomic Promototypes Mirkó Palla and Dana Pe er Department of Mechanical Engineering Clarkson University Potsdam, New York and Department of Genetics Harvard Medical School 77 Avenue Louis Pasteur Boston,
New Technologies for Sensitive, Low-Input RNA-Seq. Clontech Laboratories, Inc.
 New Technologies for Sensitive, Low-Input RNA-Seq Clontech Laboratories, Inc. Outline Introduction Single-Cell-Capable mrna-seq Using SMART Technology SMARTer Ultra Low RNA Kit for the Fluidigm C 1 System
Using Ensembl tools for browsing ENCODE data
 Using Ensembl tools for browsing ENCODE data Bert Overduin, Ph.D. Vertebrate Genomics Team EMBL - European Bioinformatics Institute Wellcome Trust Genome Campus Hinxton, Cambridge CB10 1SD United Kingdom
Control of Gene Expression
 Control of Gene Expression What is Gene Expression? Gene expression is the process by which informa9on from a gene is used in the synthesis of a func9onal gene product. What is Gene Expression? Figure
Nebula A web-server for advanced ChIP-seq data analysis. Tutorial. by Valentina BOEVA
 Nebula A web-server for advanced ChIP-seq data analysis Tutorial by Valentina BOEVA Content Upload data to the history pp. 5-6 Check read number and sequencing quality pp. 7-9 Visualize.BAM files in UCSC
Core Facility Genomics
 Core Facility Genomics versatile genome or transcriptome analyses based on quantifiable highthroughput data ascertainment 1 Topics Collaboration with Harald Binder and Clemens Kreutz Project: Microarray
Boolean Implications Identify Wilms Tumor 1 Mutation as a Driver of DNA Hypermethylation in Acute Myeloid Leukemia
 Boolean Implications Identify Wilms Tumor 1 Mutation as a Driver of DNA Hypermethylation in Acute Myeloid Leukemia Subarna Sinha PhD Department of Computer Science Principal Investigator: David Dill Daniel
RETRIEVING SEQUENCE INFORMATION. Nucleotide sequence databases. Database search. Sequence alignment and comparison
 RETRIEVING SEQUENCE INFORMATION Nucleotide sequence databases Database search Sequence alignment and comparison Biological sequence databases Originally just a storage place for sequences. Currently the
RNAseq / ChipSeq / Methylseq and personalized genomics
 RNAseq / ChipSeq / Methylseq and personalized genomics 7711 Lecture Subhajyo) De, PhD Division of Biomedical Informa)cs and Personalized Biomedicine, Department of Medicine University of Colorado School
Data Integration. Lectures 16 & 17. ECS289A, WQ03, Filkov
 Data Integration Lectures 16 & 17 Lectures Outline Goals for Data Integration Homogeneous data integration time series data (Filkov et al. 2002) Heterogeneous data integration microarray + sequence microarray
Current Motif Discovery Tools and their Limitations
 Current Motif Discovery Tools and their Limitations Philipp Bucher SIB / CIG Workshop 3 October 2006 Trendy Concepts and Hypotheses Transcription regulatory elements act in a context-dependent manner.
Searching Nucleotide Databases
 Searching Nucleotide Databases 1 When we search a nucleic acid databases, Mascot always performs a 6 frame translation on the fly. That is, 3 reading frames from the forward strand and 3 reading frames
Gene Expression Analysis
 Gene Expression Analysis Jie Peng Department of Statistics University of California, Davis May 2012 RNA expression technologies High-throughput technologies to measure the expression levels of thousands
DNA Methylation in MDS/MPD/AML: Implications for application
 DNA Methylation in MDS/MPD/AML: Implications for application James G. Herman, M.D. Professor of Oncology Evelyn Grollman Glick Scholar The Sidney Kimmel Comprehensive Cancer Center at Johns Hopkins Disclosures
Comparing Methods for Identifying Transcription Factor Target Genes
 Comparing Methods for Identifying Transcription Factor Target Genes Alena van Bömmel (R 3.3.73) Matthew Huska (R 3.3.18) Max Planck Institute for Molecular Genetics Folie 1 Transcriptional Regulation TF
Computational Genomics. Next generation sequencing (NGS)
") Computational Genomics Next generation sequencing (NGS) Sequencing technology defies Moore s law Nature Methods 2011 Log 10 (price) Sequencing the Human Genome 2001: Human Genome Project 2.7G$, 11 years
Computational Genomics Next generation sequencing (NGS) Sequencing technology defies Moore s law Nature Methods 2011 Log 10 (price) Sequencing the Human Genome 2001: Human Genome Project 2.7G$, 11 years
Discovery and Quantification of RNA with RNASeq Roderic Guigó Serra Centre de Regulació Genòmica (CRG) [email protected]
 roderic.guigo@crg.cat") Bioinformatique et Séquençage Haut Débit, Discovery and Quantification of RNA with RNASeq Roderic Guigó Serra Centre de Regulació Genòmica (CRG) [email protected] 1 RNA Transcription to RNA and subsequent
Bioinformatique et Séquençage Haut Débit, Discovery and Quantification of RNA with RNASeq Roderic Guigó Serra Centre de Regulació Genòmica (CRG) [email protected] 1 RNA Transcription to RNA and subsequent
Control of Gene Expression
 Control of Gene Expression (Learning Objectives) Explain the role of gene expression is differentiation of function of cells which leads to the emergence of different tissues, organs, and organ systems
GeneProf and the new GeneProf Web Services
 GeneProf and the new GeneProf Web Services Florian Halbritter [email protected] Stem Cell Bioinformatics Group (Simon R. Tomlinson) [email protected] December 10, 2012 Florian Halbritter
How many of you have checked out the web site on protein-dna interactions?
 How many of you have checked out the web site on protein-dna interactions? Example of an approximately 40,000 probe spotted oligo microarray with enlarged inset to show detail. Find and be ready to discuss
CRAC: An integrated approach to analyse RNA-seq reads Additional File 3 Results on simulated RNA-seq data.
 : An integrated approach to analyse RNA-seq reads Additional File 3 Results on simulated RNA-seq data. Nicolas Philippe and Mikael Salson and Thérèse Commes and Eric Rivals February 13, 2013 1 Results
Lecture 11 Data storage and LIMS solutions. Stéphane LE CROM [email protected]
 Lecture 11 Data storage and LIMS solutions Stéphane LE CROM [email protected] Various steps of a DNA microarray experiment Experimental steps Data analysis Experimental design set up Chips on catalog
BIO 3352: BIOINFORMATICS II HYBRID COURSE SYLLABUS
 BIO 3352: BIOINFORMATICS II HYBRID COURSE SYLLABUS NEW YORK CITY COLLEGE OF TECHNOLOGY The City University Of New York School of Arts and Sciences Biological Sciences Department Course title: Bioinformatics
GeneSifter: Next Generation Data Management and Analysis for Next Generation Sequencing
 for Next Generation Sequencing Dale Baskin, N. Eric Olson, Laura Lucas, Todd Smith 1 Abstract Next generation sequencing technology is rapidly changing the way laboratories and researchers approach the
Faculty of Medicine. Settore disciplinare: BIO/10. functional domains. Monica Soldi. IFOM-IEO Campus, Milan. Matricola n. R08407
 PhD degree in Molecular Medicine European School of Molecular Medicine (SEMM), University of Milan and University of Naples Federico II Faculty of Medicine Settore disciplinare: BIO/10 Establishment and
Systematic discovery of regulatory motifs in human promoters and 30 UTRs by comparison of several mammals
 Systematic discovery of regulatory motifs in human promoters and 30 UTRs by comparison of several mammals Xiaohui Xie 1, Jun Lu 1, E. J. Kulbokas 1, Todd R. Golub 1, Vamsi Mootha 1, Kerstin Lindblad-Toh
FlipFlop: Fast Lasso-based Isoform Prediction as a Flow Problem
 FlipFlop: Fast Lasso-based Isoform Prediction as a Flow Problem Elsa Bernard Laurent Jacob Julien Mairal Jean-Philippe Vert September 24, 2013 Abstract FlipFlop implements a fast method for de novo transcript
Lectures 1 and 8 15. February 7, 2013. Genomics 2012: Repetitorium. Peter N Robinson. VL1: Next- Generation Sequencing. VL8 9: Variant Calling
 Lectures 1 and 8 15 February 7, 2013 This is a review of the material from lectures 1 and 8 14. Note that the material from lecture 15 is not relevant for the final exam. Today we will go over the material
Vad är bioinformatik och varför behöver vi det i vården? a bioinformatician's perspectives
 Vad är bioinformatik och varför behöver vi det i vården? a bioinformatician's perspectives [email protected] 2015-05-21 Functional Bioinformatics, Örebro University Vad är bioinformatik och varför
The Human Genome Project
 The Human Genome Project Brief History of the Human Genome Project Physical Chromosome Maps Genetic (or Linkage) Maps DNA Markers Sequencing and Annotating Genomic DNA What Have We learned from the HGP?
INTERNATIONAL CONFERENCE ON HARMONISATION OF TECHNICAL REQUIREMENTS FOR REGISTRATION OF PHARMACEUTICALS FOR HUMAN USE Q5B
 INTERNATIONAL CONFERENCE ON HARMONISATION OF TECHNICAL REQUIREMENTS FOR REGISTRATION OF PHARMACEUTICALS FOR HUMAN USE ICH HARMONISED TRIPARTITE GUIDELINE QUALITY OF BIOTECHNOLOGICAL PRODUCTS: ANALYSIS
European Genome-phenome Archive database of human data consented for use in biomedical research at the European Bioinformatics Institute
 European Genome-phenome Archive database of human data consented for use in biomedical research at the European Bioinformatics Institute Justin Paschall Team Leader Genetic Variation / EGA ! European Genome-phenome
1. Introduction Gene regulation Genomics and genome analyses Hidden markov model (HMM)
") 1. Introduction Gene regulation Genomics and genome analyses Hidden markov model (HMM) 2. Gene regulation tools and methods Regulatory sequences and motif discovery TF binding sites, microrna target prediction
1. Introduction Gene regulation Genomics and genome analyses Hidden markov model (HMM) 2. Gene regulation tools and methods Regulatory sequences and motif discovery TF binding sites, microrna target prediction
Hidden Markov Models in Bioinformatics. By Máthé Zoltán Kőrösi Zoltán 2006
 Hidden Markov Models in Bioinformatics By Máthé Zoltán Kőrösi Zoltán 2006 Outline Markov Chain HMM (Hidden Markov Model) Hidden Markov Models in Bioinformatics Gene Finding Gene Finding Model Viterbi algorithm
200630 - FBIO - Fundations of Bioinformatics
 Coordinating unit: Teaching unit: Academic year: Degree: ECTS credits: 2015 200 - FME - School of Mathematics and Statistics 1004 - UB - (ENG)Universitat de Barcelona MASTER'S DEGREE IN STATISTICS AND
Alison Yao, Ph.D. July 2014
 * Alison Yao, Ph.D. Program Officer, Office of Genomics and Advanced Technologies Division of Microbiology and Infectious Diseases National Institute of Allergy and Infectious Diseases National Institutes
Human-Mouse Synteny in Functional Genomics Experiment
 Human-Mouse Synteny in Functional Genomics Experiment Ksenia Krasheninnikova University of the Russian Academy of Sciences, JetBrains [email protected] September 18, 2012 Ksenia Krasheninnikova
SUPPLEMENTARY METHODS
 SUPPLEMENTARY METHODS Description of parameter selection for the automated calling algorithm The first analyses of the HLA data were performed with the haploid cell lines described by Horton et al. (1).
Prof Brian McStay Wellcome Trust Senior Investigator Award April 2015- March 2020
 Prof Brian McStay Wellcome Trust Senior Investigator Award April 2015- March 2020 Career History BA (Genetics) Trinity College Dublin PhD University of Edinburgh (with Adrian Bird) Post-Doc Fred Hutchinson
SICKLE CELL ANEMIA & THE HEMOGLOBIN GENE TEACHER S GUIDE
 AP Biology Date SICKLE CELL ANEMIA & THE HEMOGLOBIN GENE TEACHER S GUIDE LEARNING OBJECTIVES Students will gain an appreciation of the physical effects of sickle cell anemia, its prevalence in the population,
Interaktionen von RNAs und Proteinen
 Sonja Prohaska Computational EvoDevo Universitaet Leipzig June 9, 2015 Studying RNA-protein interactions Given: target protein known to bind to RNA problem: find binding partners and binding sites experimental
Mass Spectrometry Signal Calibration for Protein Quantitation
 Cambridge Isotope Laboratories, Inc. www.isotope.com Proteomics Mass Spectrometry Signal Calibration for Protein Quantitation Michael J. MacCoss, PhD Associate Professor of Genome Sciences University of
When you install Mascot, it includes a copy of the Swiss-Prot protein database. However, it is almost certain that you and your colleagues will want
 1 When you install Mascot, it includes a copy of the Swiss-Prot protein database. However, it is almost certain that you and your colleagues will want to search other databases as well. There are very
Cloud-Based Big Data Analytics in Bioinformatics
 Cloud-Based Big Data Analytics in Bioinformatics Presented By Cephas Mawere Harare Institute of Technology, Zimbabwe 1 Introduction 2 Big Data Analytics Big Data are a collection of data sets so large
Why Taking This Course? Course Introduction, Descriptive Statistics and Data Visualization. Learning Goals. GENOME 560, Spring 2012
 Why Taking This Course? Course Introduction, Descriptive Statistics and Data Visualization GENOME 560, Spring 2012 Data are interesting because they help us understand the world Genomics: Massive Amounts
G E N OM I C S S E RV I C ES
 GENOMICS SERVICES THE NEW YORK GENOME CENTER NYGC is an independent non-profit implementing advanced genomic research to improve diagnosis and treatment of serious diseases. capabilities. N E X T- G E
Activity 7.21 Transcription factors
 Purpose To consolidate understanding of protein synthesis. To explain the role of transcription factors and hormones in switching genes on and off. Play the transcription initiation complex game Regulation
RT 2 Profiler PCR Array: Web-Based Data Analysis Tutorial
 RT 2 Profiler PCR Array: Web-Based Data Analysis Tutorial Samuel J. Rulli, Jr., Ph.D. qpcr-applications Scientist [email protected] Pathway Focused Research from Sample Prep to Data Analysis! -2-
Probabilistic methods for post-genomic data integration
 Probabilistic methods for post-genomic data integration Dirk Husmeier Biomathematics & Statistics Scotland (BioSS) JMB, The King s Buildings, Edinburgh EH9 3JZ United Kingdom http://wwwbiossacuk/ dirk
Next Generation Sequencing: Technology, Mapping, and Analysis
 Next Generation Sequencing: Technology, Mapping, and Analysis Gary Benson Computer Science, Biology, Bioinformatics Boston University [email protected] http://tandem.bu.edu/ The Human Genome Project took
Course Requirements for the Ph.D., M.S. and Certificate Programs
 Health Informatics Course Requirements for the Ph.D., M.S. and Certificate Programs Health Informatics Core (6 s.h.) All students must take the following two courses. 173:120 Principles of Public Health
Cloud BioLinux: Pre-configured and On-demand Bioinformatics Computing for the Genomics Community
 Cloud BioLinux: Pre-configured and On-demand Bioinformatics Computing for the Genomics Community Ntinos Krampis Asst. Professor J. Craig Venter Institute [email protected] http://www.jcvi.org/cms/about/bios/kkrampis/
In developmental genomic regulatory interactions among genes, encoding transcription factors
 JOURNAL OF COMPUTATIONAL BIOLOGY Volume 20, Number 6, 2013 # Mary Ann Liebert, Inc. Pp. 419 423 DOI: 10.1089/cmb.2012.0297 Research Articles A New Software Package for Predictive Gene Regulatory Network
BIO 3350: ELEMENTS OF BIOINFORMATICS PARTIALLY ONLINE SYLLABUS
 BIO 3350: ELEMENTS OF BIOINFORMATICS PARTIALLY ONLINE SYLLABUS NEW YORK CITY COLLEGE OF TECHNOLOGY The City University Of New York School of Arts and Sciences Biological Sciences Department Course title:
Gene Switches Teacher Information
 STO-143 Gene Switches Teacher Information Summary Kit contains How do bacteria turn on and turn off genes? Students model the action of the lac operon that regulates the expression of genes essential for
Tutorial for proteome data analysis using the Perseus software platform
 Tutorial for proteome data analysis using the Perseus software platform Laboratory of Mass Spectrometry, LNBio, CNPEM Tutorial version 1.0, January 2014. Note: This tutorial was written based on the information
Umbilical Cord Blood Stem Cells Current Status & Future Potential
 Umbilical Cord Blood Stem Cells Current Status & Future Potential Natasha Ali Assistant Professor Haematology Department of Pathology & Laboratory Medicine/Oncology The Aga Khan University Email: [email protected]
European Medicines Agency
 European Medicines Agency July 1996 CPMP/ICH/139/95 ICH Topic Q 5 B Quality of Biotechnological Products: Analysis of the Expression Construct in Cell Lines Used for Production of r-dna Derived Protein
Understanding the dynamics and function of cellular networks
 Understanding the dynamics and function of cellular networks Cells are complex systems functionally diverse elements diverse interactions that form networks signal transduction-, gene regulatory-, metabolic-
Integrating DNA Motif Discovery and Genome-Wide Expression Analysis. Erin M. Conlon
 Integrating DNA Motif Discovery and Genome-Wide Expression Analysis Department of Mathematics and Statistics University of Massachusetts Amherst Statistics in Functional Genomics Workshop Ascona, Switzerland
Hidden Markov models in gene finding. Bioinformatics research group David R. Cheriton School of Computer Science University of Waterloo
 Hidden Markov models in gene finding Broňa Brejová Bioinformatics research group David R. Cheriton School of Computer Science University of Waterloo 1 Topics for today What is gene finding (biological
Biochemistry Major Talk 2014-15. Welcome!!!!!!!!!!!!!!
 Biochemistry Major Talk 2014-15 August 14, 2015 Department of Biochemistry The University of Hong Kong Welcome!!!!!!!!!!!!!! Introduction to Biochemistry A four-minute video: http://www.youtube.com/watch?v=tpbamzq_pue&l
Bioinformatics Resources at a Glance
 Bioinformatics Resources at a Glance A Note about FASTA Format There are MANY free bioinformatics tools available online. Bioinformaticists have developed a standard format for nucleotide and protein sequences
The Therapeutic Potential of Human Umbilical Cord Blood Transplantation for Neonatal Hypoxic-Ischemic Brain Injury and Ischemic Stroke
 The Therapeutic Potential of Human Umbilical Cord Blood Transplantation for Neonatal Hypoxic-Ischemic Brain Injury and Ischemic Stroke a,b* b,c a a b b b b a b a b c 430 Wang et al. Acta Med. Okayama Vol.
Just the Facts: A Basic Introduction to the Science Underlying NCBI Resources
 1 of 8 11/7/2004 11:00 AM National Center for Biotechnology Information About NCBI NCBI at a Glance A Science Primer Human Genome Resources Model Organisms Guide Outreach and Education Databases and Tools
Genotyping by sequencing and data analysis. Ross Whetten North Carolina State University
 Genotyping by sequencing and data analysis Ross Whetten North Carolina State University Stein (2010) Genome Biology 11:207 More New Technology on the Horizon Genotyping By Sequencing Timeline 2007 Complexity
Biomedical Big Data and Precision Medicine
 Biomedical Big Data and Precision Medicine Jie Yang Department of Mathematics, Statistics, and Computer Science University of Illinois at Chicago October 8, 2015 1 Explosion of Biomedical Data 2 Types
PreciseTM Whitepaper
 Precise TM Whitepaper Introduction LIMITATIONS OF EXISTING RNA-SEQ METHODS Correctly designed gene expression studies require large numbers of samples, accurate results and low analysis costs. Analysis
Crime Scenes and Genes
 Glossary Agarose Biotechnology Cell Chromosome DNA (deoxyribonucleic acid) Electrophoresis Gene Micro-pipette Mutation Nucleotide Nucleus PCR (Polymerase chain reaction) Primer STR (short tandem repeats)
Exploratory Spatial Data Analysis
 Exploratory Spatial Data Analysis Part II Dynamically Linked Views 1 Contents Introduction: why to use non-cartographic data displays Display linking by object highlighting Dynamic Query Object classification
NIH/NIGMS Trainee Forum: Computational Biology and Medical Informatics at Georgia Tech
 ACM-BCB 2015 (Sept. 10 th, 10:00am-12:30pm) NIH/NIGMS Trainee Forum: Computational Biology and Medical Informatics at Georgia Tech Chair: Professor Greg Gibson Georgia Institute of Technology Co-Chair:
Biotechnology. Srivatsan Kidambi, Ph.D.
 Stem Stem Cell Cell Engineering-What, Biology and it Application Why, How?? to Biotechnology Srivatsan Kidambi, Ph.D. Assistant Professor Department of Chemical & Biomolecular Engineering University of
G&D. apoptosis, tumor suppressor and cell cycle research antibodies. 3 a A JOURNAL OF CELLULAR AND MOLECULAR BIOLOGY
 apoptosis, tumor suppressor and cell cycle research antibodies Genes & Development 3 a o G & Dee v e lno p m ee n t s Volume 21 No.4 February 15, 2007 A JOURNAL OF CELLULAR AND MOLECULAR BIOLOGY 21(4):
Genomes and SNPs in Malaria and Sickle Cell Anemia
 Genomes and SNPs in Malaria and Sickle Cell Anemia Introduction to Genome Browsing with Ensembl Ensembl The vast amount of information in biological databases today demands a way of organising and accessing
Using Galaxy for NGS Analysis. Daniel Blankenberg Postdoctoral Research Associate The Galaxy Team http://usegalaxy.org
 Using Galaxy for NGS Analysis Daniel Blankenberg Postdoctoral Research Associate The Galaxy Team http://usegalaxy.org Overview NGS Data Galaxy tools for NGS Data Galaxy for Sequencing Facilities Overview
NOVEL GENOME-SCALE CORRELATION BETWEEN DNA REPLICATION AND RNA TRANSCRIPTION DURING THE CELL CYCLE IN YEAST IS PREDICTED BY DATA-DRIVEN MODELS
 NOVEL GENOME-SCALE CORRELATION BETWEEN DNA REPLICATION AND RNA TRANSCRIPTION DURING THE CELL CYCLE IN YEAST IS PREDICTED BY DATA-DRIVEN MODELS Orly Alter (a) *, Gene H. Golub (b), Patrick O. Brown (c)
Network Analysis. BCH 5101: Analysis of -Omics Data 1/34
 Network Analysis BCH 5101: Analysis of -Omics Data 1/34 Network Analysis Graphs as a representation of networks Examples of genome-scale graphs Statistical properties of genome-scale graphs The search
Subtypes of AML follow branches of myeloid development, making the FAB classificaoon relaovely simple to understand.
 1 2 3 4 The FAB assigns a cut off of 30% blasts to define AML and relies predominantly on morphology and cytochemical stains (MPO, Sudan Black, and NSE which will be discussed later). Subtypes of AML follow