Risk Monitoring User Group
|
|
|
- Camilla Melton
- 10 years ago
- Views:
Transcription
1 Risk Monitoring User Group 22 nd April 2009 Manjit Flora Peter Cates
2 OBJECTIVE Introduce User Group to Dashboards and our project AGENDA Dashboard Primer Demonstration Project Overview Access Workshop
3 Dashboards, Metrics & KPIs Definitions & Best Practice Peter Cates TAH Consultant

4 Interacting with Information PCTs Step 1: Wade through reports Step 2: Discover reports with summaries Detailed Data Summarised Data Some Reports Numerous Reports Step 3: Copy data to Excel and summarise further Graphical Data Hand cranked Spreadsheets
5 Interacting with Information Best Practice Monitor Graphical Data Dashboards Analyse Summarised Data Dashboards & Reports Drill Through Detailed Data Reports TDWI Research, 2008 MAD Framework
6 Dashboards Key Features Graphical Indicators Visual Alerts Charts & Graphs Guided Analysis
7 Interacting with Information Monitor Graphical Data Dashboards Analyse Summarised Data Dashboards & Reports Drill Through Detailed Data Reports TDWI Research, 2008 MAD Framework

8 Detailed Data
9 Interacting with Information Monitor Graphical Data Dashboards Analyse Summarised Data Dashboards & Reports Drill Through Detailed Data Reports TDWI Research, 2008 MAD Framework
10 Summarised Data
11 Interacting with Information Monitor Graphical Data Dashboards Analyse Summarised Data Dashboards & Reports Drill Through Detailed Data Reports TDWI Research, 2008 MAD Framework
12 Graphical Data
13 Three Dashboard Types Operational Tactical Strategic
14 Operational Dashboards Emphasis on frequent monitoring of mission-critical operational process
15 Tactical Dashboards Emphasis on analysis and tracking over time

16 Strategic Dashboards Monitor strategic objectives, often using a formal methodology
17 Three Metric Types Lagging Indicators Leading Indicators Diagnostic Measures
18 Lagging Indicators Indicators of past performance Generally easy to define
19 Leading Indicators Indicators of future performance/outcomes Important to discover leading indicators which have the most influence on the lagging indicators Example: Leading Indicator Lagging Indicator Sales visit scheduled for next month > Sales revenue Customer repairs fixed first time > Customer satisfaction
20 Diagnostic Measures These are measures that are useful but don t fit into the other two categories. Example: Days until contract renewal
21 Key Performance Indicators (KPIs) The metrics used in dashboards are commonly termed Key Performance Indicators (KPIs) and should meet these characteristics: Aligned Actionable Easy to understand Predictive Few in number Owned Balanced and linked Trigger changes

22 KPI Characteristics
23 Interacting with Information User Roles Monitor Graphical Data Managers, Executives Analyse Summarised Data Analysts Drill Through Detailed Data Information Workers TDWI Research, 2008 MAD Framework
24 References & Further Reading The Data Warehousing Institute (TDWI) Business Intelligence Research and Whitepapers Performance Dashboards Measuring, Monitoring and Managing Your Business by Wayne Eckerson (John Wiley & Sons, 2005)
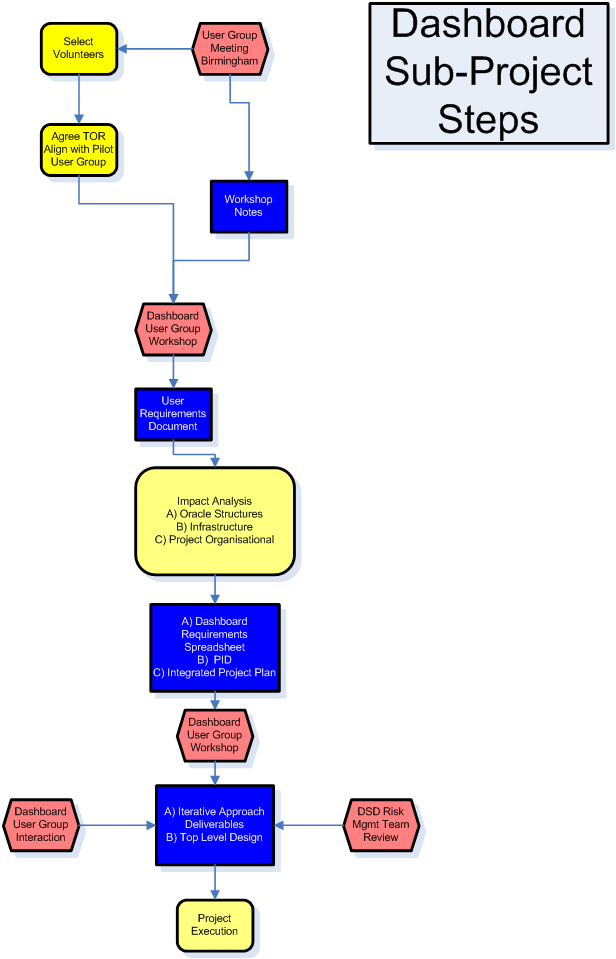
25 Dashboard Project Process Steps Manjit Flora TAH Project Manager
26
27 Dashboard User Group Terms of Reference
28 User Group Membership About 6 members for optimum group working Members should represent different roles within the PCT organisation Positive and enthusiastic towards change in the way DSD information is used Availability to take part in user group meetings and other online meetings Need to be member of the group till about April 2009 at least
29 User Group Tasks Champion the dashboard concepts, best practices & pitfalls As a team create a balanced set of KPIs to accurately show and predict contract performance Devise surveys & questions to get feedback of other PCT users Assistance with user acceptance process
30 Dashboard User Group Members Charles Brown Bury PCT Nick Brook - East Riding PCT Ruwan Wickramasinghe Hertfordshire PCT Kerrie Woods Coventry PCT Helen Simmonds Primary Care Commissioning/DH
31 Access workshop - Timings & discussion points 5 mins General feedback How would you and your colleagues use the provided dashboard screens? (Refer to screenshots) 25 mins - Access questions/discussion Are people familiar with all the metrics provided in the handout? Are additional metrics being used to monitor and improve access other than these? Should the following metrics appear on the dashboard, and it what form? March 2010/2011 demand New patients to NHS Agree on a screen design (Refer to screenshots) 5-10 mins Access feedback from all groups
Ten Mistakes to Avoid When Creating Performance Dashboards
 Ten Mistakes to Avoid When Creating Performance Dashboards Wayne W. Eckerson Wayne W. Eckerson is the director of research and services for TDWI, a worldwide association of business intelligence and data
Picturing Performance: IBM Cognos dashboards and scorecards for retail
 IBM Software Group White Paper Retail Picturing Performance: IBM Cognos dashboards and scorecards for retail 2 Picturing Performance: IBM Cognos dashboards and scorecards for retail Abstract More and more,
Digital Dashboards In Terminal Operations Management. AAPA Port Operations and IT Seminar June 9, 2011- Long Beach CA Frank J. Mazzella, APL Ltd.
 Digital Dashboards In Terminal Operations Management AAPA Port Operations and IT Seminar June 9, 2011- Long Beach CA Frank J. Mazzella, APL Ltd. What are Dashboards? Technology Tools That Provide Real-Time
How Do I Choose my KPIs?
 Best Practices in Dashboard Design Building a Dashboard System What tasks are involved in building the system? Building a Dashboard System What tasks are involved in building the system? Design Implementation
Performance Management and KPIs
 Performance Management and KPIs Outline Business Performance Management (BPM) Dashboards SSAS: KPI and Dashboards 2 Business Performance Management (BPM) 3 Business Performance Management (BPM) BPM encompasses
[ SARAH MERTZ. KPIs for Business Intelligence. Dallas Marks Session 207 [ GREG REISCHLEIN [ DAVID SWIERENGA ASUG INSTALLATION MEMBER
 KPIs for Business Intelligence Dallas Marks Session 207 [ GREG REISCHLEIN ASUG INSTALLATION MEMBER MEMBER SINCE: 2007 [ DAVID SWIERENGA ASUG INSTALLATION MEMBER MEMBER SINCE: 2005 [ SARAH MERTZ ASUG INSTALLATION
PROJECT MANAGEMENT METRICS, KPIs, AND DASHBOARDS A Guide to Measuring and Monitoring Project Performance
 PROJECT MANAGEMENT METRICS, KPIs, AND DASHBOARDS A Guide to Measuring and Monitoring Project Performance Harold Kerzner, Ph.D. Sr. Executive Director for Project Management The International Institute
How IT Can Help Companies Make Better, Faster Decisions
 How IT Can Help Companies Make Better, Faster Decisions How It Can Help Companies Make Better Faster Decisions Of the many different groups that make up a business organization sales, finance, human resources
Digital Dashboards In Terminal Operations Management
 Digital Dashboards In Terminal Operations Management AAPA Marine Terminal Management Training Sept. 12, 2013- Long Beach CA Frank J. Mazzella, APL Ltd. Page 2 What are Dashboards? Real-Time Visualization
With business intelligence, we create a learning organization that adapts quickly to market changes and stays one step ahead of the competition.
 With business intelligence, we create a learning organization that adapts quickly to market changes and stays one step ahead of the competition. Wayne W. Eckerson TDWI New to Business Intelligence? What
Dashboards PRESENTED BY: Quaid Saifee Director, WIT Inc.
 Dashboards PRESENTED BY: Quaid Saifee Director, WIT Inc. Presentation Outline 1. EPM (Enterprise Performance Management) Balanced Scorecard Dashboards 2. Dashboarding Process (Best Practices) 3. Case Studies
The Search for a Holy Grail: Best Practices for Defining KPIs
 The Search for a Holy Grail: Best Practices for Defining KPIs (Selected Slides) Kent Bauer Partner and Managing Director The Performance Group Data Warehousing & BI Conference Orlando, Florida September
uncommon thinking ORACLE BUSINESS INTELLIGENCE ENTERPRISE EDITION ONSITE TRAINING OUTLINES
 OBIEE 11G: CREATE ANALYSIS AND DASHBOARDS: 11.1.1.7 DURATION: 4 DAYS Course Description: This course provides step-by-step instructions for creating analyses and dashboards, which compose business intelligence
How To Understand The Difference Between A Scorecard And A Dashboard
 JULY 2006 Deploying s and s By Wayne W. Eckerson TDWI BEST PRACTICES REPORT Research Sponsors ADVIZOR Solutions Business Objects Celequest Corda Technologies Hyperion Solutions Microsoft MicroStrategy
QAD Enterprise Asset Management BI Metrics Demonstration Guide. May 2015 BI 3.11
 QAD Enterprise Asset Management BI Metrics Demonstration Guide May 2015 BI 3.11 Overview This demonstration focuses on one aspect of QAD Enterprise Asset Management Business Intelligence Metrics and shows
Dashboard Reporting Business Intelligence
 Dashboard Reporting Dashboards are One of 5 Styles of BI Applications Increasing Analytics & User Interactivity Advanced Analysis & Ad Hoc OLAP Analysis Reporting Ad Hoc Analysis Predictive Analysis Data
White Paper September 2009. Picturing Performance: IBM Cognos dashboards and scorecards for healthcare
 White Paper September 2009 Picturing Performance: IBM Cognos dashboards and scorecards for healthcare 2 Contents 5 Business problems Why do you use a dashboard or scorecard? 5 Business drivers Operational
Healthcare Performance Management Strategies for Highly Efficient Practices
 A Mariner White Paper Healthcare Performance Management Strategies for Highly Efficient Practices By Rob Capozziello, Practice Manager Michael McCarthy, Business Development Manager Mariner, Healthcare
Why 70% of Dashboard Initiatives Fail
 A Theoris Software White Paper 8888 Keystone Crossing Indianapolis, IN 46240 866-843-6747 www.theoris.com Why 70% of Dashboard Initiatives Fail By Greg Aldridge, Director July 2008 Introduction Dashboards
IMPLEMENTING HEALTHCARE DASHBOARDS FOR OPERATIONAL SUCCESS
 idashboards for Healthcare IMPLEMENTING HEALTHCARE DASHBOARDS FOR OPERATIONAL SUCCESS idashboards gives me access to real-time actionable data from all areas of the hospital. Internally, the adoption rate
Introduction to Business Intelligence
 IBM Software Group Introduction to Business Intelligence Vince Leat ASEAN SW Group 2007 IBM Corporation Discussion IBM Software Group What is Business Intelligence BI Vision Evolution Business Intelligence
QAD Business Intelligence
 QAD Business Intelligence QAD Business Intelligence (QAD BI) unifies data from multiple sources across the enterprise and provides a complete solution that enables key enterprise decision makers to access,
{Businesss. Intelligence. Overview. Dashboard Manager
 {Businesss Intelligence Overview Right information is the lifeblood of financial institutions in today s dynamic business environment. Yet many organisations struggle to provide the right information to
PROVIDING INSIGHT FOR OPERATIONAL SUCCESS
 idashboards for Financial Services PROVIDING INSIGHT FOR OPERATIONAL SUCCESS We had a huge leap in account openings once staff could see how their sales compared to other staff and branches. They now have
How To Improve Efficiency With Business Intelligence
 I White Paper Table of Contents Executive Summary.. 3 Improving Operational Efficiency With BI Is A High Priority.. 3 Why BI Is Important.. 3 BI Incorporates Multiple Applications.. 4 Data Consolidation
Real-Time Business Intelligence for the Utilities Industry
 Database Systems Journal vol. III, no. 4/2012 15 Real-Time Business Intelligence for the Utilities Industry Janina POPEANGĂ, Ion LUNGU Academy of Economic Studies, Bucharest, Romania, [email protected];
BUSINESS INTELLIGENCE WEEK
 BUSINESS INTELLIGENCE WEEK March 9-13, 2015 www.tdwi.org CORADIX Technology Consulting Ltd. in partnership with The Data Warehousing Institute (TDWI) is pleased to announce continued Business Intelligence
CRM for Business Intelligence
 CRM for Business Intelligence Real-time visibility into your business Strategise effectively and make informed business decisions with timely, accurate insight into your organisation. Maximizer CRM 2015
Microsoft Visio 2010 Business Intelligence
 Microsoft Visio 2010 Business Intelligence St. Louis SharePoint User Group Candy Parisi Microsoft Visio Solution Specialist April 10, 2012 Agenda Microsoft Business Intelligence Overview Visio Business
Dashboard for Financial Applications: A Partnered Approach 5.27.10
 Dashboard for Financial Applications: A Partnered Approach 5.27.10 Presenters Seth Landau EVP of Consulting Services MindStream Analytics [email protected] www.mindstreamanalytics.com Scott
Dashboard solutions Executive brief April 2007. Capitalize on the value of active dashboards to improve business flexibility and decision making.
 Dashboard solutions Executive brief April 2007 Capitalize on the value of active dashboards to improve business flexibility and decision making. Page 2 Contents 2 Executive summary 2 Dashboard trends and
A Primer. Asset Management Dashboards:
 Asset Management Dashboards: A Primer By Norman A. Pugh-Newby, CPPA, Federal Center Chapter High-performing organizations need information that is timely, clearly presented, and support effective decision
Applying the Principles of Business Intelligence to Improve Collections Performance. A Decision Analytics briefing paper from Experian
 Applying the Principles of Business Intelligence to Improve Collections Performance A Decision Analytics briefing paper from Experian February 2007 Introduction Deploying Business Intelligence tools within
WHITEPAPER. Creating and Deploying Predictive Strategies that Drive Customer Value in Marketing, Sales and Risk
 WHITEPAPER Creating and Deploying Predictive Strategies that Drive Customer Value in Marketing, Sales and Risk Overview Angoss is helping its clients achieve significant revenue growth and measurable return
ElegantJ BI. White Paper. Key Performance Indicators (KPI) A Critical Component of Enterprise Business Intelligence (BI)
 A Critical Component of Enterprise Business Intelligence (BI)") ElegantJ BI White Paper Key Performance Indicators (KPI) A Critical Component of Enterprise Business Intelligence (BI) Integrated Business Intelligence and Reporting for Performance Management, Operational
ElegantJ BI White Paper Key Performance Indicators (KPI) A Critical Component of Enterprise Business Intelligence (BI) Integrated Business Intelligence and Reporting for Performance Management, Operational
FIVE STEPS FOR DELIVERING SELF-SERVICE BUSINESS INTELLIGENCE TO EVERYONE CONTENTS
 FIVE STEPS FOR DELIVERING SELF-SERVICE BUSINESS INTELLIGENCE TO EVERYONE Wayne Eckerson CONTENTS Know Your Business Users Create a Taxonomy of Information Requirements Map Users to Requirements Map User
How to Create and Deploy Effective Metrics
 FIRS T QUA R T ER 2009 TDWI BEST PRACTICES REPORT PERFORMANCE MANAGEMENT STR ATEGIES How to Create and Deploy Effective Metrics By Wayne W. Eckerson Co-sponsored by www.tdwi.org FIRST QUARTER 2009 TDWI
THE ROLE OF BUSINESS INTELLIGENCE IN BUSINESS PERFORMANCE MANAGEMENT
 THE ROLE OF BUSINESS INTELLIGENCE IN BUSINESS PERFORMANCE MANAGEMENT Pugna Irina Bogdana Bucuresti, [email protected], tel : 0742483841 Albescu Felicia Bucuresti [email protected] tel: 0723581942 Babeanu
Business Intelligence
 Business Intelligence What is it? Why do you need it? This white paper at a glance This whitepaper discusses Professional Advantage s approach to Business Intelligence. It also looks at the business value
CXO Dashboards. How to drive business performance with certainty. 2009 CXO Dashboards
 CXO Dashboards How to drive business performance with certainty Several executives find it difficult to manage their strategic objectives with certainty Too many pressures to balance Not enough visibility
Creating Service Desk Metrics
 Creating Service Desk Metrics Table of Contents 1 ITIL, PINK ELEPHANT AND ZENDESK... 3 2 IMPORTANCE OF MONITORING, MEASURING AND REPORTING... 3 2.1 BALANCED MANAGEMENT INFORMATION CATEGORIES... 3 2.2 CSFS,
trilyst TM Presents Valeh Nazemoff www.acolyst.com
 trilyst TM Presents The Importance, Process, and Consideration of a Data Model and Data Management Application in Delivering a Business Intelligence (BI) System for Data Performance Management Valeh Nazemoff
How To Manage A Project Management Information System In Sharepoint
 SharePoint 2010 for Project Management Course SP03; 3 Days, Instructor-led Course Description Leverage Microsoft SharePoint to increase the success rate of your projects and meetings in this SharePoint
Priyo Lahiri Partner Technical Consultant [email protected] Microsoft Corporation
 Priyo Lahiri Partner Technical Consultant [email protected] Microsoft Corporation Introduction to Business Intelligence Trends in BI BI (Insights) in SharePoint 2010 Demo Business Insights in Microsoft
Executive Summary...2. Introduction...3. Definitions...3. Why Operational Performance Optimization...4
 Optimizing Operational Performance from a Financial Management Perspective Executive Summary...2 Introduction...3 Definitions...3 Why Operational Performance Optimization....4 An Introduction to Optimizing
Introducing CDK s Business Intelligence. Your daily intelligence briefing. The right information right when you need it.
 Introducing CDK s Business Intelligence Your daily intelligence briefing. The right information right when you need it. Your business intelligence right when you need it Business Intelligence from CDK
Corporate Performance Management
 Corporate Performance Management Review of Performance Packs Proposed Corporate Performance Framework Author: David O Brien Date: 18 August 2014 1 Copyright 2014, Health and Social Care Information Centre.
Oracle BI 11g R1: Create Analyses and Dashboards
 Oracle University Contact Us: Local: 1800 103 4775 Intl: +91 80 67863102 Oracle BI 11g R1: Create Analyses and Dashboards Duration: 5 Days What you will learn This Oracle BI 11g R1: Create Analyses and
QAD ENTERPRISE APPLICATIONS
 IS BUILT FOR MANUFACTURERS, BUILT FOR YOU Effective manufacturers depend on their enterprise resource planning (ERP) solution to streamline business operations and to scale and adapt as their business
P16_IBM_WebSphere_Business_Monitor_V602.ppt. Page 1 of 17
 Welcome to the IBM WebSphere Business Monitor presentation as part of the SAP integration workshop. This presentation will give you an introduction to the WebSphere Business Monitor and monitoring over
MS EXCEL BUSINESS DASHBOARDS WORKSHOP
 Learn to Present Your data MS EXCEL BUSINESS DASHBOARDS WORKSHOP 23-26 March 2015 20-23 April 2015 07-10 September 2015 LOCATION Neovartis Training Center GBCORP Tower, Bahrain Financial Harbour Kingdom
performance management strategies
 First quarter 2009 TDWI best practices Report performance management strategies How to Create and Deploy Effective Metrics By Wayne W. Eckerson www.tdwi.org Research Sponsors Business Objects, an SAP company
QAD Business Intelligence Overview Demonstration Guide. May 2015 BI 3.11
 QAD Business Intelligence Overview Demonstration Guide May 2015 BI 3.11 Overview This demonstration shows how QAD Business Intelligence supports the vision of the Effective Enterprise; where every business
Business Intelligence
 WHITEPAPER Business Intelligence Solution for Clubs This whitepaper at a glance This whitepaper discusses the business value of implementing a business intelligence solution at clubs and provides a brief
CEB Finance Leadership Council Membership Program Overview
 For Midsized Companies CEB Finance Leadership Council Membership Program Overview Who We Are CEB is the leading member-based advisory company. By combining the best practices of thousands of member companies
SAP Business One and SAP HANA
 SAP Business One and SAP HANA High Performance Analytic Appliance Supernova Forum May, 2014 Hana Adoption Continued innovation Key message HANA innovations adds more value for you the customer Key elements
DATA VISUALIZATION AND DISCOVERY FOR BETTER BUSINESS DECISIONS
 TDWI research TDWI BEST PRACTICES REPORT THIRD QUARTER 2013 EXECUTIVE SUMMARY DATA VISUALIZATION AND DISCOVERY FOR BETTER BUSINESS DECISIONS By David Stodder tdwi.org EXECUTIVE SUMMARY Data Visualization
Using Business Intelligence to Achieve Sustainable Performance
 Cutting Edge Analytics for Sustainable Performance Using Business Intelligence to Achieve Sustainable Performance Adam Getz Principal, About is a software and professional services firm specializing in
Best Practices in Dashboard and Scorecard Design. Catie Sirie Brett Olmstead
 Best Practices in Dashboard and Scorecard Design Catie Sirie Brett Olmstead 1 Today s Agenda Understand your Objectives Choose a Framework Align Measures Build Dashboards Engaging Users Ongoing Maintenance
Bringing Data-driven Decision Making to Desktops in your District
 Bringing Data-driven Decision Making to Desktops in your District By David Fitz Fitzgerald Mariner Education Group Manager 2719 Coltsgate Road Charlotte, NC 28211 tel. 704.540-9500 fax. 704.540-9501 web.
Using Predictions to Power the Business. Wayne Eckerson Director of Research and Services, TDWI February 18, 2009
 Using Predictions to Power the Business Wayne Eckerson Director of Research and Services, TDWI February 18, 2009 Sponsor 2 Speakers Wayne Eckerson Director, TDWI Research Caryn A. Bloom Data Mining Specialist,
Chapter 9 Basics of Enterprise Reporting. Fundamentals of Business Analytics RN Prasad and Seema Acharya
 Chapter 9 Basics of Enterprise Reporting Fundamentals of Business Analytics Learning Objectives and Learning Outcomes Learning Objectives 1. To introduce the Balanced Score Card (Kaplan and Norton s) 2.
Keeping up with the KPIs 10 steps to help identify and monitor key performance indicators for your business
 Keeping up with the KPIs 10 steps to help identify and monitor key performance indicators for your business KNOW YOUR KPI A key performance indicator (KPI) is a performance measure (metric) designed to
Northcraft Analytics. Overview
 Northcraft Analytics Overview Metrics Discovery Advanced Analytical Capabilities Simple for Anyone Unlimited User Licenses Quick Implementation 2 Why Northcraft? What s in the catalog? Metrics Catalog
WHY DATA VISUALIZATION?
 idashboards On-Premises WHY DATA VISUALIZATION? An idashboards ebook Why Data Visualization? An idashboards ebook Contents 1. What are Dashboards? 3 Why Data Visualization? 2. Who is idashboards? 4 3.
QAD Field Service Scheduler Demonstration Guide. May 2015 EE2015
 QAD Field Service Scheduler Demonstration Guide May 2015 EE2015 Overview This demonstration focuses on one aspect of QAD SSM Field Service Scheduler and shows how this functionality supports the vision
Business Intelligence & Product Analytics
 2010 International Conference Business Intelligence & Product Analytics Rob McAveney www. 300 Brickstone Square Suite 904 Andover, MA 01810 [978] 691 8900 www. Copyright 2010 Aras All Rights Reserved.
Enterprise Dashboards: The Strategic Role of the CIO. Professor Vallabh Sambamurthy Eli Broad College of Business Michigan State University
 Enterprise Dashboards: The Strategic Role of the CIO Professor Vallabh Sambamurthy Eli Broad College of Business Michigan State University Objectives How do firms compete effectively in the digital era?
Flinders demands a new beginning Building a Business Analytics capability using a blended approach with a small team.
 Flinders demands a new beginning Building a Business Analytics capability using a blended approach with a small team. Presenter: Andrea Matulick, Business Analytics Manager Planning Service Unit Office
FINANCIAL REPORTING WITH BUSINESS ANALYTICS
 www.ifsworld.com FINANCIAL REPORTING WITH BUSINESS ANALYTICS LEIF JOHANSSON BUSINESS SOLUTIONS CONSULTANT BILL NOBLE IMPLEMENTATION MANAGER 2009 IFS AGENDA FINANCIAL REPORTING WITH BA Architecture Business
CRM for Business Intelligence
 DATA SHEET CRM for Business Intelligence MAXIMIZER CRM Published By Real-time visibility into your business Strategize effectively and make informed business decisions with timely, accurate insight into
Creating Requirements Specification for Asset Management Dashboards Norman A. Pugh-Newby, CPPA
 Creating Requirements Specification for Asset Management Dashboards Norman A. Pugh-Newby, CPPA A key enabler to achieving effective asset management is the establishment of a state-of-theart capability
Banking Industry Performance Management
 A MICROSOFT WHITE PAPER Banking Industry Performance Management Using Business Intelligence to Increase Revenue and Profitability Software for the business. Overview Today, banks operate in a complex,
Measuring Program Effectiveness an introduction to the Performance Dashboard. Objectives
 Measuring Program Effectiveness an introduction to the Performance Dashboard for the Ontario Literacy Coalition January 19 th 2012 Dr. Alan C. Middleton Objectives 1. to introduce the Performance Dashboard
TDWI Checklist report
 TDWI research TDWI Checklist report Self-Service BI By Wayne W. Eckerson Sponsored by www.tdwi.org TDWI Checklist report Self-Service BI JULY 2009 By Wayne Eckerson TABLE OF CONTENTS 2 FOREWORD 2 NUMBER
Providing business insurance advice and management solutions
 Providing business insurance advice and management solutions Eureka TBIAS is a London based independent consultancy owned by its employees providing business insurance advice and management solutions to
Discussion Outline. A. KPIs Defined. B. Why KPIs Matter. C. KPI Menu. D. Implementation. E. Example KPIs. F. Pitfalls
 Discussion Outline A. KPIs Defined B. Why KPIs Matter C. KPI Menu D. Implementation E. Example KPIs F. Pitfalls 1 Key Performance Indicators (KPI s) Defined Periodic assessment of an organization, business
Absoft White Paper A guide to Mobile Business Intelligence in SAP. Mark Barton Absoft Limited
 Absoft White Paper A guide to Mobile Business Intelligence in SAP Mark Barton Absoft Limited Executive summary Contents Executive summary Executive summary 1 Introduction 2 Why Mobile BI? Why now? 3 The
Business Intelligence with SharePoint 2010
 Business Intelligence with SharePoint 2010 August 2011 Asad Mahmood Head Of Business Analytics Consulting E: [email protected] T: @MrAsadMahmood Symon Garfield Chief Technology Officer E:
Implementing Data Models and Reports with Microsoft SQL Server
 Course 20466C: Implementing Data Models and Reports with Microsoft SQL Server Course Details Course Outline Module 1: Introduction to Business Intelligence and Data Modeling As a SQL Server database professional,